Stock Picks Bob's Advice
Monday, 21 April 2008
Ametek (AME)---A New Podcast Posted!
Hello Friends! Thanks so much for stopping by and visiting my blog, Stock Picks Bob's Advice! As always, please remember that I am an amateur investor, so please remember to consult with your professional investment advisers prior to making any investment decisions based on information on this website.
I got around to posting another podcast tonight, and if you would like to hear me discuss my Ametek (AME) pick, you can click
HERE
Thanks for dropping by! If you have any comments or questions, please feel free to leave them on the blog or email me at bobsadviceforstocks@lycos.com.
Yours in investing,
Bob
Ametek (AME) "Revisiting a Stock Pick"
Hello Friends! Thanks so much for stopping by and visiting my blog, Stock Picks Bob's Advice! As always, please remember that I am an amateur investor, so please remember to consult with your professional investment advisers prior to making any investment decisions based on information on this website.
 I want to try to make this a brief post and get right to the point. (Is that possible for me?)
O.K. here is the skinny:
AMETEK (AME) IS RATED A BUY
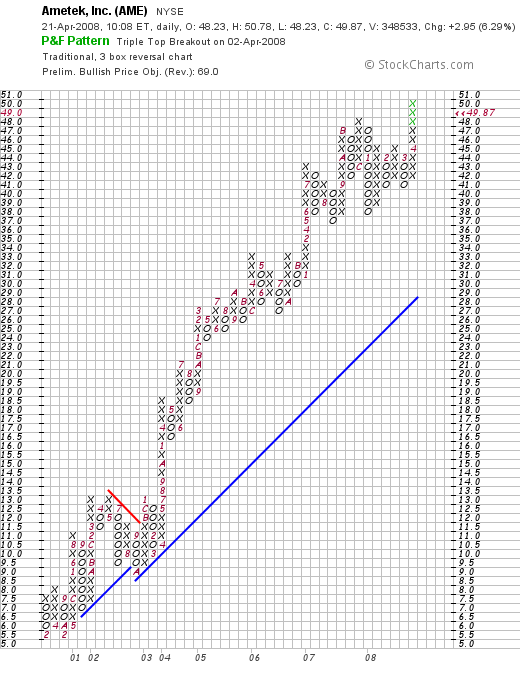
 I do not own any shares or options on this stock. I first reviewed Ametek (AME) on this blog on January 25, 2007 when the stock was trading at $34.28. AME, as I write, is trading at $49.53, up $2.61 or 5.56% on the day, finding a place on the top % gainers of the NYSE.
Ametek reported terrific first quarter 2008 results today before the open. They beat expectations and they increased guidance. A great day for announcements and the stock!
The "5-Yr Restated" financials are gorgeous. They even pay a dividend and are raising it regularly. Valuation is reasonable with a p/e at 23.47 and a PEG at 1.19.
Finally the chart looks terribly strong! What is there NOT to like?
O.K. that was the quick and dirty on Ametek (AME). I am usually far more verbose but I really wanted to get this one out and do it in brief.
Thanks for dropping by! If you have any comments or questions, please feel free to leave them on the blog or email me at bobsadviceforstocks@lycos.com.
Yours in investing,
Bob
Sunday, 20 April 2008
NEW Podcast on Satyam (SAY) Posted!
Just a quick note to let all of you know that I got around to posting a new 'radio show' on Satyam (SAY) and if you would like to you can download this show
HERE
Have a great week ahead!
Yours in investing,
Bob
"Looking Back One Year" A review of stock picks from the week of October 2, 2006

Hello Friends! Thanks so much for stopping by and visiting my blog, Stock Picks Bob's Advice! As always, please remember that I am an amateur investor, so please remember to consult with your professional investment advisers prior to making any investment decisions based on information on this website.
Last weekend, I reviewed the week of September 25, 2006. Going a week ahead, let's take a look at the week of October 2, 2006, a week in which I posted a single stock, Guess (GES).
These reviews all assume a 'buy and hold strategy' while in fact I advocate as well as employ a disciplined investment portfolio management strategy which requires to sell declining stocks if they incur small losses, and to sell appreciating stocks in part if they reach stock prices on the upside. The difference between these strategies would certainly affect performance and should be given consideration when reading these reviews.
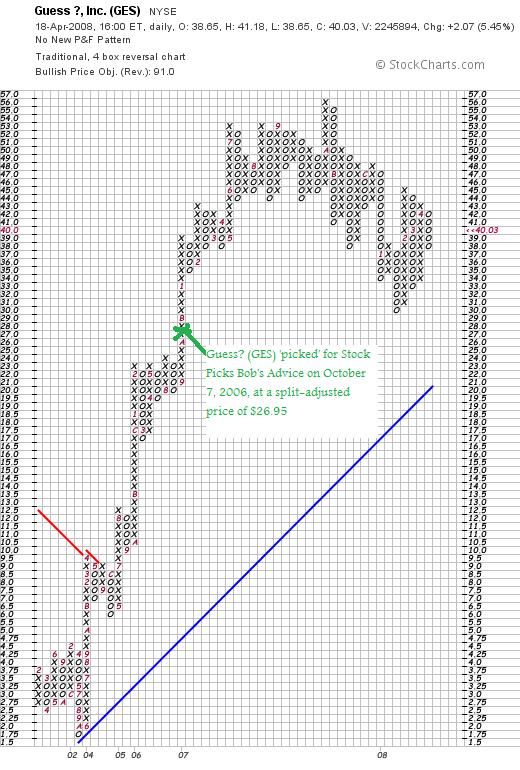
 On October 7, 2006, I posted Guess (GES) when it was trading at $53.89/share. Adjusted for a 2:1 stock split on March 13, 2007, this worked out to a price of $26.95. With GES closing at $40.03 on April 18, 2008, this works out to a gain of $13.08 or 48.5% since posting. I do not own any shares nor do I have any options on this stock.
Let's take a closer look at this company and see if the stock still deserves a spot on my blog! I will share with you why I believe that
GUESS? (GES) IS RATED A HOLD
What exactly does this company do?
According to the Yahoo "Profile" on Guess (GES), the company
 "...designs, markets, distributes, and licenses lifestyle collections of apparel and accessories for men, women, and children. The company's products include collections of denim and cotton clothing, including jeans, pants, overalls, skirts, dresses, shorts, blouses, shirts, jackets, and knitwear. It also grants licenses to manufacture and distribute a range of products, which comprise eyewear, watches, handbags, footwear, kids' and infants' apparel, leather apparel, swimwear, fragrance, jewelry, and other fashion accessories."
How did they do in the latest quarter?
On March 19, 2008, Guess? (GES) reported 4th quarter 2008 results. For the quarter ending Februar 2, 2008, the company reported total net revenue of $514.6 million, up 29.9% from $396.2 million reported the prior year. Comparable store sales grew 13.1% during the quarter.
Net earnings for the quarter increased 20.3% to $55.2 million from $45.9 million during the same period the prior year. Diluted earnings per share were up 20.4% to $.59 from $.49 the prior year.
The company beat expectations with these results. Analysts surveyed by Thomson Financial had been expecting earnings of $.57/share on $470 million in revenue.
However, the company lowered guidance for the first quarter of 2009. Analysts had been expecting $.47/share on revenue of $450.6 million. However, Guess now expects earnings between $.44 to $.46 on $445 to $460 million in revenue.
How about longer-term results?
Reviewing the Morningstar.com '5-Yr Restated' financials on GES, unfortunately there is a very incomplete picture present. What we can see is that the company is generating free cash flow, and the balance sheet is solid.
What does the chart look like?
Looking at the 'point & figure' chart on Guess? (GES) from StockCharts.com, we can see the shar appreciation in stock price from a low of $1.75/share in October, 2002, to a high of $56 in October, 2007. The stock has been under pressure recently, along with the entire market, but has stayed well above support levels.
Summary: What do I think about Guess? (GES)?
Actually, except for the weak retail environment that our nation is facing, I still like Guess just fine :). The latest quarter was strong, but the company reduced guidance slightly. The chart looks adequate. Unfortunately, I don't have the longer-term results from Morningstar.
This was a great stock pick for the week. Thus the only pick showed a gain of 48.5% since posting.
If you have any comments or questions, please feel free to leave them on the blog or email me at bobsadviceforstocks@lycos.com. If you get a chance, be sure and visit my Covestor Page where my actual trading portfolio is tracked (I was doing well until the recent sell-off in VIVO stock), and my SocialPicks page where my stock picks and my blog entries are reviewed since the beginning of 2007. And if you still have some interest, be sure and visit my Podcast page where you can download an mp3 of me discussing one of the many stocks I write about here on the blog.
That's about it for the weekend! Wishing you all a wonderful Monday and a healthy and successful week ahead!
Yours in investing,
Bob
Saturday, 19 April 2008
Satyam Computer Services (SAY) "Revisiting a Stock Pick"
Hello Friends! Thanks so much for stopping by and visiting my blog, Stock Picks Bob's Advice! As always, please remember that I am an amateur investor, so please remember to consult with your professional investment advisers prior to making any investment decisions based on information on this website.
 It was a nice change to see stocks move higher Friday with the Dow closing at 12,849.36, up 226.87, the Nasdaq closing at 2,402.97, up 61.14, and the S&P 500 closing at 1,390.33, up 24.77 on the day.
The stock market appeared to rally initially, as reported, on the back of the Citigroup (C) announcement of earnings, which although disappointing must have allayed some fears about possibly even worse results. In addition, perennial favorite Google (GOOG), zoomed higher by $89.87 or 20% after reporting a 30% increase in earnings, exceeding expectations.
With the market acting almost giddy, I thought it would be a good time to take a look at the top % gainers lists and see if I could review a stock that might fit the criteria that I find important.
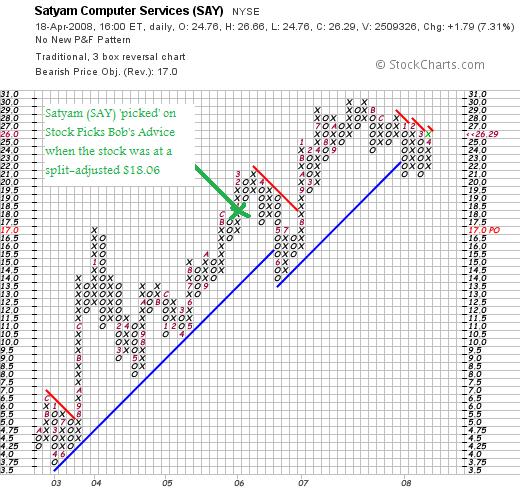
Looking at the list of top % gainers on the NYSE, I found Satyam (SAY), an old favorite of mine that I have also owned in the past, but which I no longer currently own any shares or options, making the list closing at $26.29, up $1.79 or 7.31% on the day. Let me explain why I like this stock and why
SATYAM (SAY) IS RATED A BUY
First of all let me explain that I call this stock a "favorite" because I have reviewed this stock previously---on December 15, 2005, almost 2 1/2 years ago---when the stock was trading at $36.11. Adjusting for a 2:1 stock split on October 18, 2006, this represents a pick price of $18.06. Thus with the stock trading at $26.29 this past Friday, this represents a gain of $8.23 or 45.6% since posting. Unfortunately, I was unable to 'hand on' to this stock which I owned for an interval and instead was 'shaken out'.
What exactly does this company do?
According to the Yahoo "Profile" on Satyam, the company
 "...provides information technology (IT) services and business process outsourcing (BPO) services in the United States, Europe, the Middle East, and the Asia-Pacific region. It offers application development and maintenance services, consulting and enterprise business solutions, extended engineering solutions, and infrastructure management services."
Beyond all of that 'marketing talk', the fact remains that Satyam is a leading outsourcing firm. As reported in 2006 in the Hindu Business Line:
"IT services provider Satyam Computer Services Ltd, has been ranked as the world's leading engineering services outsourcing vendor by the Brown-Wilson Group (BWG).
A BWG survey analysed 872 information technology and engineering outsourcing vendors in 63 countries and its results appeared in the company's "Black Book of Outsourcing," a highly respected publication.
Satyam led in several categories, including vendor overall preference, flexible pricing and brand image."
It has been a common-place event more many companies to outsource IT services to India and elsewhere to provide this service at a lower cost than available in America. However, one of the beneficial effects of the decline in the dollar value has been that it may once again be cost-effective to provide some of these services and manufacturing state-side instead of overseas. This insourcing, as it is called, is best exemplified by a story about IKEA, the European furniture manufacturer, which has announced plans to manufacture in the United States rather than in Poland.
How did the company do in the latest quarter?
On January 21, 2008, Satyam (SAY) reported 3rd quarter results for the quarter ended December 31, 2007. Revenue came in at $562.9 million, up 49.9% year-over-year and up 10.5% sequentially. Net income was $109.7 million, up 54.3% from the prior year and up 7.7% from the prior quarter. Basic earnings came in at $.33/share, up 50% from last year, and up 6.5% from the prior quarter. Certainly a beautiful earnings report from my perspective.
The company raised guidance for 2008, which guidance now between $2.119.2 and $2.122 billion, suggesting a growth rate beetween 45.0 and 45.2% over the 2007 results. Earnings were estimated for 2008 to come at $1.27/share suggesting a growth rate of 39.6% over the prior year.
How about longer-term results?
Reviewing the Morningstar.com "5-Yr Restated" financials on Satyam (SAY), we can see the steady picture of revenue growth from $459 million in 2003 to $1.46 billion in 2007. Earnings during this same period increased from $.26/share in 2003 to $.90/share in 2007. The company initiated dividends in 2005 at $.10/share and has increased it regularly to $.15/share reported in 2007. Meanwhile, outstanding shares have barely budged, increasing from 319 million shares in 2003 to 333 million in 2007.
Free cash flow is positive and increasing recently with $132 million reported in 2005 and $180 million reported in 2007.
The balance sheet is solid from my perspective with $152 million in cash and $457 million in other current assets, compared to $211.2 million in current liabilities and the relatively small amount of long-term liabilities totaling $41.9 million. Thus, calculating the current ratio, we obtain a result of 2.88, a very healthy ratio from my perspective.
What about some valuation numbers on this stock?
Using the Yahoo "Key Statistics" on Satyam as a guide, we can see that this is a large cap stock with a market capitalization of $8.80 billion. The trailing p/e is a moderate 21.91, with a forward p/e of 17.53. The PEG ratio confirms the reasonable valuation of this stock with a value of 0.96.
Reviewing data from the Fidelity.com eresearch website, we can see that Satyam (SAY) is fully valued in terms of the Price/Sales (TTM) ratio which comes in at 4.52 relative to the industry average of 3.32.
In terms of the Return on Equity (TTM), SAY does a bit better with a figure of 25.62% compared to the industry average of (26.50)%. The company also does better on Return on Assets (TTM) with 21.52% figure, relative to the industry average of 12.48%.
Finishing up with Yahoo, there are 334.77 million shares outstanding. Yahoo reports that as of 3/26/08, there were 7.71 million shares out short representing a rather sizeable short ratio of 5.1 trading days. This is up from the prior month figure of 6.81 million shares, which also suggests a possible short squeeze in the making as this stock climbs higher.
As I noted above, the company pays a dividend with a forward dividend rate of $.14/share yielding 0.6%. The last stock split, as I have already mentioned, was a 2:1 stock split on October 18, 2006.
What does the chart look like?
Examining the 'point & figure' chart on Satyam (SAY) from StockCharts.com, we can see that the stock has recently been under some pressure but has not convincingly broken-down from its steady increase from April, 2003, when the stock was trading as low as $3.75, to its peak in October, 2007, when the stock bounced against a high of $30/share. The stock certainly doesn't appear 'over-extended'.
Summary: What do I think?
Well, needless to say, I like this stock. I am not sure if I am enthusiastic about the possible effects on American jobs of 'outsourcing' but with global trade, this is fairly unavoidable. And besides, with the insourcing that may become more common, as with the Ikea story, jobs may be returning home. We can at least hope.
Anyhow, the company moved higher Friday along with the rest of the market. The large number (from my perspective) of shares out short may also be driving the stock to higher prices as short-sellers may be scrambline to cover their pessimistic wagers.
The latest quarter was strong and the company raised guidance. The longer-term view is equally impressive with steady revenue growth, earnings growth, and even dividend growth! Outstanding shares have been relatively quite stable and free cash flow is positive. The balance sheet is solid.
Valuation-wise, the company sells at a modest p/e with a great PEG ratio reported. Price/Sales is a bit rich but the company is more profitable than its peers as judged by the Return on Equity and Return on Assets ratios.
Finally, the chart looks satisfactory with the price undergoing a recent period of price consolidation and with the chart on the verge of 'breaking out' assuming the rest of the market holds up.
In other words this is my kind of stock! Now, if only I had been able to hang on to the shares I have owned in the past. Well, that is 'water under the bridge'.

Instead of kicking myself on this one, I shall wait for a signal from my portfolio that might give me the permission slip to be adding a new position to my portfolio which still consists of just six stocks.
Thanks again for visiting! If you have any comments or questions, please feel free to leave them on the blog or email me at bobsadviceforstocks@lycos.com. If you get a chance, be sure and visit my Covestor Page where you can review my actual Trading Portfolio performance, my SocialPicks Page where you can monitor my stock picks from the first of 2007, and my Podcast Page where you can download some mp3's of me discussing some of the many stocks discussed here on this website.
Have a great weekend everyone!
Yours in investing,
Bob
Thursday, 17 April 2008
Meridian Bioscience (VIVO) 'Taken Down a Notch!'
Hello Friends! Thanks so much for stopping by and visiting my blog, Stock Picks Bob's Advice! Please remember that I am an amateur investor, so please remember to consult with your professional investment advisers prior to making any investment decisions based on information on this website.
 I would somehow be remiss if I didn't at least comment on the AWFUL trading activity in Meridian (VIVO) today. It was made doubly worse after just writing about this stock a few days ago (on April 12, 2008), and now seeing the price take a big hit on what was an earnings disappointment. VIVO closed today at $27.19, down $(6.54) or (19.39)% on the day. With this as one of my remaining six issues, my trading account really took a hit on what worked out to be a relatively stable market.
This morning before the open, the company announced 2nd quarter 2008 results. Net sales came in at $36.2 million, up 13% from the prior year. Net earnings were $7.3 million, up 24% over the same period last year. Diluted earnings per share were $.18, up 20% year-over-year. They even announced a dividend of $.14/share for the quarter with an indicated rate of $.56/share, up 27% over the prior fiscal year. However, this wasn't enough for the street!
The company missed expectations on both earnings and revenue. Earnings were supposed to come in (according to analysts polled by Thomson Financial) at $.19/share (they came in at $.18). And revenue was supposed to come in at $37 million, and the company only came in at $36.2 million.
As was reported:
"The life science unit was hurt by lower demand from a major viral protein customer and a delay in shipment to a biopharma partner, CEO John Kraeutler said in a statement.
Weak life science sales, coupled with a product mix that included low-margin products, reduced gross margins for the period, Kraeutler added."
Even with the decline, the stock is above my sale point for a decline.
As I wrote in my recent review of VIVO,
"On the downside, if a stock declines to 50% of the highest appreciation level, I sell my entire position (after multiple partial sales). In this case, if the stock should decline to a 180% appreciation level or $7.42 x 2.80 = $20.78, then I would plan on selling the entire position."
So I am still well above my sale point, and the stock is trading higher in after-hours trading suggesting the sell-off was way over-done.
But didn't I know the stock was vulnerable to a sell-off like this, especially with its rich valuation? Let me quote also from my write up a few days ago:
"The stock is quite small and is priced to near-perfection and I suppose for that reason could be vulnerable to a correction to more 'reasonable' values should the company fail to meet expectations. However, the latest quarter was strong, the Morningstar report is fabulous with the company even paying a dividend which it has been increasing every year!"
So I kinda thought it might be a bit risky. (emphasis added in quote)
Anyhow, I still own shares and didn't see anything significant enough to shake me out of my positions while I am well above any sale point on the doswnside! Besides, the company repeated guidance and didn't really report any 'bad' results today.
But with the recent earnings disappointment,
MERIDIAN BIOSCIENCE (VIVO) IS RATED A HOLD
Thanks again for visiting! If you have any comments or questions, please feel free to leave them on the blog or email me at bobsadviceforstocks@lycos.com.
Yours in investing,
Bob
Saturday, 12 April 2008
Abercrombie & Fitch (ANF) "Long-Term Review #18"

Hello Friends! Thanks so much for stopping by and visiting my blog, Stock Picks Bob's Advice! As always, please remember that I am an amateur investor, so please remember to consult with your professional investment advisers prior to making any investment decisions based on information on this website.
I write about all of the different things I want to accomplish here on this website and one of the important parts of analyses like these are to find out if they are truly working in the 'real world'. In other words, what's the use of writing something up if I don't take the times to look back and find out how they worked out? And see if the stocks mentioned still belong on this website?
It is hard to believe, but this blog is approaching five years in operation, with the first post placed back on May 12, 2003! This is actually entry #1,797, and I am now up to reviewing entry #18! It looks like I have my work cut out for me :). Please always feel free to let me know what you think about these entries by leaving comments (not spam) on the blog and if you would like you can email me at bobsadviceforstocks@lycos.com with these same comments or questions.
On March 16, 2008, I reviewed entry #17, Krispy Kreme Doughnuts (KKD). I wrote up KKD on May 28, 2003. On the same day, I briefly discussed Abercrombie & Fitch (ANF). Let's take a closer look at that entry and see how Abercrombie is holding up today in the difficult market environment we find ourselves and in the increasingly difficult retail market sector.
May 28, 2003
Abercrombie & Fitch Co. (ANF)
If any of you have teenagers, then you will know about ANF. The stock is having a nice day today and made the largest percentage gainers list. I do not own any shares of this nor does any member of my family.
ANF is currently (12:46 pm CST) trading at $29.07 up $1.33 or 4.79% on the day.
On May 13, ANF reported first quarter earnings ending May 3, 2003, rose 13% to $.26 from $.23 for the comparable period last year.
Looking at Morningstar, we find a 5 year growth from 0.5 billion to 0.8 in 1999, 1.0 in 2000, 1.2 in 2001, 1.4 in 2002 and $1.5 billion for the trailing twelve months. This company is cash-flow positive generating 200 million in the past 12 months...almost double the 107 million reported by Morningstar in 2002.
Another great pick for a beautiful late spring day.
Regards to my friends! Bob
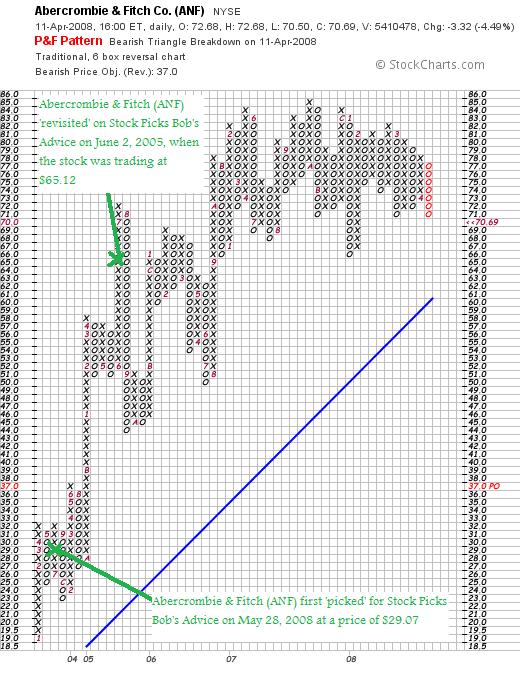
This was only the first time I 'reviewed' Abercrombie; on June 2, 2005 I 'revisited' this stock on this blog when it was trading at $65.12. Abercrombie & Fitch (ANF) closed at $70.69 on April 11, 2008, for a gain of $41.62 or 143.2% since my post in 2003. I do not own any shares nor do I have any options on this stock.
 Let's take a closer look at Abercrombie today and see how it fits into our 'scheme of things'!
What exactly does this company do?
According to the Yahoo "Profile" on Abercrombie & Fitch (ANF), the company
 "...through its subsidiaries, operates as a specialty retailer of casual apparel for men, women, and kids. Its stores offer casual sportswear apparel, including knit and woven shirts, graphic t-shirts, fleece, jeans and woven pants, shorts, sweaters, and outerwear, as well as personal care products and accessories under Abercrombie & Fitch, abercrombie, Hollister, and RUEHL brands."
Is there any recent news on this company?
This past Friday, JPMorgan analyst Brian J. Tunick cut his rating on Abercrombie to "Neutral" from "Overweight" on a decrease in earnings for the year to $5.64/share from his prior outlook of $5.72/share.
ANF has not been immune to the lackluster retail sales environment and on Thursday, April 10, 2008, the company reported a decrease in same store sales of 10%. Total sales for the five week period ended April 5, 2008, actually declined a smaller % to $330.2 million from $331.2 million for the same period in 2007. However, this highlights the importance of same store sales evaluations which indicate how existing stores open both periods perform and removes the element of new store openings contributing sales.
How did they do in the latest quarter?
On February 15, 2008, Abercrombie & Fitch (ANF) reported 4th quarter 2007 results. For the quarter ended February 2, 2008, net sales increased 8% to $1.229 billion from $1.139 billion compared to the same period in 2007. Comparable store sales, however, declined 1% in the 2008 period.
Net income for the quarter increased 9% to $216.8 million compared to $198.2 million the prior year. Diluted income per share increased 12% to $2.40/share from $2.14/diluted share the prior year.
The company managed to beat expectations on earnings which were expected to come in at $2.36/share according to analysts polled by Thomson Financial. However, they missed expectations on revenue which were estimated to come in at $1.25 billion.
What about longer-term results?
The Morningstar.com "5-Yr Restated" financials has yet to reflect the slowing retail environment that is buffeting this stock. In other words the Morningstar.com page looks great!
The company has been steadily increasing sales from $1.7 billion in 2004 to $3.7 billion in 2008, increasing earnings from $2.06/share in 2004 to $5.20/share in 2008, and initiated a dividend of $.50/share in 2005, and increased it to $.70/share in 2008.
Outstanding shares are not only stable with 100 million shares reported in 2004, the company has been buying back shares along with the way with only 92 million shares outstanding in 2008.
Free cash flow is positive and has grown from $197 million in 2006 to $414 million in 2008.
The balance sheet appears solid with $118 million in cash and $1.02 billion in other current assets, easily covering the $543.1 million in current liabilities. The company has an additional $406.2 million in long-term liabilities reported on the Morningstar.com sheet. Calculating the current ratio, we can see that the ratio of 2.1 is quite adequate imho.
What about some valuation numbers?
Reviewing the Yahoo "Key Statistics" on Abercrombie, we can see that this is a large cap stock with a market capitalization of $6.09 billion. The trailing p/e is a reasonable 13.60 with a forward p/e (fye 02-Feb-10) estimated at 10.84. Thus the PEG ratio is quite reasonable at 0.78.
In terms of valuation, the Fidelity.com eresearch website notes that the Price/Sales ratio (TTM) is higher than its peers at 1.64, compared to the industry average of 0.84. However, Fidelity also notes that the company is also more profitable than its peers coming in with a Return on Equity (ROE) (TTM) figure of 32.25% compared to the industry average of 23.22%.
Finishing up with Yahoo, we find that there are 86.18 million shars outstanding with 77.95 million that float. As of 3/11/08, there were 7.37 million shares out short representing 8.70% or a short ratio of 3.2 trading days of volume, a relatively modest figure.
As I noted above, the company does pay a dividend of $.70/share yielding 0.7%. The dividend appears to be relatively secure with a payout ratio of only 13%. The last stock split was a 2:1 stock split paid out June 16, 1999.
What does the chart look like?
Looking at a 'point & figure' chart from StockCharts.com on ANF, we can see that the stock has nicely appreciated since January, 2003, when the stock was trading at $19.00/share until a peak at $85.00/share in October, 2007. The stock has been mostly trading sideways since then but although showing some weakness along with the entire sector, the price chart really hasn't broken down as badly as some stocks.
Summary: What do I think about this stock today?
Well this stock has certainly had a nice ride since I picked it back in the early days of this blog in 2003. Looking today at this stock, there is definitely a 'mixed picture' on results. The latest quarter showed a declining same store sales although revenue and earnings climbed. This same store sales dip has accelerated into the first quarter with a (10)% decline in same store sales.
However, the longer-term picture appears intact, the company is reasonably valued with a p/e in the low teens and a PEG under 1.0. Their balance sheet is solid and they pay a secure dividend.
But I cannot ignore the overall retail environment. I have to ask myself whether I would continue to hold this stock in light of the deteriorating figures. Not knowing the extent of this economic slow down and very reluctant to predict, I have to conclude that
ABERCROMBIE & FITCH (ANF) IS RATED A SELL
That one really hurt. I like the performance of this pick and believe that after this economic downturn, the stock is likely to pick up once again. Watch for monthly sales figures, and when the stock starts doing better than expected it will be time to change our bias.
Thanks so much for stopping by and visiting my blog! If you have any comments or questions, please feel free to leave them on the blog or email me at bobsadivceforstocks@lycos.com.
If you get a chance, be sure and visit my Covestor Page to view my actual trading portfolio, my SocialPicks Page where my stock picks from the past year-and-a-half are being monitored, and my Podcast Page where you can download some mp3's of me discussing some of the same stocks I write about here on the blog.
Wishing you all a healthy and profitable week!
Yours in investing,
Bob
Posted by bobsadviceforstocks at 11:26 PM CDT
|
Post Comment |
Permalink
Updated: Sunday, 13 April 2008 8:51 AM CDT
Meridian Bioscience (VIVO) "Weekend Trading Portfolio Analysis"

Hello Friends! Thanks so much for stopping by and visiting my blog, Stock Picks Bob's Advice! As always, please remember that I am an amateur investor, so please remember to consult with your professional investment advisers prior to making any investment decisions based on information on this website.
It is a pleasure to be blogging about this stock this evening. Meridian Bioscience (VIVO) has been probably my best investment in my portfolio for some time.
As part of my blogging activity on this website, I have been trying to accomplish several things simultaneously. I hope that you all have been able to follow along with me as I address these issues. First of all, I have been discussing methods of selecting stocks and then writing up examples of these issues. Next I have been discussing portfolio management and exploring ways to deal with all kinds of market environment. Finally, I have been sharing with all of my readers my actual trading portfolio and letting you know when I trade---including my mistakes and impulse trades that I am trying to avoid--and updating you on the status of my holdings.
This has been made easier by Covestor and you can visit my Covestor Page if you would like to review my holdings and their performance at least as of the date I joined Covestor on June 12, 2007. Even before I joined Covestor, I have been trying to review my holdings on a regular basis and determine their current suitability for me.
When I had 20 positions and the market was acting better, I tried to review my holdings about every two weeks. Now that I am down to just 6 positions (on April 6, 2008, I reviewed my current trading portfolio), I am trying to spread out these reviews so they don't become redundant.
On March 1, 2008, I reviewed ResMed (RMD), one of my current holdings in my portfolio. Going alphabetically through my portfolio (by stock symbol), I am now up to Meridian Bioscience (VIVO).
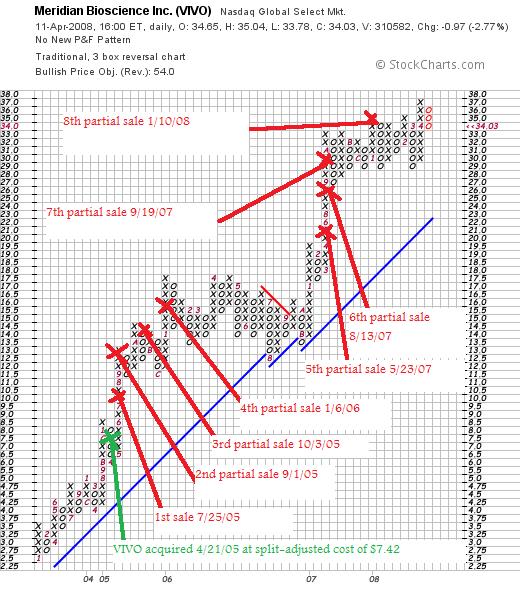
I currently own 171 shares of Meridian (VIVO) which closed at $34.03 on April 11, 2008. These shares were acquired April 21, 2005, at a cost basis per share of $7.42. Thus, I have a gain of $26.61/share or 358.6% since purchase.
As is my practice, I have been selling portions of my position as the stock has appreciated. In fact I have sold portions of Meridian 8 times since that purchase in 2005, at 30, 60, 90, 120, 180, 240, 300, and 360% appreciation levels. Initially, I had been selling 1/4 of remaining positions, reduced it to 1/6th sales, and lately have been selling 1/7th of my holdings as they hit appreciation targets. I have discussed this in the blog elsewhere but basically my initial selling was too aggressive and resulted in an ever-diminishing size of my remaining positions.
When would I sell shares next?
Except for arbitrary sales on the basis of some event or news that is fundamentally 'bad', I have been selling at targeted levels both on the upside and the downside. In Meridian's case, with my last sale at a 360% appreciation level (!), my next sale is at the 450% appreciation level which would work out to $7.42 x 5.50 = $40.81. At that point, I would plan on selling 1/7 x 171 shares = 24 shares.
On the downside, if a stock declines to 50% of the highest appreciation level, I sell my entire position (after multiple partial sales). In this case, if the stock should decline to a 180% appreciation level or $7.42 x 2.80 = $20.78, then I would plan on selling the entire position.
What exactly does this company do?
According to the Yahoo "Profile" on VIVO, the company
 "...a life science company, engages in the development, manufacture, sale, and distribution of diagnostic test kits primarily for respiratory, gastrointestinal, viral, and parasitic infectious diseases. The immunodiagnostic technologies used in its diagnostic test kits include enzyme immunoassay, immunofluorescence, particle agglutination/aggregation, immunodiffusion, complement fixation, and chemical stains used by reference laboratories, hospitals, and physicians' offices. The company also manufactures and distributes bulk antigens, antibodies, and reagents used by researchers and other diagnostic manufacturers."
How did they do in the latest quarter?
On January 22, 2008, Meridian (VIVO) reported 1st quarter 2008 results. For the quarter ended December 31, 2007, sales increased 18% to $33.8 million from $28.7 million the prior year. Net earnings increased 34% to $7.5 million from $5.6 million the prior year, representing a 29% increase on a per share basis of $.18/share in 2008 vs. $.14/share in the prior year same period.
How about longer-term results?
Reviewing the Morningstar.com "5-Yr Restated" financials on Meridian, we can see the beautiful picture of steady revenue growth from $65.9 million in 2003 to $123 million in 2007 and $128.1 million in the trailing twelve months (TTM).
Earnings during this period have also steadily improved from $.21/share in 2003 to $.66/share in 2007 and $.70/share in the TTM.
The company also pays a dividend (!) and has been steadily increasing that payment from $.15/share in 2003 to $.40/share in 2007 and $.43/share in the TTM.
Outstanding shares have increased under 25% from 34 million in 2003 to 41 million in the TTM. During this time, revenue has grown almost 100%, and earnings are up more than 200%. This is an exceptable dilution in light of these fabulous results.
Free cash flow is positive and growing from $16 million in 205 to $23 million in 2007 and $27 million in the TTM.
The balance sheet is gorgeous with $49.0 million in cash, which by itself could pay off both the $15.6 million in current liabilities and the $2.6 million in long-term liabilities combined, more than 2x over! Calculating the current ratio, we find that Meridian has a total of $97 million in current assets, which compared to the $15.6 million in current liabilities yields a current ratio of 6.22.
How about some valuation numbers?
Checking the Yahoo "Key Statistics" on Meridian, we find that the current market cap of $1.36 billion still gives VIVO the small cap label. The trailing p/e is a bit rich at 48.68, with a forward p/e a bit better (but still rich) at 38.24 (fye 30-Sep-09). The PEG also is a bit rich at 1.70 (I like to see PEG's between 1.0 and 1.5 imho).
Using the Fidelity.com eresearch website, we see that by the Price/Sales (TTM) measure, VIVO is richly priced at 10.58, compared to the industry average of 4.90. Even at this price, the Return on Equity (TTM) is ahead of the pack with a 25.91% value compared to the industry average of 20.72% according to Fidelity.
Returning to Yahoo, there are 40.08 million shares outstanding with 38.37 million that float. As of 3/11/08, there were 3.06 million shares out short representing a short ratio of 6.9 trading days (a bit ahead of my own 3 day rule for significance). This is 7.9% of the float.
The company, as noted, does pay a dividend and has a yield of 1.6%. The company is paying 62% of its earnings in dividend (the payout ratio). The last stock split was a 3:2 split back on May 14, 2007.
What does the chart look like?
Reviewing the 'point and figure' chart on Meridian from StockCharts.com, we find one of the remaining 'beautiful charts'. The company has increased its stock price from $2.50 back in January, 2003, to a recent high of $37 recorded this month in April, 2008. This stock chart hasn't really 'heard the news' of the dismal stock market!
Summary: What do I think?
Except for the relatively rich valuation (this stock is NOT undiscovered), the overall picture of Meridian (VIVO) is terrific! Thus,
MERIDIAN BIOSCIENCE (VIVO) IS RATED A BUY
The stock is quite small and is priced to near-perfection and I suppose for that reason could be vulnerable to a correction to more 'reasonable' values should the company fail to meet expectations. However, the latest quarter was strong, the Morningstar report is fabulous with the company even paying a dividend which it has been increasing every year!
Valuation as noted is a bit rich but even with that, the profitability as measured by 'return on equity' is ahead of its peers.
Finally the chart is gorgeous without much evidence of any weakness.
I know I own the shares, so please take that into consideration, but even so, isn't this a beautiful stock?
Thanks again for visiting! If you have any comments or questions, please feel free to leave them on the blog or email me at bobsadviceforstocks@lycos.com. If you get a chance, be sure and visit my Covestor Page where you can examine all of my holdings in my Trading Account, my SocialPicks page where you can check out my stock picks from the last year or so, and my Podcast Page where you can download an mp3 or two of me discussing some of the many stocks mentioned on the blog!
Have a great Sunday everyone!
Yours in investing,
Bob
"Looking Back One Year" A review of stock picks from the week of September 25, 2006
Hello Friends! Thanks so much for stopping by and visiting my blog, Stock Picks Bob's Advice! As always, please remember that I am an amateur investor, so please remember to consult with your professional investment advisers prior to making any investment decisions based on information on this website.
It is the weekend once again! (Do these weeks seem to fly by for anyone else as well?). Anyhow, I like to review past stock picks on weekends and update my ratings evaluations. So many things have changed this past year. And not all for the better!
Last weekend I took a look at the stocks discussed on this blog during the week of September 18, 2006. Going a week ahead, let's review the stocks 'picked' on this blog during the week of September 25, 2006. I know that it is a bit more than a year....more like a year-and-a-half....but when I started these reviews, it was a year....and then I missed a review one weekend....and then one thing led to another, and now my review is more than a year out. Anyhow.....let's get on with this review :).
These reviews assume a buy and hold approach to investing. In practice, I advocate and employ a disciplined investment strategy that requires quick and total sales on declines and partial sales as stocks reach appreciation targets on the upside. Without a doubt the difference in employing these two strategies to the same group of stocks would certainly affect performance and you should keep this in mind.
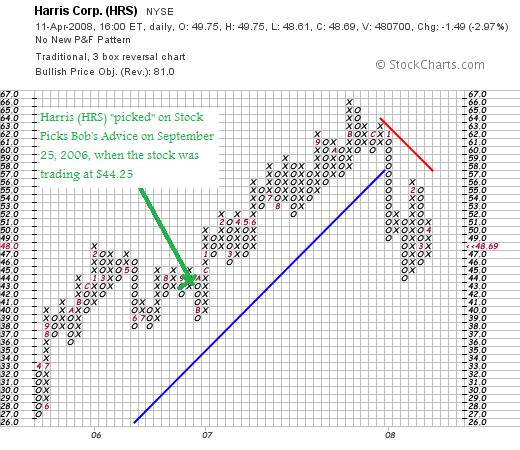
 On September 25, 2006, I posted Harris Corporation (HRS) on Stock Picks Bob's Advice when the stock was trading at $44.25. Harris closed at $48.69 on April 11, 2008, for a gain of $4.44 or 10% since posting. I do not own any shares or options on Harris.
On January 30, 2008, Harris (HRS) announced 2nd quarter 2008 results. Revenue for the quarter came in at $1.3 billion, up 30% from the $1.0 billion reported in the same quarter the prior year. This also represented a 7% sequential increase in revenue.
Net income for the quarter came in at $114 million or $.83/diluted share vs. $94 million or $.67/diluted share the prior year.
In the same announcement the company raised guidance for fiscal year 2008 to $5.2 to $5.3 billion with GAAP earnings guidance to $3.35 to $3.45/diluted share.
The company beat expectations on both earnings where $.81/share was expected and revenue where $1.25 billion was expected according to analysts polled by Thomson Financial.
Reviewing the Morningstar.com "5-Yr Restated" financials on Harris, we can see that the latest numbers show persistent revenue growth, steady earnings growth, steady dividend growth, stable outstanding shares, and continued solid free cash flow. The balance sheet appears solid.
Looking at the 'point & figure' chart on Harris from StockCharts.com, we can see that the stock was moving strongly higher from April, 2005, when the stock was trading as low as $27, until August, 2007, when it hit a high at $66/share. The stock broke through support in January, 2008, and although moving higher, it hasn't convincingly re-established the upward price move.
Thus, even with all of the good data presented, the best I can do...
HARRIS CORPORATION (HRS) IS RATED A HOLD

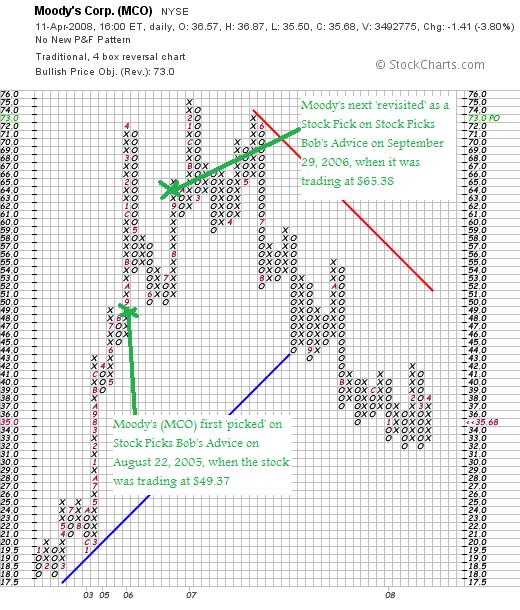
On September 29, 2006, I "revisited" Moody's (MCO) on Stock Picks Bob's Advice when the stock was trading at $65.38. I write 'revisit' because I first wrote up Moody's on this blog on August 22, 2005 when the stock was trading at $49.37. Moody's has not been immune from the near-meltdown of financial stocks we have observed and closed at $35.68 on April 11, 2008, for a loss of $(29.70) or (45.4)%. I do not have any shares or options on Moody's.
In terms of recent events, Moody's on March 11, 2008, cut the 2008 outlook due to 'shrinking bond issuance' with revenue now expected to shring in the 'mid-to-high-teens' from $2.3 billion in revenue last year. This was a revised estimate that was already predicting a decline in revenue in the 'low double-digits'.
On February 7, 2008, Moody's (MCO) announced 4th quarter 2007 results. Revenue for the three months ended December 31, 2007, declined 14% to $504.9 million from $590.0 million during the same period in 2006. Net income plunged to $127.3 millin from $278.6 million last year or $.49/diluted shear nearly 50% off the $.97/diluted share reported the prior year.
The Morningstar.com '5-Yr Restated' financials on Moody's (MCO) appears intact with sales growth steady, earnings growth stable (except for a flat 2007 at $2.58/share the same as 2006), dividends steadily increasing, and free cash flow positive and growing. The balance sheet, however, gives me pause with $426 million in cash and $563 million in other current assets. This total of $989 million, when compared to the $1,349.2 million in current liabilities yields a current ratio of .73.
At a minimum, a healthy current ratio is considered to be over 1.0. Moody's doesn't quite meet this level.
Reviewing the 'point & figure' chart on Moody's from StockCharts.com, we can see that the stock climbed sharply from January, 2002, when it was trading as low as $18 to a high of $75 in February, 2007, only to fail to reach that height in May, 2007, and then decline sharply from there, slipping below 'support' in August, 2007, as the stock dipped below $44. While seeming to be developing a new support in the $33 level, this is far from confirmed and convincing.
With the second lowering of guidance, the weak balance sheet on Morningstar.com and the very disconcerting chart on StockCharts.com, along with the entire credit meltdown that is ongoing,
MOODY'S (MCO) IS RATED A SELL
So how did I do with these two stock picks from the week of September 25, 2006? Well, except that I had the poor luck of including a financial company, it wouldn't have been that bad. O.K. no excuses, the two stocks combined for an average performance of a loss of (17.7)% since posting!
Thanks so much again for stopping by and visiting! If you have any comments or questions, please feel free to leave them on the blog or email me at bobsadviceforstocks@lycos.com.
If you get a chance, be sure and visit my Covestor Page where you can monitor and see an evaluation of my actual trading portfolio (email me if you would like an 'invite' to open a free account on Covestor....I have 4 invitations available :)), my SocialPicks Page where all of my stock picks from the last year or so have been reviewed, and my Podcast Page where you can listen to me discuss some of the many stocks and issues discussed on this website.
Have a wonderful weekend everyone!
Yours in investing,
Bob
Friday, 11 April 2008
How I Deal With Market Corrections!
I really thought about writing up another stock this evening.
Regular readers know that I like to write about stocks that I think deserve consideration based upon their price movement and underlying fundamentals.
But more important to me right now is dealing with the difficult trading environment and responding to market conditions within my own portfolio.
Many of you will have noted that I haven't been posting many "trading transparency" entries. Because I haven't been trading. My remaining six stocks haven't hit any sale points either on the upside or the downside. And without a signal to do anything, I haven't.
When markets correct and stocks decline there are multiple courses of action that are motivated by fear and greed. We believe we should justify our past decisions by buying more of the same stocks that have now declined on us and are thus 'better values'. At the same time, we may act in terror at a market decline and simply 'throw in the towel' and sell all of our positions swearing never to buy another stock again!
It is obvious to me that it is difficult to know exactly what to do in these trading environments. Is the market about to drop 200 points, or is it ready to climb 300 instead? Sentiment changes by the moment.

I have talked about the "Zen of Investing" elsewhere. Many people have also written about this "Zen" concept from Motley Fool to Zenway.com where they pledge to "hear the 'grasshopper' even in the midst of Wall Street thunders and storms.
James K. Glassman has also written about "Zen investing: smart and calm" For Glassman this means
"In the end, the best qualities for investors are the same ones Aristotle admired: moderation, common sense, restraint, modesty and integrity. Maybe, instead of five days of investor education, we should all sit down and read five days' worth of the ancient Greeks."
But somehow that doesn't get at what "Zen" is all about.
Barry Ritholtz probably gets it best when he writes and quotes Buddha:
"Do not believe in anything simply because you have heard it . . . Do not believe in traditions because they have been handed down for many generations. But after observation and analysis, when you find that anything agrees with reason and is conducive to the good and benefit of one and all, then accept it and live up to it.-Buddha"
Jon Kabat-Zinn has described the role of 'mindfulness' in becoming more aware of our worlds, whether they be investment worlds, or worlds full of people and family. He writes:
"Mindfulness is the other major classification of meditation practices, known as vipassana, or insight meditation. In the practice of mindfulness, you begin by utilizing one-pointed attention to cultivate calmness and stability, but then you move beyond that by introducing a wider scope to the observing, as well as an element of inquiry. When thoughts or feelings come up in your mind, you don't ignore them or suppress them, nor do you analyze or judge their content. Rather, you simply note any thoughts as they occur as best you can and observe them intentionally but nonjudgmentally, moment by moment, as the events in the field of your awareness."
For me, I have chosen to combine this "Zen" calmness, with the Robert Lichello automatic investing ideas, and the O'Neil CANSLIM observations on the "M" of the Market. In other words, I have chosen to listen to my own portfolio and observe the actions of the market and to respond to them without judgment and analysis but with understanding and appreciation.
Within my own portfolio, when stocks hit sale points that I have previously set to limit losses, this represents not only a sale of a poorly-performing holding but a 'message' to me that demands my attention. For all of us, stocks that end up being sold for poor performance or are behaving poorly without being sold are 'talking to us', telling us something about the state of the markets in general.
It is this observation, this mindfulness about my own portfolio, that has led me to set up my system of moving between 5 and 20 positions, setting my portfolio size in response to the actions of my own holdings rather than in anticipation of any market move which may or may not occur.
This system has worked well for me. I am currently at 6 positions, and shall wait for either a message of encouragement resulting from a sale at an appreciation target, and thus add a new position, or a message of discouragement, with a sale on a decline letting me know that things aren't well at all and instead I should be 'sitting on my hands.'
I don't know if this 'strategy' will work over the long haul. I am but an amateur investor after all. I do know that it seems to working now and I have been listening.
Maybe we all need to be listening more to our own holdings, the stock market, and the news that is occurring all around us. Instead of perhaps listening to the wide array of 'talking heads' that direct us to act on passions instead of mindfulness.
Yours in investing,
Bob
Newer | Latest | Older


