Stock Picks Bob's Advice
Thursday, 21 May 2009
PetSmart (PETM) "Trading Transparency"
Hello Friends! Thanks so much for stopping by and visiting my blog, Stock Picks Bob's Advice! As always, please remember that I am an amateur investor, so please remember to consult with your professional investment advisers prior to making any investment decisions based on information on this website.
 PetSmart (PETM) is currently one of my six holdings in my 'trading portfolio'. Up till today I owned 90 shares of PetSmart that I purchased back on November 20, 2008, at a cost basis of $15.50. PETM closed at $20.35 today, down $(1.95) or (8.74)% so I still have a significant gain on this particular purchase.
Yesterday (5/20/09) after the close of trading PetSmart (PETM) announced 1st quarter 2009 results. For the quarter ended May 3, 2009, the company earned $46.3 million or $.37/share on revenue of $1.33 billion, up from $41.2 million or $.32/share last year. According to this report, Thomson Reuters analysts had been expecting a profit of $.30/share on revenue of $1.35 billion.
Thus the company actually exceeded earnings estimates but did in fact miss revenue expectations by a small amount. Same-store sales did increase 3.9% during the quarter.
PetSmart also went ahead and estimated profit of $.26 to $.30/share for the next quarter and raised full-year profit estimates to $1.42 to $1.52/share from prior guidance of $1.40 to $1.50/share. The company guided expectations on revenue growth to the 'mid- to high-single digit sales'. They also suggested that same-store sales growth is likely to continue albeit in the low-single digits.
Thus the company announced positive earnings growth both absolutely as well as positive same-store sales growth, beat expectations on earnings, came in a little bit light on revenue and then raised guidance for the year on earnings. Really not too shabby a result from my amateur perspective.
And yet for this the stock was punished severely.
To be fair, an amateur is no match for a Goldman Sachs analyst who downgraded the retailer "despite its better-than-expected earnings in the first quarter."
As this article reported:
"Goldman analyst Matthew Fassler said the Phoenix-based company has "executed well," with strong sales and earnings compared to the rest of the retail sector and well-controlled costs. Its stock has outperformed the broader S&P 500 index in the past year, falling 3 percent instead of the 36 percent decline in the benchmark.
However, the company has little to drive its shares higher, given that recent same-store sales increases have been driven by food inflation and promotions, which don't add to profit margins. As inflation drops and foot traffic trends slowed in spring, he said, there's not much room for more growth in same-store sales."
The reaction seemed a bit severe.
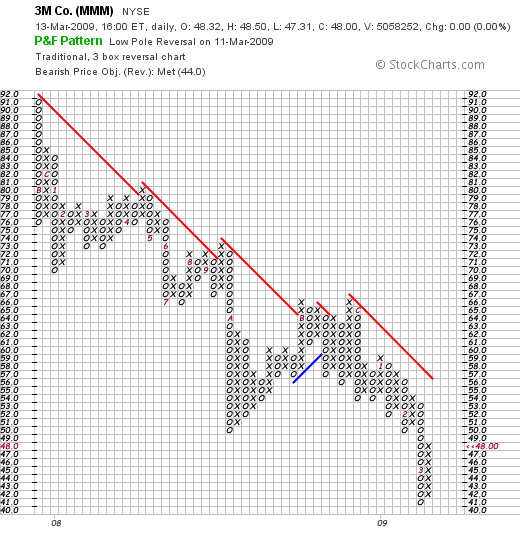
If we review the 'point & figure' chart for PetSmart from StockCharts.com:
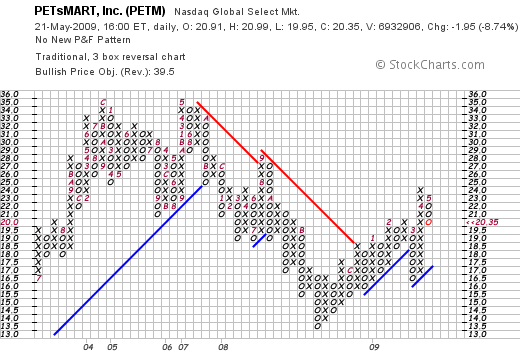
We can certainly see that the stock has been fairly strong since November, 2008, when it bottomed at $13.50 and has been moving higher through resistance at $18.00. But the upward trend appears intact for now.
Simply looking at the Yahoo "Key Statistics" on PetSmart (PETM), we can see that the trailing p/e is a reasonable 13.39 imho, with a forward p/e of 12.72. The PEG is far from overpriced at 1.24.
To make a long story short, the move appeared overdone as investors were likely selling on the good news, a move that was accentuated by the GS analyst who couldn't find anything good about the earnings report which in an unusual fashion reported actual earnings that exceeded expectations and had the management actually raising guidance.
As I recently did with my Haemonetics (HAE) stock, I chose to buy when others were selling. Instead of joining the selling panic, I purchased 180 shares of PETM at $20.3676, close to its close for the day. This is outside of my usual trading pattern and whether or not this 'works' I expect that this now 'over-sized' position will be reduced to essentially the original holding size for the long-haul.
Thanks again for stopping by! If you have any comments or questions, please feel free to leave them on the blog or email me at bobsadviceforstocks@lycos.com.
Yours in investing,
Bob
Thursday, 14 May 2009
McDonald's (MCD) and a Birthday Greeting!
Hello Friends! Thanks so much for stopping by and visiting my blog, Stock Picks Bob's Advice! As always, please remember that I am an amateur investor, so please remember to consult with your investment advisers prior to making any investment decisions based on information on this website.
 I wanted to share with all of you an interesting cake to celebrate the birthday of this blog that quietly slipped by two days ago. This blog turned six years old and just like the average six-year-old, I feel like I am ready for first grade in investing! But fortunately, school starts in September, so we all have the Summer to keep us entertained.
Six years ago I wrote my first entry here and decided to comment a little about St. Jude (STJ). This is what I wrote:
May 12, 2003 St Jude Medical
This is one I picked up today. STJ is the stock symbol. I do not as I write and publish this own any shares. Am thinking about suggesting this to my stock club. Company had a great day today with a nice move on the upside. Last Quarter was good and the past five years have been steady growth. Closed at $55.30 up $2.92. So the daily momentum helped it make the list.
I still don't own any shares of St. Jude. It is still an interesting stock that deserves a mention on this blog. Meanwhile, Happy Birthday to Me! Lately, my entries are a bit longer, and the intervals between them have grown. I very much enjoy the opportunity to be a blogger, the chance at sharing with all of you a few thoughts on investing and how an amateur like me might choose to face the vagaries of the investment world. Thank you all for your visits, your letters and comments and your encouragement. I do not know what the future holds for me and investment blogging. But I can tell you this: the past six years have been exciting for me as an amateur investor and writer. I hope the next six are just as exciting, and perhaps, just a little more profitable!
 Much has been written about McDonald's (MCD) being a recession-resistant stock. You can read about it here, here, here, here, and here for example.
There is some truth to the thesis. After all, people still need to eat, so doesn't it make sense to be eating at an affordable place like McDonald's when times are tough. In the same manner, Wal-Mart (WMT) has proven to be recession-resistant. People still need to 'buy things' but instead of shopping at the more expensive retail firms, or eating out at more expensive restaurants, the McDonald's and the Wal-Marts are likely increasing their market share in these recession-ridden times.
With that in mind, I wanted to briefly look at McDonald's and see if it truly was an investment, that I personally believed, was worth considering even in today's turbulent stock market.
First of all, what about the latest quarterly result? On April 22, 2009, McDonald's (MCD) reported 1st quarter 2009 results. Revenue did dip to $5.08 billion from $5.61 billion the prior year. Net income came in at $979.5 million, or $.87/share, ahead of analysts expectations of $.82/share. However, revenue failed to meet expectations of $5.23 billion.However, same-store sales worldwide grew 4.3%. It is difficult to know how same store sales can rise and overall sales can dip, unless factors such as currency exchange rates are affecting the total.
Latest numbers for the United States continue to be strong as April, 2009, 'same-store sales' grew 6.9% as reported. The article does relate that McDonald's same-store sales grew even faster in Europe at 8.4% and came in at a 6.5% increase in Asia/Pacific. However, China apparently is underperforming this rate as things continue to slow there in the face of a growing economic correction.
Longer-term, reviewing the Morningstar.com '5-Yr Restated' financials on MCD, we can see that revenue has been steadily growing from $19.1 billion in 2004 to $23.5 billion in 2008. In the trailing twelve months, McDonald's has experienced a slight dip in revenue to $23.0 billion. Earnings, except for a dip from 2007 to 2008, have grown steadily from $1.79/share in 2004 to $2.83/share in 2007--dipping to $1.98/share in 2008--and rebounding to $3.76 in 2008 and $3.83/share in the TTM.
In addition, the companyt pays a dividend which they have rapidly and consistently increased from $.55/share in 2004 to $1.63/share in 2008 and $1.75/share in the TTM. In terms of outstanding shares, the company had 1.27 billion shares outstanding in 2004, and has been gradually decreasing this amount to 1.146 billion in 2008 and 1.136 billion in the TTM.
Free cash flow remains solidly positive although this has slowed slightly in the TTM. MCD reported $2.6 billion in free cash flow in 2006, $2.93 billion in 2007, $3.78 billion in 2008 and $3.43 billion in the TTM.
Insofar as the balance sheet is concerned, Morningstar reports this company with $1.98 billion in cash and $1.47 billion in other current assets. This total of $3.45 billion easily covers the $2.21 billion in current liabilities reported. In terms of the current ratio, this yields a ratio of 1.56. McDonald's also has a significant $12.9 billion in long-term liabilities on its books, but with the ample cash and current assets, the positive free cash flow, and its record of growing its revenue and earnings, this doesn't seem to be a significant burden for them.
In terms of valuation, looking at the Yahoo 'Key Statistics' on MCD, we can see that this is a large cap stock with a market capitalization of $59.3 billion. The trailing p/e is a very reasonable 13.98 with a forward p/e of 12.86. The PEG ratio (5 yr expected) suggests that even with this relatively low p/e, the company is a bit richly priced with a PEG of 1.56.
Using the Fidelity.com eresearch website for some additional valuation numbers, we find that the Price/Sales ratio (TTM) works out to 2.60 compared to the industry average of 1.70. The company is also slightly less profitable than its peers when viewed from the perspective of Return on Equity (TTM) with MCD coming in at 32.35% vs. the industry average of 47.67. However, their return on assets, and their return on investment handily outpace their peers.
Finishing up with the Yahoo information, there are 1.11 billion shares outstanding with 1.09 billion that float! As of 4/27/09 there were 13.43 million shares out short representing a short interest ratio of 1.4 days or 1.2% of the float---hardly the numbers I would look for that might cause a 'squeeze'.
Finally, with the $2.00 forward dividend rate, the company pays a significant dividend yielding 3.7%. There appears to be good coverage for this dividend with a payout ratio of 46%. The last stock split was a 2:1 split just about ten years ago on March 8, 1999.
What does the chart look like?
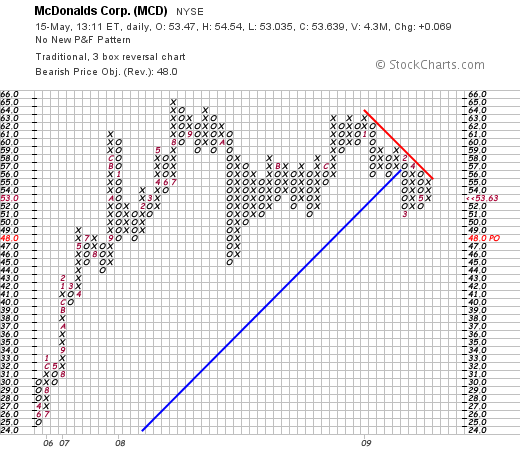
Reviewing the 'point & figure' chart on McDonald's (MCD), we can see that the company experienced a sharp rise in its stock price between May, 2005 and August, 2008, when the stock rose from $25 to $65. The stock dipped briefly to the $45 level in October, 2008, but since then has foght back but has struggled a bit since hitting the $63 level three times in December 2008 and January, 2009. I would have to say I am less than enthusiastic about the technical appearance of this chart--at least from my amateur perspective.
In conclusion, McDonald's (MCD) is indeed a recession-resistant company. They are continuing to show positive same-store growth and appear to be taking a bigger market share from its competitors. Unfortunately, the strong dollar is depressing their financial results--due to exchange rates when results are reported in dollars--and they are feeling the pressure from their multinational business as many such corporations are experiencing today.
Due to what appears to be brilliant management, this gigantic restaurant chain is reinventing itself, adding salads, healthier items and a coffee bar to many of its newly named 'Cafes'.
This company has been a steady grower from well before 2004 and continues to produce solid results. However, valuation is a tad rich in terms of p/e relative to growth, Price/Sales ratios are also a bit rich relative to other companies in the same industry, and the chart appears a bit 'tired'. Clearly, I am not the first amateur to think about buying McDonald's stock! But regardless of all of that, I do like this company, like their ability to innovate and produce a consistent product, and like their steady revenue growth, earnings growth, dividend growth, decline in outstanding shares, and solid balance sheet.
You should do worse in a market like we have today!
By the way, McDonald's is currently trading at $53.50, down $.069 or (.13)% on the day. I do not own any shares of McDonald's (MCD) currently but some of my immediate family members do own small lots of shares in their own accounts.
Thanks again for visiting! And thanks for 6 years of your interest and encouragement that has allowed me to continue to find the time and energy to blog! Go ahead and have a slice of birthday cake---but I wouldn't eat it. Mostly flowers.
If you have any comments or questions, please feel free to leave them on the blog or email me at bobsadviceforstocks@lycos.com.
Yours in investing,
Bob
Posted by bobsadviceforstocks at 9:32 PM CDT
|
Post Comment |
Permalink
Updated: Friday, 15 May 2009 12:41 PM CDT
Friday, 8 May 2009
Haemonetics (HAE) "Trading Transparency"
Hello Friends! Thanks so much for stopping by and visiting my blog, Stock Picks Bob's Advice! As always, please remember that I am an amateur investor, so please remember to consult with your professional investment advisers prior to making any investment decisions based on information on this website.
I recently shared with you my decision to make a purchase of 150 shares of Haemonetics (HAE) as a "trade". This was in addition to my holding of 50 shares of the stock as more of an "investment". This is outside of my regular strategy of timing stock purchases and sales based on internal signals from my own account, and the sizing of such positions again based on the other position size. In fact, with the purchase of these shares, my Haemonetics (HAE) holding represented approximately 50% of my entire portfolio!
The stock fortunately moved as I had hoped it would, undoing the apparently irrational price plunge in the midst of a fairly good earnings report. Wanting to stay within my own trading strategy, I undid that purchase and sold my 150 shares a few moments ago at $51.5252 (5/8/09). Thus, having purchased these shares on 5/4/09 at a cost basis of $48.5968, this represented a gain of $2.93 or 6.02% on this particular purchase. While seeming like a small move to make such a sale and purchase, I again acted with my brain and not my gut to close out this 'trade' that wasn't consistent with my underlying core trading strategy.
I shall continue to reserve the right to make such trades within my account even as I try to methodically manage my holdings.
Thank you for taking the time to visit my blog! If you have any comments or questions, please leave them right here or email me at bobsadviceforstocks@lycos.com.
Yours in investing,
Bob
Monday, 4 May 2009
Haemonetics (HAE) "Trading Transparency"
Hello Friends! Thanks so much for stopping by and visiting my blog, Stock Picks Bob's Advice! As always, please remember that I am an amateur investor, so please remember to consult with your professional investment advisers prior to making any investment decisions based on information on this website.
Today Haemonetics (HAE), one of the six holdings in my trading account, announced 4th quarter results. Revenue for the quarter rose 10% to $152.4 million. Excluding items the company earned $.65/share. Analysts had been expecting $.63/share so the company beat expectations on earnings. Analysts had been expecting $151.1 million according to Reuters estimates; thus the company beat on revenue as well. The company went ahead and guided pretty much to expectations.
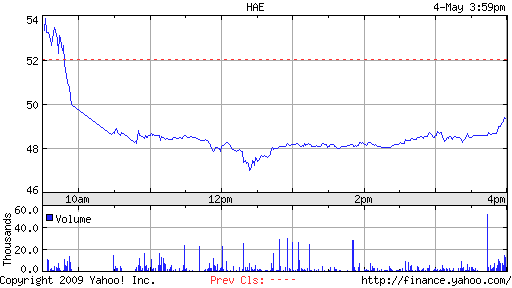
In spite of this the stock plummeted. Looking at the chart for the action today, we can see how the stock price hit its low today around 12:25 pm when the price high $47/share. After that point, the price gradually closed into the close of the day.
Like so many amateur investors, I really wasn't sure what I should be doing with this stock! My gut was full of panic and directed me to sell quickly! Yet my brain screamed out that this was irrational. That the continued dip on good news was nuts and that I needed instead to buy.
I chose to use my brain and while holding my nose, picked up 150 shares of Haemonetics (HAE) at $48.60/share. This wasn't really my 'system' at work, but there are times when stock actions defy logic and I hoped this was one of them.
Fortunately, HAE gathered strength into the close and ended up at $49.37, down $(2.67) or (5.13)% on the day.
Where does HAE go from here? I don't really know. But the news released was solid and I chose to add to my small position of HAE making it now my largest holding in my portfolio.
Yours in investing,
Bob
Sunday, 26 April 2009
Building a Portfolio: "Intelligent Design" or "Natural Selection"?
Hello Friends! Thanks so much for stopping by and visiting my blog, Stock Picks Bob's Advice! As always, please remember that I am an amateur investor, so please remember to consult with your professional investment advisers prior to making any investment decisions based on information on this website.
 This afternoon I received a twitter from my son Ben, who asked me about what I thought about the recent article by Jeffrey Goldberg in the Atlantic, "Why I Fired My Broker". Goldberg laments the failure of his Merrill Lynch broker who seemingly was unable to anticipate the market implosion and he cynically visits with investment gurus from George Soros to a survivalist who tells him to buy 'things' and not have any debt.
Mr. Goldberg suffered along with most Americans who had believed that investing for the long-term was the only way to go. One simply had to have the appropriate balance of funds in one's 401k or IRA and then dollar-average over time. It didn't work out well for Goldberg and even in my own retirement accounts that I have actually been doing more or less the same thing it hasn't been working out well. It turns out this time there has been 'no place to hide' and diversification and dollar-cost-averaging hasn't protected anyone very well.
As a biology major in college, and as an observer on the current political scene, I have been quite aware of the struggle regarding the teaching of the origin of humans on this planet. The controversy is divided between those who believe a divine origin is key; they go by the name of Creationists or lately it has been popular to refer to them as "Intelligent Design" advocates.
As the Intelligent Design website explains:
"The theory of intelligent design (ID) holds that certain features of the universe and of living things are best explained by an intelligent cause rather than an undirected process such as natural selection."
 In opposition to this theory are those who believe in the principles best enunciated by Charles Darwin of the natural selection process or simply stated 'survival of the fittest'. These are the Evolutionists who pit their views against the 'central planning' approach of the Creationists.
As this website explains:
"His explanation that evolution occurs as a result of natural selection implied that chance plays a major role. He understood that it is a matter of luck whether any individuals in a population have variations that will allow them to survive and reproduce."
You might now be asking, 'What does all of this have to do with investing?'
Everything. Intelligent Design in portfolio construction assumes a higher intelligence in building an appropriate mix of investments that can be followed long-term except for an occasional 'rebalancing.' This approach assumes that it is impossible to time the market because one cannot know when to get in and out of equities. In addition, it is also impossible to know what to put your money in and if per chance one of your holdings does somehow outperform the other, well you better go ahead and pull some cash off of that and allocate it to the under-performing investment.
It has been my attempt to manage my portfolio by observing the actions of the individual holdings in my account (which of course I use my own intelligence in adding them to the mix) and letting them determine their own future of either dominance or extinction as they respond to the changing financial environment they face! This is the 'natural selection' approach to my investing. Stocks that do well stay and are least penalized. Those that do poorly are selected against and eliminated.
 Perhaps I can suggest two popular board games that might provide another perspective on this. Consider the two games of Battleship and Chess. I have played both and have enjoyed the challenge.
However, in Battleship, the idea is to set up your ships in a static fashion and then to weather the onslaught from your opposing player in as good a fashion as possible. You set up your ships and you sit there. So with allocation in portfolios. You set up your mix of investments, you dollar cost average, and then you sit there come what may. And a great big old bear market may arrive and eat you up!
 However in Chess, you also set up your positions in a rather standard fashion. After that most bets are off. Your strategy changes as your environment changes being the positioning of your opponent.
O.K. so it isn't an exact comparison! But I am sure you get the idea.
I do know that if I am to 'time the market' I cannot rely on my own psyche at that time. I feel the worst when the market is at the lowest and I share the problem of being the most euphoric as the market tops. So how is an investor to respond?
Instead of portfolio construction by Intelligent Design, I would suggest that we 'design intelligence' into our portfolio management systems. My own thinking was affected by Robert Lichello and his AIM system who thought an investor should have two 'pots' of funds, one being cash and the other equities. He mechanically prescribed a system for shifting between the two in a form of value averaging. Furthermore, I do not want to remove the utility of identifying quality stocks for inclusion in my portfolio. I have been influenced as well by William O'Neil and his CAN SLIM approach. He also knew the importance of "M" or "Market" in determining one's bias. He also has suggested that observing the actions of your own stocks might reveal the "M" in the Market. Furthermore, there are indeed differences between stocks and consistency in financial results and reasonable valuation evaluations are not to be scoffed.
Goldberg got into trouble by taking positions in companies and blindly holding on. He watched his investments decline and his contempt for advisers grow. He was playing battleship and his ships were sinking. What was missing was an 'exit and entrance strategy'. He needed the dynamic approach in investing that a 'Bishop, Rook, or Queen' has in a chess game. That is, knowing when he could and would sell both on the upside and downside with each of his investments. He could be able to determine when he should be in cash and when he should be in equities.
It doesn't have to be a decision that we each individually make. Rather, these decisions are made 'on the go' depending on the performance of the market, and the performance of our individual holdings. We cannot control the market, the price changes of any of our stocks, but we can control our own response to those movements. And like Darwin, with careful observation we will be able to utilize the environmental pressures acting upon our own portfolios to hopefully evolve our holdings into something much greater than what we started with.
So when examined microscopically, my 5 share sale of 3M and my subsequent purchase of Colgate stock may seem to be insignificant and devoid of significance. But these actions are part of a greater strategy designed to produce something far more important--a rational approach to selecting holding and responding to the stock market. I know that is a big goal for an amateur like myself, but I am up to the challenge!
Yours in investing,
Bob
3M (MMM) and Colgate-Palmolive (CL) "Trading Transparency"
Hello Friends! Thanks so much for stopping by and visiting my blog, Stock Picks Bob's Advice! As always, please remember that I am an amateur investor so please remember to consult with your professional investment advisers prior to making any investment decisions based on information on this website.
It has been awhile since I have been able to report to you about a sale on 'good news' which for me means one of my holdings hit an appreciation target. If you are new to my blog and my investing technique, let me briefly point out that after an initial purchase I try to sell my holding quickly and completely should it decline 8% (or 12% if I am at my minimum of 5 holdings) and call this a sale on 'bad news'. In these cases, I generally 'sit on my hands with the proceeds (or replace that position with a smaller position if I am at my minimum of 5 holdings). In this fashion, my portfolio 'management system' directs me to move towards cash on these sales and out of equities.
On the other hand, if one of my holdings hits an appreciation target, that is advances in price to a predetermined level, I plan on selling a small portion of that sale and using that sale as a 'signal' that I should be moving further into equities by purchasing a new position--indeed a position larger than the average size of my remaining holdings! Currently, I use 30, 60, 90, 120, 180, 240, 300, 360, 450% and so on appreciation targets to make these partial sale. These 'small portions' are currently set at approximately 1/7th of my holding--small enough to allow the remaining position to grow over time in spite of these continued sales. These sales are also useful in offsetting the many small losses that can accumulate with the quick sales on declines.
Anyhow, my 3M stock (MMM) hit an appreciation target on Friday. As background, I had purchased a small position of 33 shares of MMM on 3/3/09, just last month, at a cost of $43.64/share. On Friday, 4/24/09, I sold approximately 1/7th of my holding, a miniscule 5 shares, at $56.82/share, representing a gain of $13.18 or 30.2% since purchase. This gave me a 'buy signal' and I purchased 125% of my average size holding, or approximately $2,500 worth of Colgate-Palmolive (CL), which worked out to 43 shares purchased at $59.36/share to consist of my new 6th position.
I just reviewed Colgate (CL) on this blog and have explained why I might be interested in this 'recession-resistant' stock which pays a dividend and sports a moderate p/e.
Looking forward, my next partial sale of MMM on the upside would be at a 60% appreciation over my purchase price which would work out to a price of 1.6 x $43.64 = $69.82. On the downside, after an initial partial sale, I move my sale price up to the cost which would be at the $43.64 level. Insofar as Colgate (CL) is concerned, my first sale on the upside would be planned at 1.3 x $59.36 = $77.17. On the downside, an 8% loss (with 6 positions now in my portfolio my loss tolerance decreases to 8% from 12%) works out to .92 x $59.36 = $54.61.
Thank you for stopping by and visiting my blog! If you have any comments or questions, please feel free to leave them right here or you can email me at bobsadviceforstocks@lycos.com.
Yours in investing,
Bob
Sunday, 12 April 2009
Coca-Cola (KO) or Colgate Palmolive (CL) "Comparing Two Blue Chips!"
Hello Friends! Thanks so much for stopping by and visiting my blog, Stock Picks Bob's Advice! As always, please remember that I am an amateur investor, so please remember to consult with your professional investment advisers prior to making any investment decisions based on information on this website.
 One of the things this bear market has done to me is to change my own perspective on stocks. I am less a momentum player and more a conservative stock picker. That of course could change if the market indeed makes a fundamental readjustment.
I am of course waiting for a signal from my own portfolio which would consist of one of my own stocks hitting an appreciation target and triggering a partial sale of shares. If that should happen, and if the market rally continues it is likely, then I shall be looking for a new holding to add to my small clutch of 5 stocks (I max out at 20 positions).
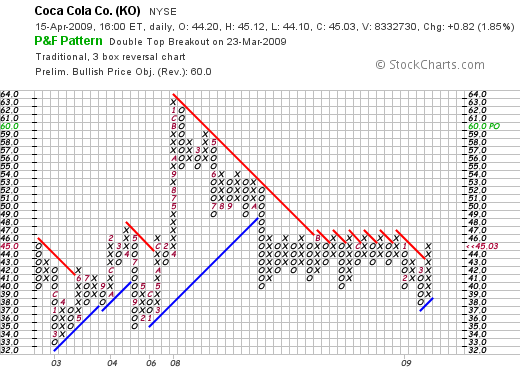
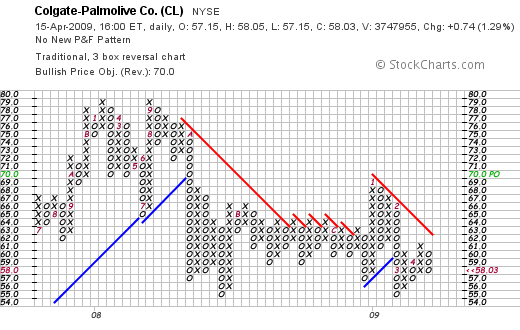
 Two of my favorite blue-chip type stocks are Coca-Cola (KO) and Colgate Palmolive (CL). I do not currently own shares in either of these companies. Coca-Cola (KO) closed today (4/15/09) at $45.03, up $.82 or 1.85% on the day. Colgate-Palmolive closed at $58.03, up $.74 or 1.29% today.
Both of these stocks are what I would call recession-resistant holdings. (Motley Fool also likes Coca-Cola (KO)). But which is 'better'? Is one of these a better choice than the other in these times?
I would like to try to as simply as possible look at the latest quarter, the longer-term results, valuation, and chart on each and see if we can come to some decision about which might be the better pick for this blog (and where I might choose to park some money should the opportunity arise and I receive the appropriate 'signal'!).
Regarding the latest quarter, Coca-Cola (KO) reported 4th quarter 2008 results on February 12, 2009. Adjusted earnings per share (removing one-time items) came in at $.64/share, an increase of 10%. (Un-adjusted they were $.43/share but were adjusted to a "non-cash imparment charge at Coca-Cola Enterprises") These results beat Wall Street estimates of $.61/share on revenue of $7.52 billion. However, the company missed the same revenue estimates as they came in at $7.13 billion in revenue for the quarter.
For me at least, this is a mixed bag of results.
What about Colgate (CL)? On January 29, 2009, Colgate (CL) reported 4th quarter 2008 results. Sales for the quarter increased 0.5% to $3.6 billion and unit volume increased 1%. Net income grew 7% in the quarter to $497 million or $.94/share, up from $414.9 million or $.77/share the prior year.
Excluding restructuring charges, which analysts generally exclude as well, they came in at $1.00/share, ahead of analysts' expectations of $.98/share. For the entire year 2008, the company, excluding the one-time restructuring charges, came in at $3.87, again beating expectations. The company indicated that it was "comfortable" with analyst' forecast of $4.23/share for the year, which would be 9% ahead of the 2008 results.
Insofar as the latest earnings are concerned, I am more impressed with the Colgate (CL) results. Chalk one up for CL!
What about longer-term?
Reviewing the Morningstar.com "5-Yr Restated" financials on Coca-Cola, we can see a nice increase in revenue from $21.7 billion reported in 2004 to $31.9 billion in 2008. This is about a 50% increase during that period.
Earnings have increased from $2.00 in 2004 to $2.57 in 2007 and dipped slightly to $2.49 in 2008. The company has increased dividends steadily from $1.00/share in 2004 to $1.52/share in 2008. During that same period, KO managed to reduce outstanding shares from 2.43 billion in 2004 to 2.34 billion in 2008.
The company has been generating oodles of free cash flow with $4.55 billion reported in 2006 increasing to $5.60 billion in 2008. Balance-sheet-wise, the company has $4.7 billion in cash, $7.5 billion in other current assets for a total of approximately $12.2 bilion. Compared to the $13.0 billion in current liabilities this results in a current ratio of just under 1.0. Long-term liabilities are not insignificant at $7.06 billion.
And Colgate (CL)?
Looking at the "5-Yr Restated" financials on Colgate from Morningstar.com, we can also see the steady growth in revenue from $10.6 billion in 2004 to $15.3 billion in 2008. Earnings have increased without interrruption from $2.33/share in 2004 to $3.66/share in 2008. Dividends have also increased in an uninterrupted fashion from $.96/share in 2004 to $1.56/share in 2008. Outstanding shares have also been reduced from 570 million in 2004 to 535 million in 2008.
Free cash flow has been solidly positive with $1.35 billion in 2006 increasing to $1.56 billion in 2008. Checking the balance sheet, Colgate is reported to have $555 million in cash and $3.16 billion in other current assets. This total of approximately $3.7 billion, when compared to the $2.95 billion in current liabilities yields a current ratio of approximately 1.25. The company has an additional $5.1 billion in long-term liabilities according to Morningstar.
From my perspective, with the uninterrupted earnings growth and the stronger balance sheet, the edge once again goes to Colgate.
And what about valuation?
Looking at the Yahoo"Key Statistics" on KO, we see that the comapny has a trailing p/e of 18.11 with a forward p/e of 13.24 (fye 31-Dec-10). This results in a PEG of 1.74.
Again looking at the number on Yahoo for CL this time, we see that the trailing p/e is 15.86, with a forward p/e of 12.48 (fye 31-Dec-10). The PEG is reported at 1.24.
Again, valuation appears a bit better with Colgate (CL) but in absolute p/e ratios as well as PEG estimates of valuation relative to growth in earnings.
What about the charts?
First the 'point & figure' chart on Coca-Cola (KO) from StockCharts.com. Here we see that the company which peaked at $63 in January, 2008, has been trading in a relatively tight range between $38 and $47 since October, 2008. Recently the stock broke through 'resistance' at around $45.03.
And the chart on Colgate (CL)? Actually, checking the 'point & figure' chart on CL from StockCharts.com, I would give a slight edge to Coke with the stock also peaking at $79 in September, 2008, only to dip to a low of $55 in October, 2008, and then trade since that time between $55 and $69 til the present time where it closed at $58.03. The stock, as noted, is trading slightly below its resistance line.
My conclusion?
 It really isn't fair to compare two different companies like Coca-Cola and Colgate. However, if one is to look at recent earnings, longer-term results, and briefly at valuation and a chart, I would be leaning towards Colgate Palmolive (CL), which had a slightly better recent earnings announcement, a steadier history of earnings and revenue growth with a stronger balance sheet. Valuation-wise, Colgate is a bit 'cheaper' than Coke as well. Finally, while their charts are similar, the edge may be perhaps slightly to Coca-Cola's favor.
I am not currently an owner of either of these stocks. But if I had the opportunity, I would be selecting Colgate as my next 'conservative' growth stock! While Coke remains a perennial favorite of mine, and I believe is well-positioned for growth in the future, the numbers are driving my assessment. While many things 'go better with Coke', Colgate-Palmolive (CL) offers me the Total solution :).
 Thanks so much for visiting my blog. If you have any comments or questions, please feel free to leave them on the website or email me at bobsadviceforstocks@lycos.com.
Yours in investing,
Bob
Posted by bobsadviceforstocks at 9:43 PM CDT
|
Post Comment |
Permalink
Updated: Wednesday, 15 April 2009 10:16 PM CDT
Friday, 10 April 2009
Smucker (SJM)
Hello Friends! Thanks so much for stopping by and visiting my blog, Stock Picks Bob's Advice! As always, please remember that I am an amateur investor, so please remember to consult with your professional investment advisers prior to making any investment decisions based on information on this website.
 I was listening last night to Jim Cramer's "Lightning Round" and I was surprised to hear him discourage a caller who asked about Smucker (SJM).
I have to tell you that I have 'soft spot' for Smucker ever since years ago I remember visiting the Watsonville plant with my father and being amazed at the spectacular processing plant that made so many of the jams and jellies that I and my family regularly consumed. Looking now for information on this factory, it does appear that it was closed back in 2003.
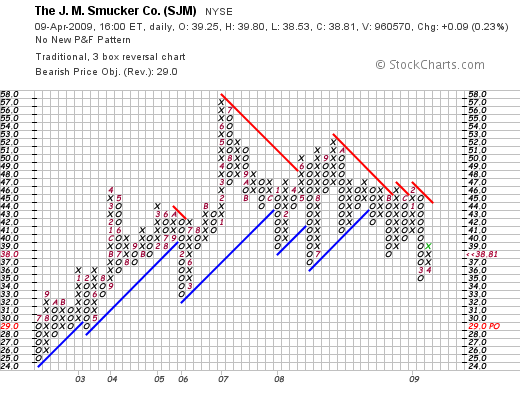
I don't currently own any shares of Smucker (SJM) and the stock closed at $38.81 on April 9, 2009, up $.09 or 0.23% on the day.
 But I still was a bit upset when I heard Cramer say that a Smucker purchase was 'too conservative'. So let's take a closer look at this stock and see if my own bias and love of those wonderful preserves is just affection or investing intelligence!
Smucker's has grown quite a bit since my own tour of the Smucker factory back in about 1962. In 2008 Smucker added Folger's coffee to its stable of products from Procter and Gamble. This followed the 2001 acquisition of Jif and Crisco from Procter and Gamble. So there certainly is a lot more to Smucker than strawberry preserves!
Let's take a look at their latest quarterly results. On February 25, 2009, Smucker (SJM) announced 3rd quarter results. Indeed the report was a mixed set of results. For the three months ended January 31, 2009, sales climbed 78% to $1.18 billion slightly under analysts' expectations of $1.22 billion. Adjusted earnings (taking out 'one-time' items) came in at $77.9 million, up 84% from $42.4 million. However, earnings per share declined 9% to $.68/share from $.75/share the prior year. This decline was attributed to the $.20/share cost of integrating the Folgers coffee brand. Adjusted profit was $.88/share, slightly head of the $.87/share expected by analysts according to Thomson Reuters. Thus they disappointed in revenue and exceeded expectations on earnings.
However, they also cut guidance for the full 2009 fiscal year to $3.6 billion to $3.7 billion down from prior expectations of $3.8 billion to $4 billion. Analysts had been expecting sales of $3.84 billion.
As the article states:
"J.M. Smucker said it made the cut because of lower sales of peanut butter and it plans to cut prices of its oils, flour and coffee."
Because of the Salmonella problem at the Peanut Corporation of America plant in Georgia, consumers slowed down their peanut butter purchases. In fact, as this article points out:
"Jarred peanut butter sales have been tumbling, even though that category has generally not been involved in the recalls. In the four weeks ending Jan. 24, about 33.8 million pounds of peanut butter in jars were sold -- a 22 percent drop from the same period last year."
Thus, in more or less a 'perfect storm' of economic slowing, the Folger's acquisition, and the Peanut Butter Salmonella fiasco, Smucker's (SJM) is feeling the effects and this is reflected in the lowered guidance.
What about longer-term results?
Looking at the Morningstar.com "5-Yr Restated" financials for Smucker (SJM), we can see that the company has been increasing its sales steadily from $1.37 billion in 2004 to $2.53 billion in 2008 and $3.28 billion in the trailing twelve months (TTM).
Earnings have steadily increased from $2.24/share in 2004 to $3.00/share in 2008 and only dipped to $2.99/share in the TTM. Dividends have also been paid and increased annually with $.92/share reported in 2004 and $1.22/share paid in 2008 and $1.28/share paid in the TTM.
Free cash flow is positive with $135 million in 2006 and $115 million in 2008. $192 million in free cash flow is reported in the TTM.
The company appears adequately financed with $360 million in cash and $984 million in other current assets. This total of $1.34 billion, when compared to the $1.12 billion in current liabilities yields a current ratio of approximately 1.2. The company also has an additional $2.2 billion in long-term liabilities.
In terms of valuation, checking the Yahoo "Key Statistics" on Smucker (SJM), we can see that this is a large cap stock with a Market Cap of $4.6 billion. The trailing p/e is a reasonable 12.98 with a forward p/e even nicer at 11.52 (fye 30-Apr-10). The PEG ratio works out to a reasonable 1.42.
In terms of valuation, according to the Fidelity.com eresearch website, the company has a Price/Sales (TTM) ratio of 0.84 just over the industry average of 0.82. The company has a Return on Equity (TTM) of 8.31, well under the industry average of 20.79%.
Returning to Yahoo, there are 118.43 million shares outstanding with 114.11 million that float. As of 3/10/09 there were 2.69 million shares out short yielding a short interest ratio of only 1.1. The forward dividend rate if $1.28 yielding a forward rate of 3.3%. No prior stock splits are reported.
In terms of the chart, if we look at a 'point & figure' chart on Smucker (SJM) from StockCharts.com, we can see that the stock was moving ahead nicely from June, 2002, when it was trading at around $25/share, until June, 2007, when it peaked at around $57. Since then it has been struggling and dipped to a recent low of $35 before rebounding in April to its current level of $38.81.
In summary, in a sort of Peter Lynch style of investing, there is something very appealing about buying into brands like Smucker, Jif, and Crisco in these trying times. Sort of like eating 'comfort food' when times are tough, and a little like investing in Johnson & Johnson (JNJ) stock right after the Tylenol Scare, maybe there are ways of profiting from this most-likely temporary public distrust of peanut butter at the grocery stores.
Certainly, I don't think this is the time to avoid 'conservative' stocks! But there are some bumps in the road for Smucker (SJM) not the least being the public concerns about peanut butter and its Folgers acquisition. But I believe these are transient problems. I really do like this company. I like their sustained revenue growth, their record of steadily increasing earnings and their emphasis on dividend growth. Their balance sheet is adequate and valuation seems reasonable. I don't much like their chart. But then again, there are few charts out there that I find attractive.
Anyhow, that's my 'peanut-butter and jelly' response to Cramer.
If you have any comments or questions, please feel free to leave them on the blog or email me at bobsadviceforstocks@lycos.com.
Yours in investing,
Bob
Friday, 27 March 2009
Rollins (ROL) and Walgreen (WAG) "Trading Transparency"
Hello Friends! Thanks so much for stopping by and visiting my blog, Stock Picks Bob's Advice! As always, please remember that I am an amateur investor, so please remember to consult with your professional investment advisers prior to making any investment decisions based on information on this website.
 As is my policy, I try to share with you my own actions in my Trading Account as soon as possible as part of my own 'trading transparency'. Earlier today I sold my 350 shares in Rollins (ROL) at $16.054. These shares had been purchased 10/16/08 at a cost basisof $14.69/share; thus, I had a gain of $1.364/share or 9.3% since purchase.
In general I have a very defined program for buying and selling shares based on the underlying performance of the stock in question. But simply put, Rollins (ROL) represented an over-weighted position in my trading account and I didn't like the way it was trading. In many ways, this is exactly the type of transaction I try to avoid, this gestalt approach to investing, but I have always reserved the right to make small adjustments to my account, including replacing a position, when it simply didn't seem to be trading well. For instance, the stock has been trading down when the market has been otherwise strong, and the chart looks vulnerable to a correction from my amateur perspective.
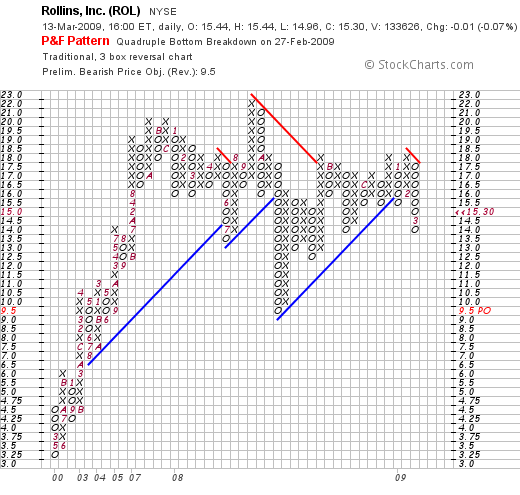
In fact, let's take a look at that 'point & figure' chart from StockCharts.com on Rollins (ROL):
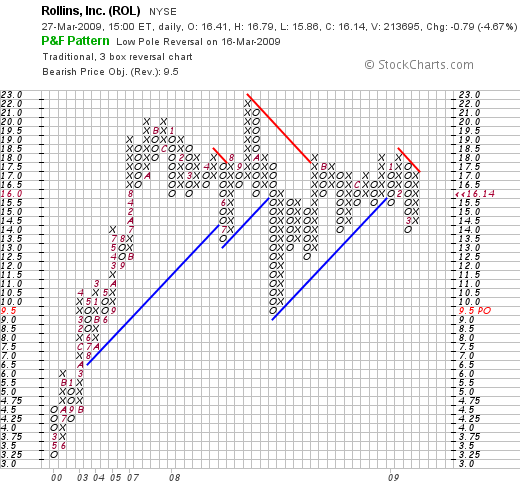
This is more or less the third time the stock has broken through support levels and with the market now correcting from its recent bull move, it seemed like it might be a good time to step aside. Time will tell.
Certainly, the last quarterly report was good for Rollins (ROL)and the '5-Yr Restated' financials from Morningstar look solid except perhaps for a bit of a heavy load of current liabilities reported at $272.8 million, with $14 million in cash and $103 million in other current assets giving the current ratio a value of about .42 well under my own preferred current ratio of at least 1.0 or 1.5. Considering that the company is only generating $76 million in free cash flow for the past 12 months, from my own amateur perspective, this might mean that the company will need to be issuing shares or looking to borrow funds to cover these liabilities.
I didn't feel comfortable being overweighted in this company, and chose to switch into a new holding, Walgreen (WAG), which appeared to be outperforming the market today.
 After selling my shares in Rollins (ROL) I replaced this holding with a new fifth holding, Walgreen (WAG) and purchased an amount equal to the average size of my other four holdings, about $2050. Precisely, I purchased 77 shares of Walgreen (WAG) at $26.63. WAG is trading at $26.40 as I write, so I am down a bit on this purchase already.
I am a frequent visitor to my local Walgreen store, so it certainly is something I am familiar with. I am afraid that may sound a bit Peter Lynch, but this stock is also a stock that I first was introduced to as an investment via Gene Walden and his "The 100 Best Stocks to Own in America". Gene, wherever you are now, thank you for helping introduce me to some of the concepts that drive my own thinking today! For Walden, consistency of earnings, revenue growth, and even dividends was key. Walgreen (WAG) for years has been a steady performer and even in today's difficult retail and economic environment, still works to grow its presence across the United States and Canada.
Just four days ago, on March 23, 2009, Walgreen (WAG) reported 2nd quarter 2009 results. Revenue for the quarter came in at $16.48 billion up 7% over the prior year. More importantly they exceeded analysts' expectations of $16.42 billion. Earnings came in at $640 million or $.65/share. Excluding restructuring cost of $.06/share, that worked out to $.71/share and once again they managed to exceed analysts' expectations of $.66/share according to Thomson Reuters.
Interestingly, they reported a 4% increase in total prescriptions for the quarter as compared to an industry-wide decrease of 1%. Their prescription business is driving sales as same-store prescription revenue climbed 2.9% while "front-end sales" of merchandise actually fell 1.2% during this period. Really not too bad with the economic slowdown affecting retail sales.
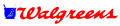
Furthermore, it looks as if most of the damage to Walgreen (WAG) shares is at least for the time being done. If we look at the 'point & figure' chart on Walgreen (WAG) from StockCharts.com, we can see that the stock has shown strong support at the $22 range down from a plateau in the $48 to $50 range between 2005 and 2008. It appears, from my amateur perspective, to have had a triple bottom at that level.
If we examine the Morningstar.com '5-Yr Restated' financials on Walgreen (WAG), we see that the company shows a superb record of increasing revenue from $37.5 billion in 2004 to $59.0 billion in 2008 and $60.0 billion in the trailing twelve months (TTM). Earnings per share have also steadily increased from $1.31/share in 2004 to $2.17/share in 2008 only to dip slightly to $2.12/share in the TTM.
Dividends have been increased each year (a really nice finding if you can identify companies with this record) from $.18/share in 2004 to $.40/share in 2008 and $.42/share in the TTM. In addition, the company has been reducing outstanding shares from 1.03 billion in 2004 to 996 million in 2008 and 994 million in the TTM.
Free cash flow has decreased recently but is decidedly positive with $1.1 billion reported in 2006 and $588 million reported in the TTM. Unlike the balance sheet on Rollins (ROL) above, Walgreen (WAG) is reported to have cash of $866 million and $11.273 billion in other current assets. This total of $12.1 billion, when compared to the $8.5 billion in current liabilities yields a current ratio nearly at 1.5. The company does have an additional $2.9 billion in long-term liabilities per Morningstar.
According to the Yahoo "Key Statistics" on Walgreen (WAG), the company is a large cap stock with a market capitalization of $26.07 billion. The trailing p/e is a very reasonable 12.69 with a forward p/e (fye 31-Aug-10) estimated at an even nicer 11.52. The PEG works out to a very acceptable 1.1 level.
Thinking a little bit more of valuation of the company, referring to the Fidelity.com eresearch page on Walgreen, we can see that the Price/Sales works out to a nice 0.4 compared to the industry average of 1.00. In terms of profitability, the company is reported to have a Return on Equity (TTM) of 16.68%, slightly below the industry average of 18.35% according to Fidelity.
As already noted, there are 998 million shares outstanding per Yahoo, with 980.12 million that float. As of March 10, 2009, Yahoo reports that there were 23.39 million shares out short, but due to the large daily volume of 10.8 million, works out to a short interest ratio of only 2.1.
The company pays a forward annual dividend of $.45/share yielding 1.7%. Walgreen (WAG) last split their shares February 16, 1999, when they declared a 2:1 stock split.
Anyhow, I made the switch from Rollins (ROL) to Walgreen (WAG). In the process, I reduced my exposure from this relatively over-sized position to a smaller position similar to the size of my other holdings. I am still not real comfortable with the market. I am not convinced that the Geithner plan will yield quick results and that the worldwide economic challenges will be easily surmounted.
However, I am confident that my neighborhood Walgreen store will remain busy with their growing number of 24 hour pharmacies and extensive front-end merchandise!
Thanks again for stopping by and visiting my blog. If you have any comments or questions, please feel free to leave them right here on the website or email me at bobsadviceforstocks@lycos.com.
Yours in investing,
Bob
Sunday, 15 March 2009
Trading Portfolio Update: Haemonetics (HAE), 3M (MMM), PetSmart (PETM), Rollins (ROL), and AT&T (T)
Hello Friends! Thanks so much for stopping by and visiting my blog, Stock Picks Bob's Advice! As always, please remember that I am an amateur investor, so please remember to consult with your professional investment advisers prior to making any investment decisions based on information on this website.
This blog has been about several things simultaneously. I have been trying to share with you ideas about stocks that might be suitable for investment, I have presented a way of managing your portfolio in response to market conditions and the stocks actions themselves, and I have shared with you my own trading account that I have for the most part been applying these same rules. In some sense, this account is my own investment experiment.
After a very strong week in the market, it seemed like a nice time to check on my own holdings, to see how the stocks are doing and how the actual companies are performing. These are actual holdings of mine in my own 'trading account'.
 I currently own 50 shares of Haemonetics (HAE) that were purchased 10/27/08 at a cost basis of $51.70. HAE closed at $54.62 on March 13, 2009, for a gain of $2.92 or 5.6% since purchase. I have not sold any of these shares since purchase.
Since I am at my 5 position minimum, I plan on selling all of my shares of HAE if the stock should incur a (12)% loss, which would work out to a sale price of $51.70 x .88 = $45.50. On the upside, my targeted appreciation point remains at a 30% gain which would work out to a price of $51.70 x 1.30 = $67.21. At that point, I would plan on selling 1/7th of my holdings or 7 shares. That sale on an appreciation target reached would also give me a 'buy signal' to be buying a new position.
Insofar as recent earnings, HAE reported 3rd quarter 2009 results on February 2, 2009. Revenue for the quarter ended December 27, 2008, increased 16% to $155.4 million from $134.6 million in the prior year, ahead of expectations of $144.9 million. Earnings came in at $.63/share (excluding one-time items), ahead of $.54/share the prior year. This beat expectations of $.61/share. The company also raised guidance for 2009 revenue and earnings.
Positive growth in earnings and revenue that beats expectations and finds a company raising guidance is about everything an investor could possibly seek in a quarterly report!
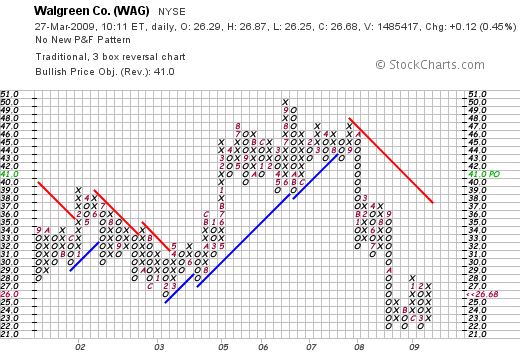
In terms of a recent chart, the point and figure chart on Haemonetics from StockCharts.com shows the pressure that the stock has been under even with these results. The stock recently bounced off the $49 level in November, 2008, broke through resistance at the $56 level, only to peat at $65 in February, 2009, pull back to a $51 level, and is only now appearing to try to once again move higher. In other words, since May, 2008, the stock has been trading in a range between $49 and $66.
3M (MMM) is a recent purchase of mine, having purchased 33 shares of MMM on 3/3/09 at a cost basis of $43.64. 3M closed at $48.00 on 3/13/09 for a gain of $4.36 or 10% since purchase. Again, insofar as a sale on the downside, a (12)% loss would mean a sale of all shares at $43.64 x .88 =$38.40. On the upside, a 1/7th sale at a 30% gain works out to a sale of 4 shares (!) at a price of 1.3 x $43.64 = $56.73.
On January 29, 2009, 3M (MMM) reported 4th quarter 2008 results. Sales for the company dipped (11.2)% to $5.51 billion, with earnings dropping (37)% to $536 million or $.77/share down from $851 million or $1.17/share the prior year. The company also reduced guidance to a (5) to (9)% dip in revenue and lowered expectations for 2009 earnings to a range of $4.30 to $4.70 from $4.50 to $4.95/share previously suggested. However, shortly thereafter, on February 11, 2009, the company announced that it would be raising its dividend 2% to $.51/share from $.50/share and they also extended their authorization to buy-back shares.
As you may realize, I have been adjusting my purchases recently towards more value investments with dividends and this 3M purchase has thus far worked out nicely.
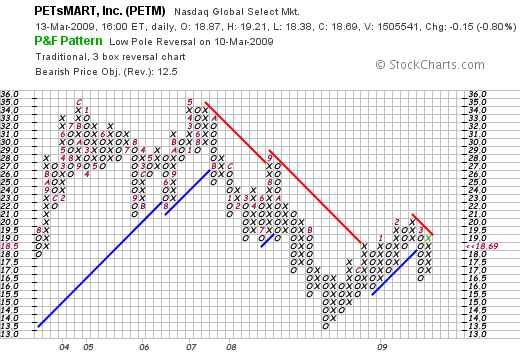
If we look at the point and figure chart on 3M from StockCharts.com, we can see little to admire. The stock recently bottomed at $41 after trading as high as $91/share in November, 2007. This stock has yet to find support in its price with a series of lower lows and lower highs and a 'resistance line' that has yet to be convincingly broken.
Currently I own 90 shares of PetSmart (PETM) that were acquired 11/20/08 at a cost basis of $15.50/share. I sold my first 1/7th of my holding (15 shares) on 2/6/09 when the stock reached a price of $19.90, representing a gain of $4.40 or 28.4%. This stock sale was initiated when the stock was trading at essentially a 30% gain, my first targeted sale point.
PETM closed at $18.69 on 3/13/09, for a current gain of $3.19 or 20.6% on my holding. Having sold 1/7th of my shares at a 30% gain, my next targeted sale would be 1/7th of my holdings or 12 shares if the stock should reach a 60% appreciation level or $15.50 x 1.60 = $24.80. On the downside, all shares would be sold if the stock should reach 'break-even' or $15.50. It is my policy to continue to move up my sale point after partial sales on appreciation and in this case, after a single sale at a 30% gain, the sale point is moved up to break-even.
On March 4, 3009, PetSmart (PETM) reported 4th quarter 2008 results. Revenue for the quarter increased 2.3% to $1.36 billion. (The company noted that this period was 13 weeks vs. the 14 week period the prior year.) Same store sales, a more important sales figure for a retail firm, increased 3% in the quarter. During this period, the company earned $78.4 million or $.62/share, up from $75.4 million or $.59/share the prior year period.
The company beat expectations of $.59/share and met revenue expectations of $1.36 billion. However, the company announced guidance for fiscal 2010 to a profit of $1.40 to $1.50/share (analysts had been expecting $1.48), and revenue guidance was mid-to-high single digits. Analysts expected $5.23 billion in revenue working out to a 3% increase.
Reviewing the point and figure chart on PETM from StockCharts.com, we can see that the stock price actually 'rolled-over' after a 'double-top' in May, 2007, when the stock was as high as $35. Recently the stock bottomed at $13.50 in November, 2008, and has rallied back to a recent high of $20 in February, 2009. The stock has met some resistance recently and has come back from $16.50 to a recent price of $19.
Rollins (ROL) is my largest holding currently; I own 350 shares of ROL that were purchased 10/16/08 at a cost basis of $14.69. I have not sold any of these shares since my purchase. ROL closed 3/13/09 at $15.30 for a gain of $.61 or 4% since purchase.
On the upside, I plan on selling 1/7th or 50 shares of ROL should the stock appreciate to $14.69 x 1.30 = $19.10. On the downside, with 5 positions (at 6 or more holdings, my loss tolerance narrows to my usual 8%), my anticipated share of all shares of ROL would occur should the stock decline to .88 x $14.69 = $12.93.
On January 28, 2009, Rollins (ROL) reported 4th quarter 2008 results. For the quarter ended December 31, 2008, revenues came in at $248.1 million, up 14.9% over prior year's revenue of $216 million. Net income grew 5.2% to $12.6 milion or $.13/diluted share, up from $11.9 million or $.12/diluted share the prior year.
The point and figure chart on Rollins from StockCharts.com appears slightly more encouraging than some of the other charts of stocks in my portfolio. The stock had a meteoric rise from $3.25/share to a high of $22.00/share in September, 2008. Since that time, the price corrected to $9.50/share in October, 2008 and has been working its way higher except for some recent weakness when the stock broke through support at $15.50 in January, 2009, dipped as low as $14.00 and is now trying to move higher once again.
AT&T (T) is another of my recent purchases which represent what I would call my 'value' selections. I own 71 shares of T purchased 2/20/09 at a cost basis of $23.75/share.
AT&T closed at $24.27 on 3/13/09, representing a gain for me of $.52/share or 2.2% since purchase.
Insofar as sale points, on the upside, I would plan on selling 1/7th or 10 shares should T shares reach a 30% gain or 1.30 x $23.75 = $30.88. On the downside, a 12% loss works out to a price of 0.88 x $23.75 = $20.90. At that point all of my shares would be sold.
On January 28, 2009, AT&T (T) reported 4th quarter 2008 results. Net income fell 23.3% to $2.4 billion or $.41/share, down from $3.1 billion or $.51/share the prior year. Revenue climbed 2.4% to $31.4 billion.
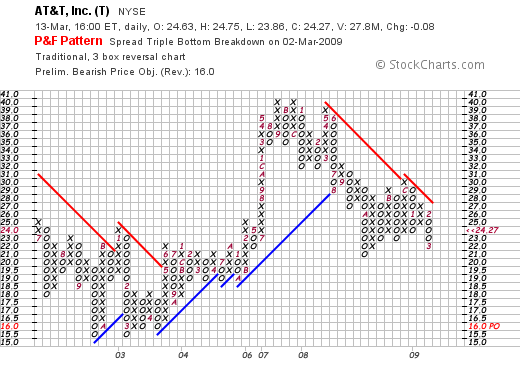
Checking the point and figure chart on AT&T (T) from StockCharts.com, we can see that the stock climbed from $16.00 in April, 2003, to a high of $40 in November, 2007, only to dip as low as $21 in October, 2008. The stock has recently been under pressure hitting $22 this month to close Friday at $24.27.
Overall, my trading account has a value of $34,860.14 as of 3/14/09. I continue to deposit $200 monthly into the account. The account consists of equities valued at $13,075.27 and cash of $21,748.87. Thus, I am 62.5% cash at this time.
I do not choose the amount of cash to be holding as compared to the amount in equities. It is the performance of my own stocks that dictates to me whether to be buying a new position or moving more into cash. The bear market that we are all experiencing has driven my portfolio to the minimum of 5 holdings. I shall move more into equities depending on the performance of my own stocks in response to the market and response to underlying news.
Year to date I have taken a total of $(443.49) of losses representing a total of $(443.49) in short-term losses and $0 in long-term gains or losses. As of 3/15/09, my stocks have an unrealized gain of $827.63.
Thanks so much for visiting and spending time on my blog. If you have any comments or questions, please feel to leave them right here or email me at bobsadviceforstocks@lycos.com.
Yours in investing,
Bob
Newer | Latest | Older


