Stock Picks Bob's Advice
Thursday, 29 April 2010
Iron Mountain (IRM) "A Friend Asks...."
Hello Friends! Thanks so much for stopping by and visiting my blog, Stock Picks Bob's Advice! As always, please remember that I am an amateur investor, so please remember to consult with your professional investment advisers prior to making any investment decisions based on information on this website.
Over the last seven years I have enjoyed getting up way too early to get myself over to the La Crosse Exercise and Health Program where I try to at least get out and walk a few miles with some really great people and graduate students. We manage to talk about our children, sometimes grandchildren, spouses, politics, the weather, and offer our sage advice to the University of Wisconsin, La Crosse graduate students getting their degrees in exercise physiology.
Recently I have been prompted a time or two about my thoughts on Iron Mountain (IRM) by Jerry H. (in the front in the middle below) a good friend of mine and fellow walker in our 3 mile walking group. Jerry has been very interested in stocks and has made some very good picks (Netflx (NFLX)) and other stock investments like Wachovia that haven't worked out quite as well.
 Recently he has been quite interested in Iron Mountain (IRM) which he recently switched for Cintas (CTAS). He has been asking me about this stock telling me he was putting limit prices and I suggested if he wanted to buy the stock to just go ahead and buy it at the market.
Jerry did that today and it didn't work out very well. In fact, in the midst of the big market rally today, his recent purchase of shares in Iron Mountain (IRM) moved in the opposite direction.
Jerry emailed me with this comment:
"Great! Been chasing the damn thing for a couple of weeks with limit order buys, then some guy in my exercise group says, “Just do a market order buy.” So I do that and the damn thing drops 8% at that very moment.
IRM Iron Mountain Inc (IRM) 25.80 -2.20 (7.86%)"
That "guy" was me.
Let's take a closer look at this stock and see if it looks like Jerry made a good purchase and that the stock price move should be ignored or whether this price decline may be a sign of greater weakness in the future.
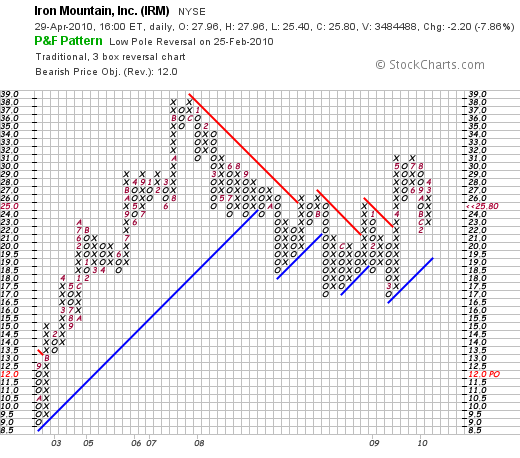
 As Jerry pointed out, Iron Mountain (IRM) closed at $25.80, down $2.20 or (7.86)% on the day.
According to the Yahoo "Profile" on IRM, the company
"...provides information management and related services for various media in North America, Europe, Latin America, and the Asia Pacific. It offers records management, data protection and recovery, and information destruction services. The records management services include records management program development and implementation to help customers comply with specific regulatory requirements; implementation of policy-based programs that feature secure storage for media consisting of paper, flexible retrieval access, and retention management; digital archiving and related services for secure long-term archiving of electronic records; and specialized services for vital records and regulated industries, such as healthcare, energy, government, and financial services."
What drove the stock lower today was the 1st quarter 2010 results this morning which were reported this morning. Net income for the quarter came in at $26 million, down 11% from the $29 million in the prior year. This worked out to $.12/share down from $.14/share. 'Adjusted' earnings came in at $.23/share against last year's adjusted $.19/share. Revenue increased to $777 million, up from $723 million the prior year.
Since analysts, as assessed by Factset Research, were expecting $.22/share of earnings, on $778.2 million of revenue, the company actually exceeded earnings expectations and missed slightly on revenue results. At first glance it really seems like the selling got overdone. OK that doesn't get you any money back on your apparently poorly timed purchase. However, maybe there were whisper numbers on the earnings that just weren't loud enough to reach Western Wisconsin? Also, just meeting expectations or barely exceeding and selling off in the face of this news seems to indicate the frothy level of the market rally today. OK that doesn't make you feel any better either I know.
Longer-term, reviewing the Morningstar.com "5-Yr Restated" financials on Iron Mountain (IRM), we can see that revenue which came in at $2.08 billion in 2005, climbed to $3.06 billion in 2008, and dipped slightly to $3.01 billion in 2009. Earnings increased from $.56/share in 2005 to $.76/share in 2007, before dipping to $.40/share in 2008 and then rebounding to $1.08/share in 2009. Outstanding shares have been fairly stable at 198 million shares in 2005 increasing slightly to 204 million in 2009. No dividends are paid.
Free cash flow, per Morningstar, increased from $47 million in 2007 to $304 million in 2009. The balance sheet shows that the company has $447 million in cash and $765 million in other current assets which when compared to the $815 million in current liabilities yields a current ratio of 1.49, a healthy ratio. However, the company does have a significant amount of long-term liabilities totaling $3.89 billion. With the growing free cash flow, servicing this debt doesn't seem to be a problem.
In terms of valuation, the company is a mid cap stock with a market capitalization of $5.25 billion. The trailing p/e is a moderate 23.87, the forward (fye Dec 31, 2011) works out to 19.25 estimated. The PEG ratio is a bit rich at 1.65. (I find reasonable valueof growth stocks with PEG's at 1.5 or lower).
There are 203.6 million shares outstanding and 180.05 million that float. Currently there are 12.08 million shares out short (as of 4/15/10), and with the average daily volume of 1.36 million shares, this works out to a short ratio of 10.50, well above my own arbitrary '3 day rule' for significance. According to Yahoo the company does pay a small dividend of $.25/share with a yield expected to be at 0.9%. The last stock split was a 3:2 split in January, 2007.
Reviewing the 'point & figure' chart on Iron Mountain (IRM) from StockCharts.com, we can see that the stock which traded as low as $9/share in October, 2002, climbed to $38/share in November, 2007, only to dip to $17/share in November, 2008, and once again in March, 2009. Recently, the stock has been moving higher as the entire market has recovered, breaking through resistance at $21, and hitting a recent high of $31/share. The stock is currently correcting from its recent break-out and does not appear wildly over-valued technically from this amateur's perspective.
To summarize, Iron Mountain is in an interesting business which I do not completely understand that apparently deals with record management, data storage and recovery. They overall are a successful company with reasonable earnings and revenue growth, decent balance sheet, and a reasonably strong technical performance for the stock.
As is often the case, earnings releases often result in unexpected price volatility as stock prices climb on expectations and whispered numbers. It is common for stocks to paradoxically drop on what appears to be good news and climb on what should otherwise have been a disappointment. Frankly, there is a lot of madness in the trading activity around earnings releases. I am sorry my friend that you got caught in this volatility.

Closing with a view of the Mississippi that we often see as we walk in the morning from UWL down to the River, I thank all of my good friends both here on the net as well as right at the University who provide me with great conversation, challenge and support my own ideas, and make sure that I get out and get some fresh air and exercise many mornings of the week!
If you have any comments or questions, please feel free to leave them right here on the blog or email me at bobsadviceforstocks@lycos.com.
Yours in investing,
Bob
Saturday, 24 April 2010
Lowe's Companies Inc. (LOW) "Trading Transparency"
Hello Friends! Thanks so much for stopping by and visiting my blog, Stock Picks Bob's Advice! As always, please remember that I am an amateur investor, so please remember to consult with your professional investment advisers prior to making any investment decisions based on information on this website.
 As part of this blog, I work to keep you updated of my own trading activity, sharing with you my successes and my failures and hopefully learning from both.
On Friday (4/23/10), I had the good fortune to have my shares in TJX Companies (TJX) hit my first 'appreciation target' and I sold 8 shares of my 60 share position--representing 1/7th of my holding. The day before my Abbott Laboratories position was sold after hitting an 8% loss--another target but that time on the downside--and I sold the entire position. These two trades demonstrate my practice of selling entire positions quickly and completely as they decline to targeted prices and selling gaining positions slowly and partially as they appreciate.
In addition, with my Abbott (ABT) sale on the downside, my 'signal' was to do nothing--to literally sit on my hands with the proceeds of that sale as this was a sale on 'bad news'. However, the partial sale of TJX, since I am under my maximum of 20 holdings, means that I had a 'good news' event and thus had a single to pick up a new position.
I chose to use that signal to acquire 110 shares of Lowe's Companies (LOW) at $28.16/share, with a total purchase cost of $3,105.20. I derived this position size by determining the average size of my remaining holdings and purchasing approximately 125% of that average in terms of the value and then determining the number of shares. Thus, besides adding a new holding to increase exposure to equities, I try to increase the size of that holding beyond the average size of the other stocks in my portfolio. If and when I should decrease to my minimum of 5 holdings and one is sold, I am still required to buy another stock but instead of increasing the size of the holding I plan on purchasing shares in that particular situation at 80% of the average (4/5 vs 5/4) thus continuing to hold the minimum of 5 positions but at the same time reducing my own exposure to equities once again in the face of 'bad news'.
 As with every investor, I try to make as thoughtful an investment as possible and try to consider the stock market environment in which I am making that purchase.
There is no doubt that the construction industry has been hard hit during the recent global recession. However, the United States economy is recovering, and recent reports suggest new home sales are starting to rebound, and housing starts and permits are rising along with economic prospects. The consumer is sharing this optimism as this recent news story points out that remodeling spending is making a turn: "This year could produce the first annual spending increase for the industry since 2006," per Nicolas P. Retsinas, the director of the Joint Center for Housing Studies at Harvard University.
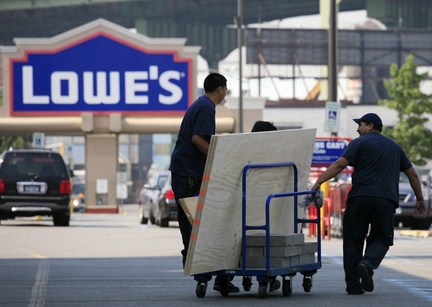
With this in mind, I turned to the retail home improvement sector for a new stock selection for my own account. Choosing between Home Depot (HD) and Lowe's (LOW) was a difficult task, but while both companies sport great records, Lowe's appears to be doing well in terms of building consumer preference. I suspect that either stock shall be doing well into the near future. I chose to go with Lowe's (LOW) with this purchase.
Let's take a closer look at this company.
According to the Yahoo "Profile" on Lowe's (LOW), the company
"... together with its subsidiaries, operates as a home improvement retailer in the United States and Canada. The company offers a range of products for home decorating, maintenance, repair, remodeling, and property maintenance. It provides home improvement products in the categories of appliances, paint, lumber, flooring, building materials, millwork, lawn and landscape products, hardware, fashion plumbing, tools, lighting, seasonal living, rough plumbing, nursery, outdoor power equipment, cabinets and countertops, rough electrical, home environment, home organization, and windows and walls, as well as boards, panel products, irrigation pipes, vinyl sidings, and ladders. The company also offers installation services through independent contractors in various product categories."
and
"As of January 29, 2010, it operated 1,710 stores, including 1,694 stores in the United States and 16 stores in Canada."
In contrast, Home Depot (HD) operates 2,244 stores including stores in the Virgin Islands, Guam, Canada, China and Mexico.
On February 22, 2010, Lowe's reported 4th quarter 2009 results. Profit for the quarter rose 27% to $205 million or $.14/share, from $162 million or $.11/share the prior year. This exceeded Thomson Reuters analysts who had expected $.12/share. More significantly, this increase was the first year-over-year increase in earnings since the 2nd quarter of 2007.
Revenue climbed 2% to $10.17 billion, from $9.98 billion the prior year same period also slightly ahead of the $10 billion expected by analysts.
For the year, profit declined 19% to $1.78 billion and revenue dipped 2% to $47.22 billion. The company did authorize a $5 billion share buyback program as well.
The company did lower guidance for the first quarter of 2010 (which should be reported in the upcoming weeks) to $.27 to $.29/share in earnings, below analysts' expectations of $.33/share, and revenue of $11.94 to $12.18 billion, fairly in line with analysts expectations of $11.97 billion. At the same time the company expressed optimism about the 2010 outlook overall.
Longer-term, if we review the Morningstar.com "5-Yr Restated" financials, we can see that revenue climbed from $43.2 billion iun 2006, peaking at $48.3 billion in 2008, $48.2 billion in 2009 and dipped to $47.2 billion in 2010. (The latest quarter has bucked this trend.) Earnings followed this rising from $1.73/share in 2006 to $1.99/share in 2007 before dipping to $1.86/share in 2008, $1.49 in 2009, and $1.21/share in 2010.
Lowe's Companies (LOW), has increased its dividend throughout this period with $.11/share paid in 2006 increasing to $.36/share in 2010. In fact, Motley Fool recently highlighted Lowe's for its dividend record. Lowe's has managed its business well, increasing free cash flow from $337 million in 2008 to $2.26 billion in 2010, even as revenue and earnings dipped.
The balance sheet appears solid with $632 million in cash and $9.1 billion in other current assets. When compared with the $7.36 billion in current liabilities, this yields a current ratio of approximately 1.3. The comnpany does have a significant long-term debt load of $6.6 billion according to Morningstar.com.
In terms of valuation, reviewing the Yahoo "Key Statistics" on LOW, we can see that the company is a large cap stock with a market capitalization of $40.73 billion. The trailing p/e is a moderate 23.34 with a forward p/e (fye Jan 29, 2012) of 16.70. The PEG ratio (5 yr expected) works out to 1.62 suggesting that future earnings are already reflected in the price.
According to the Fidelity eresearch website, LOW has a Price/Sales ratio of 0.88, well under the industry average 1.03 suggesting reasonable valuation. Paul Sturm of SmartMoney wrote an outstanding article a few years ago explaining this particular ratio in terms of comparing valuation of a company relative to other companies in the same industry group.
Yahoo reports Lowe's with 1.44 billion shares outstanding and only 17.51 million shares out short representing a short ratio of only 1.6--well under my own arbitrary 3 day rule for significance in this ratio. The comnpany pays a dividend of $.36/yr going forward yielding 1.3%. This represents a payout ratio of only 29% suggesting good coverage for continued payment and plenty of room for another dividend boost. Lowe's last split its stock in July, 2006, when they had a 2:1 stock split.
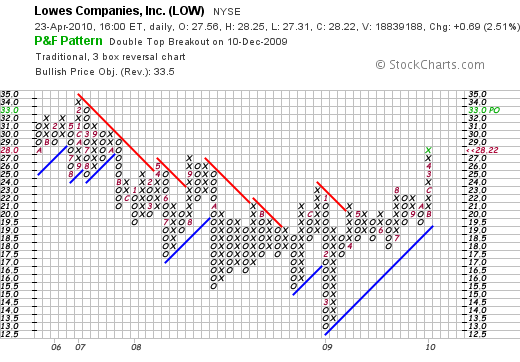
If we review the 'point & figure' chart on Lowe's Companies (LOW), we can see that the stock declined steadily from $34 in February, 2007, to a low of $13.00 in March, 2009. Since then the stock has moved higher, breaking through resistance in April, 2009, and recently moving as high as $28.22. While not without recent price appreciation, the stock chart does not appear to suggest extreme over-valuation on a technical perspective.
In summary, we have experience a terrible bull market with an associated economic recession exceeded only by the Great Depression. As the economy recovers, the consumer is once again starting to consider buying a home and remodeling or building a new home. While far from the peak in activity before the real estate implosion, this uptick in economic activity bodes well for the home improvement area and this is reflected in the recent strength of both Lowe's and Home Depot (HD).
With my own sale of a portion of another successful retailer, TJX, the opportunity presented itself to add another position. I believe that Lowe's may be a timely addition to my own stock portfolio which along with the economy is doing its best to recover!
If you have any comments or questions, please feel free to leave them right here on the website or email me at bobsadviceforstocks@lycos.com.
Yours in investing,
Bob
Posted by bobsadviceforstocks at 11:17 PM CDT
|
Post Comment |
Permalink
Updated: Sunday, 25 April 2010 12:14 AM CDT
Thursday, 22 April 2010
Abbott Laboratories (ABT) "Trading Transparency"
Hello Friends! Thanks so much for stopping by and visiting my blog, Stock Picks Bob's Advice! As always, please remember that I am an amateur investor, so please remember to consult with your professional investment advisers prior to making any investment decisions based on information ont his website.
 Last month on March 9, 2010, I diverged from my fairly rigid trading philosophy and arbitrarily sold my Walgreen (WAG) stock at $33.71 and purchased shares in Abbott Laboratories (ABT) at $55.37. My timing on this transaction probably couldn't have been much worse. Since that time, Walgreen (WAG) has actually rallied and closed today at $36.06, up $.19 on the day. Abbott (ABT) however, has moved into reverse and closed this afternoon at $51.12, down $.66 or (1.27)% on the day. In fact, the decline in Abbott stock was enough to trigger a sale at $51.07 and I liquidated my entire position of 45 shares at that level.
The sale at $51.12 represented a decline of $(4.48) or (8.06)% from my 'cost basis' of $55.55 (including the cost of the commission). As I have written before on this blog, after an initial purchase of stock, I sell my position should it decline 8% from the purchase price regardless of my own views on the worthwhileness of the investment. Certainly there are many positives to be appreciated about this company Abbott. But that doesn't really matter to me.
Since this is a sale at a loss, this represents what I refer to as a sale on 'bad news'. Thus, I do not purchase stock to replace this position but instead keep the money in cash. Fortunately, some of my other stocks are moving towards sales on 'good news' and if these stocks (like TJX) indeed reach their first 30% appreciation targets, then I shall be selling a small portion of those holdings and generating a 'good news' signal allowing me to add a new position.
I shall keep you posted.
Meanwhile, if you have any comments or questions, please feel free to leave them on the blog or email me at bobsadviceforstocks@lycos.com.
Yours in investing,
Bob
Tuesday, 13 April 2010
Schlumerger LTD (SLB) and Sysco (SYY) "Trading Transparency"
Hello Friends! Thanks so much for stopping by and visiting my blog, Stock Picks Bob's Advice! As always, please remember that I am an amateur investor, so please remember to consult with your professional investment advisers prior to making any investment decisions based on information on this website.
 Sysco (SYY) is currently one of my holdings in my Trading Account. My 125 shares were acquired 7/27/09 with an effective cost basis of $23.25/share. As I have discussed elsewhere I manage all of my holdings by minimizing losses by selling stocks quickly and completely if they decline and lock-in stocks that appreciate in price by selling them slowly and partially at targeted appreciation levels determined by my purchase price. As is my strategy, I sell 1/7th of my holding as each appreciation price is reached.
Sysco (SYY) hit my first appreciation level which is a 30% gain from the purchase price today and I sold 18 shares of my 125 shares (I now have 107 shares of SYY remaining in my account) at a price of $30.30. This represented a gain of $7.05 or 30.3% since purchase.
It is also my strategy to allocate my portfolio into equities or cash based upon the activity of my underlying holdings. In this case, owning far less than my maximum of 20 positions (only 8 currently) a partial sale on a stock appreciating (what I refer to as "good news") generates a signal to add a new holding. On the other hand should I sell a stock on a decline, I refer to this as a sale on 'good news' and instead of adding a new holding, I leave the proceeds in cash. Thus, assuming that my stocks generally reflect the overall tone of the market, I am literally forced to respond to market moves by either adding to stocks or moving into cash.
 With the sale of shares of Sysco (SYY) on good news, I utilized this "good news" buy signal to make a purchase of shares of Schlumberger (SLB). I purchased 42 shares of Schlumberger (SLB) at
 $42.00$65.48/share for a cost of $2,756.85. It is my intention to continue to add new positions on 'good news' creating a new holding slightly bigger than the average size of my other positions.
The economy appears to be slowly recovering from the deep recession of 2008. Even though unemployment remains unacceptably high at 9.7%, last month 162,000 jobs were created, the best job creation performance since the recession began. The recession kept oil prices low, making oil service companies like Schlumberger (SLB) unattractive to investors. However, oil prices have once again moved sharply higher as the recovery has developed. Graphically, we can see the sharp rebound in oil prices in this chart from MoneyWeek:
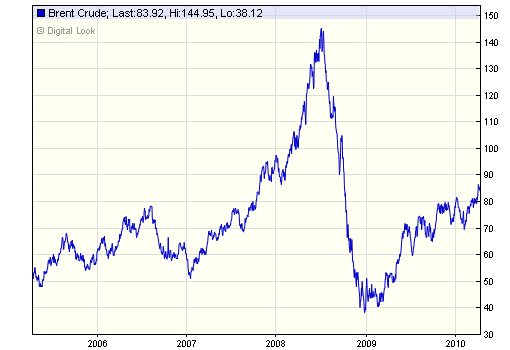
As this article points out, as expected, as oil prices have rebounded so has the resurgence in oil exploriation as oil rigs recently hit a 14-month high.
Given all of this, I chose to buy shares of Schlumberger (SLB) a company which according to the Yahoo Profile,
"...supply technology, integrated project management, and information solutions to the oil and gas industry worldwide. The company operates in two segments, Oilfield Services and WesternGeco. The Oilfield Services segment provides a range of exploration and production services required during the life of an oil and gas reservoir."
and
"The WesternGeco segment provides reservoir imaging, monitoring, and development services, as well as operates data processing centers, and multiclient seismic library. Its services range from 3D and time-lapse (4D) seismic surveys to multi-component surveys for delineating prospects and reservoir management. The company has a joint venture agreement with National Oilwell Varco, Incorporated to provide high speed drill string telemetry systems."
Schlumberger (SLB) will be announcing the latest quarter's results in just a few days on April 23, 2010.
On January 22, 2010, Schlumberger (SLB) announced 4th quarter 2009 results. Revenue came in at $5.74 billion, down from the $6.87 billion in revenue the prior year. Income from continuing operations decreased 34% to $.67/share vs. the $1.03/share the prior year. Sequentially both results improved but year-over-year results showed the effects of the slowdown in the oil exploration business in the midst of the recession.
This stock does not really fit into my usual strategy of buying the consistent growing company independent of cyclical economic events. However, as this economy rebounds it seems wise to participate in those sectors that are emerging from downturns---oil service appears to fit the bill.
In fact, Schlumberger has used the economic recession as an opportunity to expand its business through acquisition. Most recently it announced an acquision of IGEOSS, a "France-based provider of 'geomechanical solutions', acquired Nexus Geosciences, another seismic software and services company, and Geoservices for $1.07 billion from Astorg Partners, another French firm. Schlumberger, meanwhile, is still working on its acquisiton of Smith International, another oil service company which faces ongoing Justice Department review.
In terms of longer-term financial results, reviewing the Morningstar.com "5-Yr Restated" financials on SLB, we can see that revenue which grew rapidly from $14.3 billion in 2005, peaked at $27.2 billion in 2008, then dipped to $22.7 billion in 2009. Earnings grew rapidly from $1.82/share in 2005 to $4.45/share in 2008 only to also dip to $2.59/share in 2009. Dividends are paid regularly and grew from $.42/share in 2005 to $.84/share in 2008 where it was kept in 2009. Outstanding shares, which increased from 1.23 billion in 2005 to 1.24 billion in 2006, have been decreased with share buy-backs to 1.239 billion in 2007, 1.22 billion in 2008 and 1.21 billion in 2009.
Free cash flow has remained positive with $3.07 billion reported in 2007 and $2.92 billion in 2009. Morningstar shows that the balance sheet is solid with $243 billion in cash and $13.4 billion in other current assets. This is almost a 2:1 current ratio, and in fact current assets are nearly enough to cover both the $7.2 billion in current liabilities and the $7.1 billion in long-term liabilities combined.
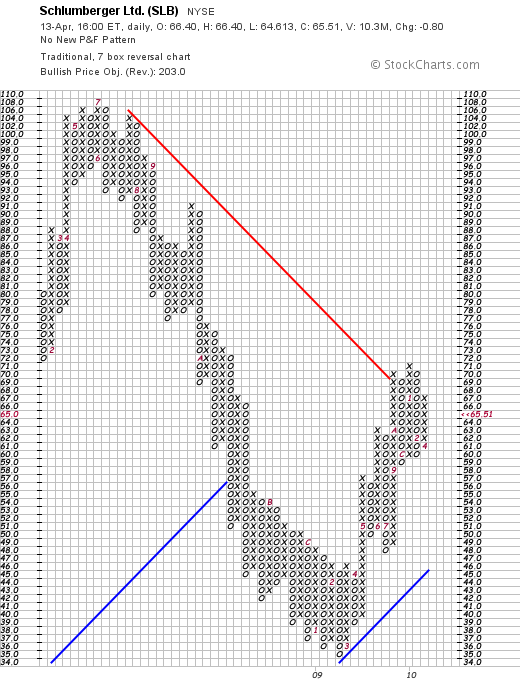
Reviewing the 'point & figure' chart on Schlumberger (SLB) from StockCharts.com, we can see that this stock peaked at approximately $108/share in July, 2008, before sharply selling off and hitting a recent low of $35/share in February, 2009. The stock has rebounded along with the rebound in oil prices, recently broke through resistance at its current level of $65.51. The stock clearly has reversed its downward slide and imho appears poised for further appreciation on the upside.
In terms of valuation, reviewing the "Key Statistics" on Schlumberger (SLB) from Yahoo, we can see that this is a large cap stock with a market capitalization of $78.39 billion. The trailing p/e is a moderate 25.31, but the forward p/e (fye 31-Dec-11) is estimated at 17.06. With the reasonably rapid growth in earnings, the p/e is more or less reasonable as measured by the PEG ratio at 1.56.
Yahoo reports 1.2 billion shares outstanding with 1.19 billion of them that float. As of 3/15/10 there were 44.28 million shares out short, but since the daily volume is a substantial 12.6 million shares (over the past 3 months), the short interest ratio works out to a moderate 2.6, under my own 3 day rule for significance.
The company, as noted above, does pay a dividend with a forward annual dividend rate of $.84/share yielding 1.3%. Schlumberger last split its stock April, 10, 2006, with a 2:1 stock split.
To summarize, my idiosyncratic trading system dictated that I add a new position to my trading account due to the "good news" generated by the partial sale of my holding of Sysco (SYY). Lacking any holding that reflected the new-found strength in the oil market along with the renewed economic recover, I chose a very large player in the oil service industry, Schlumberger (SLB) which appeared to be a relatively good value with good potential going forward.
Thank you for visiting my blog! If you have any comments or questions, please feel free to leave them right here or email me at bobsadviceforstocks@lycos.com.
Yours in investing,
Bob
Posted by bobsadviceforstocks at 10:02 PM CDT
|
Post Comment |
Permalink
Updated: Saturday, 17 April 2010 10:09 PM CDT
Sunday, 11 April 2010
Kohl's (KSS) "Revisiting a Stock Pick"
Hello Friends! Thanks so much for stopping by and visiting my blog, Stock Picks Bob's Advice! As always, please remember that I am an amateur investor, so please remember to consult with your professional investment advisers prior to making any investment decisions based on information on this website.
 I always enjoy writing about a Wisconsin firm that has become a big success in the national market. The first time I wrote up Kohl's (KSS) on this blog was back on August 12, 2006, when the stock was trading at $60.76. Kohl's stock has just now approached that level after the 2008 bear market that savaged so many stocks especially retail stocks that declined sharply in price when the consumer stopped buying.
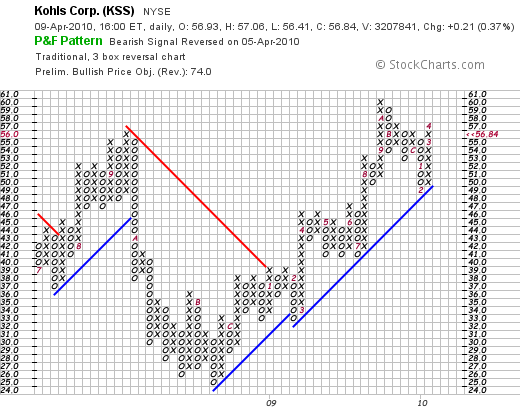
Kohl's (KSS) closed at $56.84 on April 9, 2010, up $.21 or .37% on the day. I believe this stock belongs in my blog and may eventually find a place in my portfolio. I currently do not own any shares.
 Kohl's Department Stores has a fascinating history that in some fashion parallels the story of Walmart. In 1962, the same year that Sam Walton was opening up his first discount store in Rogers, Arkansas, 563 miles North-East of that location Max Kohl was opening up his first deparment store, Kohl's Department Store in Brookfield, Wisconsin.
Kohl's Department stores has grown significantly since that first store. On March 3, 2010, Kohl's (KSS) announced plans to open nine stores in five states and 'plans to open a total of approximately 30 new stores in 2010.' As of the end of last month, Kohl's (KSS) had a total of 1,067 stores in 49 states. In comparison, Walmart has had an even more meteoric rise with currently more than 8,416 retail outlets 'operating under 53 different banners in 15 countries.'
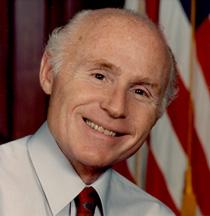 The other interesting fact about Kohl's (KSS) is the fact that Wisconsin's senior U.S. Senator is Herb Kohl, son of Max Kohl. Herb and his brother inherited Kohl's Department Stores. He later became President of Kohl's and was involved in its sale to BATUS Inc. in 1972. In 1985 Kohl purchased the Milwaukee Bucks and was first elected to the United States Senate in 1988.
In 1986 BATUS sold Kohl's Department Stores to a 'management-led group of investors.' At that time Kohl's had only 40 stores with sales of $300 million. In 1992, Kohl's (KSS) had their IPO with 11.1 million shares issued and Kohl's Department Store became a publicly traded corporation.
But more than an interesting story of a company that started off as a grocery store opened by a Polish immigrant, is the fact that Kohl's (KSS) remains a compelling investment today.
Kohl's (KSS) is participating in the powerful rebound in retail sales that we are currently experiencing as this nation recovers from recession. Most recently, on April 8, 2010, Kohl's reported that their March same-store sales increased 22.5%, beating expectations of a 12.4% same-store increase according to analysts polled by Thomson Reuters. In addition, the company in the same announcement raised guidance for the first quarter to $.55 to $.57/share up from previous estimate of $.48 to $.52/share in the quarter. This increased guidance exceeded estimates of $.54/share in the quarter that analysts are currently expecting.
Examining the latest quarterly result, the fourth quarter was reported on February 26, 2010. For the quarter ended January 30, 2010, earnings increased 28% to $431 million or $1.40/share from $336 milllion or $1.10/share the prior year. This beat expectations of $1.37/share according to analysts polled by Thomson Reuters. The company was quite cautious in that announcement and guided $.48 to $.52/share for the quarter under analysts expectations of $.54/share.
It is clear that with the increased sales activity at Kohl's stores the past two months, management has moved from a relatively gloomy outlook in February to a more positive outlook this month as noted from its recent raising of guidance on the back of strong same-store sales growth.
Longer-term, reviewing the Morningstar.com "5-Yr Restated" financials, we can see that revenue has grown steadily, except for a pause between 2008 to 2009, from $13.4 billion in 2006 to $17.2 billion in 2010. During this period earnings grew from $2.43/share in 2006 to $3.39/share in 2008 before dipping to $2.89/share in 2009 and then increasing to $3.23/share in 2010 fiscal year. No dividends are paid. Outstanding shares have decreased from 346 million in 2006 to 306 million in 2010.
Free cash flow which was a negative $(307) million in 2008, turned positive at $684 million in 2009 and grew to $1.5 billion positive in 2010.
Looking at the latest balance sheet, as reported by Morningstar.com, Kohl's (KSS) has $2.3 billion in cash, $3.2 billion in other current assets for a total of $5.4 billion in current assets when compared with the $2.4 billion in current liabilities has a healthy current ratio of 2.25. In fact, Kohl's could pay off ALL of its debt both current at $2.4 billion AND the $2.9 billion in long-term debt combined with its total of $5.4 billion in current assets!
In terms of valuation, Yahoo "Key Statistics" reports that Kohl's (KSS) has a market capitalization of $17.45 billion. The trailing p/e is a moderate 17.55 but the forward p/e (fye 30-Jan-2012) is more reasonable at 13.47, and looking forward, the PEG ratio at 1.18 suggests reasonable valuation as well. There are 306.97 million shares outstanding with 272.87 million that float. As of 3/15/10 there were 7.56 million shares out short representing 2.1 days of trading well below my own arbitrary 3 day rule for short interest significance. No dividends are paid and the last stock split was a 2:1 split back on April 25, 2000.
Reviewing the 'point & figure' chart on Kohl's (KSS) from StockCharts.com, we can see that the stock, which peaked at $57 in September, 2008, dipped as low as $25 in August, 2008. Since then the stock has been climbing steadily, hit $60 in October, 2009, dipped to $45 in February, 2010, only to climb once again above support lines to its current level just above $56/share.
To summarize, Kohl's is a uniquely American success story (as well as a Wisconsin success story) of a Polish immigrant starting with a single grocery store in the Milwaukee area, starting a department store in 1962 the same year Sam Walton was opening his own retail store, and growing it to a level where it was acquired, sold back to management, and then taken public where it grew to become a major retail player in the market today. Interestingly, the American success story also includes a currently sitting United States Senator, Herb Kohl, son of the founder of Kohl's and former president of the Department Store chain. Only in America!
Kohl's is experiencing a strong resurgence in sales as it successfully sells the 'middle level' of merchandise between a Macy's and a Target, offering value to a more cost-conscious consumer looking for both quality and value. They reported terrific same-store sales numbers last month which exceeded expectations, and raised guidance on the upcoming quarter. The last quarter exceeded expectations but was accompanied by a more reserved guidance from management. Things appear to be changing quickly for the better for this company.
I do not own any shares, but it is the kind of stock I like, may own in the future, and I believe represents an early recovery for retail and for the U.S. economy as a whole which appears to be slowly rebounding from its deep recession.
If you have any comments or questions, please feel free to leave them on the blog or you can email me at bobsadviceforstocks@lycos.com.
Yours in investing,
Bob
Saturday, 3 April 2010
My Experience on Covestor Investment Management (CVIM)
Hello Friends! Thanks so much for stopping by and visiting my blog, Stock Picks Bob's Advice! As always, please remember that I am an amateur investor, so please remember to consult with your professional investment advisers prior to making any investment decisions based on this website.
I cannot tell you how many times I have written and re-written that phrase about being an amateur investor here on this blog and elsewhere. I am. I love investing and writing about stocks and how I try to think about selecting stocks, deciding when and which stocks to buy and when and how much to be buying and selling when I do implement a transaction.
It is a blast and I thank you for each and every visit and all of your emails and comments that you have left on the blog both positive and critical of my thoughts and actions. I am certainly not always right.
 Back in 2007 I was approached about participating with an innovative organization called Covestor about sharing my actual trading portfolio with them and they would publish and track my results and transactions. Starting on June 12, 2007, almost 3 years ago, I have been tracked and followed by Covestor and you can see my Covestor page here. With this service, my trading portfolio became public, my activity and performance verified--both brilliant and quite less than brilliant trades were shared publicly.
I continued to refine my investment strategy aware that I was doing my investing publicly. It was a terrific relationship and continues to be useful for me as I refine my own approach to the tumultuous world of stock market investing.
 I am particularly grateful to Perry Blacher, the co-Founder of Covestor and the President of Covestor Investment Management, the asset-management side of Covestor. He, along with Rikki Tahta and Simon Veingard are the people who have been among those responsible for getting Covestor from just an idea into an important player in the new "social investing" websites. Perry and Covestor recruited me to participate and have stayed with me as this blog has grown and my investing and writing experience has evolved.
Covestor's business model has always been to actually manage money. On April 14, 2009, a year ago, I was invited to be one of the first ten model accounts that Covestor uses to create shadow accounts utilizing the trading and asset allocation information to allow them to manage money for actual investors. Since I am an amateur, I do not manage any investments but rather am paid a subscription fee for the data feed. This new expanded Covestor service is called Covestor Investment Management (CVIM) and you can see my CVIM page here.
 Participating in CVIM has made what I believe to be a responsible strategy of managing investments that much more serious for me. I like to say that I have started investing more like my father who while no longer alive has always been my largest source of inspiration to being involved in the stock market. I continue to look for stocks with revenue growth, earnings growth, solid balance sheets and reasonable valuation---but now find dividends more attractive than ever!
The last couple years, with my own portfolio declining along with all other investors as the market declined in our current 'bear market', I have been more interested in protecting against losses while still interested in capturing the gains of a climbing equities environment. I have added dividends to my list of attreactive features. Dividend stocks, as long as the dividends are secure, may offer an additional form of protection--in an environment of declining stocks, stocks that do not offer dividend merely offer the promise of greater value in the future. A dividend paying stock effectively becomes more attractive as the stock price declines reflecting the increasing dividend yield which is the result of the simple quotient of the stable dividend divided by the reduced stock price.
Furthermore, I have tried to think about stocks which are recession resistant. To that end, I have included stocks like Sysco (SYY), which while feeling a bit of the pinch of the recession, has managed to crank out continued revenue and earnings without interruption. TJ Maxx (TJX) where recession-pinched shoppers can find bargains in name brand products, McDonald's (TJX) where the price point remains a good value and which remains a place where even cash-strapped families can eat. Abbott (ABT) and Johnson & Johnson (JNJ) are two additional steady earners which pay steady and increasing dividends. Church & Dwight (CHD) has grown its results by selling a diverse set of consumer goods without being hurt too much by the economic downturn, AT&T (T) is the pre-eminent widows and orphans stock which has an interesting tie-in with Apple (AAPL) and pays a generous dividend, and 3M (MMM), the steady blue chip industrial finish out my holdings. I own the above stocks in my trading account.
I mention these stocks because my own participation in Covestor (CVIM) has created an increased sense of fiduciary responsibility for me. My own trading volume has decreased, my choice of investments is more sedate---in a word, I feel like I have finally 'grown up'! Things I suppose could be worse. Like falling from the Neverland world of quick trades for fractions of points into the world of grown ups concerned about dividends, tax consequenses, and recession-resistance of the holding, I believe that my participation with Covestor has been good for me and for the people that read my blog.
I do not in any way manage investments for people. But I am aware that what I write about and what I do invest in may result in others doing the same. I cannot promise that I shall do this without failure. I cannot even know that I shall be profitable. But I am glad of the relationship that has resulted in these changes.
Thank you Perry and all of my great friends over at Covestor!
Yours in investing,
Bob
Wednesday, 31 March 2010
The Hershey Company (HSY)
Hello Friends! Thanks so much for stopping by and visiting my blog, Stock Picks Bob's Advice! As always please remember that I am an amateur investor, so please remember to consult with your professional investment advisers prior to making any investment decisions based on this website.
 Over the nearly seven years of blogging on this website, I have continued to focus on those stocks that I believed deserved inclusion on this blog and possibly inclusion in my portfolio. Until recently, I could depend on momentum investments, identifying companies that could generate greater and greater earnings on increasing revenue while hitting new highs in the market.
Those kind of stocks are difficult to identify although I continue to look for this same pattern of financial results.
More recently I have shifted my holdings into more of a 'widows and orphans' investing approach, looking for value in investing, looking for stocks with growth potential yet showing reasonable valuation (GARP investing) and searching for stocks that might also pay a dividend. In short, as each year passes, I find that I am investing more and more like my father did, looking at dividends, stable and well-recognized names of stocks and their products and enjoying the relative lack of volatility that these 'quality' companies provided.
It is amazing what a good bear market can do to an investor's perspective!
I believe that The Hershey Company (HSY) fits my requirements and I wanted to share with you some of the things that make me believe it may well be a timely and attractive investment at this particular time. Hershey (HSC) closed today (3/31/10) at $42.81, down $(.24) or (.56)% on the day. I do not own any shares of this company at this time.
 While Hershey (HSC) is well-known for its chocolate it has a wider range of products. As the Yahoo "Profile" on Hershey explains, the company
"...offers chocolate and confectionery products, including high-cacao dark chocolate products, such as chocolate bars, tasting squares, home baking products, and professional chocolate and cocoa items; and natural and organic chocolate products consisting of chocolate bars, drinking chocolate, and baking products. The company provides snack products comprising snack mix, granola bars, and macadamia snack nuts and cookies in various varieties; and a line of refreshment products, such as mints, chewing gum, and bubble gum, as well as pantry items consisting of baking ingredients, toppings, and beverages."
Recently Kraft (KFT) purchased Hershey competitor Cadbury for $19.5 billion, making Kraft the world's largest chocolate producer. While Hershey remains the dominant producer of chocolate in North America, this merger may be challenging as Hershey's continues to seek global sales growth.
On February 2, 2010, The Hershey Company (HSY) reported 4th quarter results. After removing one-time charges, the company reported that earnings for the period ended December 31, 2009, came in at $.63/share. This was ahead of expectations of $.60/share of analysts polled by Thomson Reuters. Sales for the quarter increased 2% to $1.41 billion, slightly under expectations of $1.42 billion in revenue by analysts.
For the full year, profits came in at $436 million or $1.90/share, nicely ahead of the prior year's $311.4 million or $1.36/share. Full-year sales also grew 3% to $5.3 billion from $5.13 billion.
They announced expectations the profit should grow 6 to 8% and that sales were anticipated to increase 3-5%. This worked out to an earnings range of $2.30 to $2.34/share ahead of analysts current expectations of $2.28/share. Revenue guidance was essentially in line with the analysts' expectations.
The company also went ahead and raised its quarterly dividend by 2.25 cents to 32 cents.
Looking at Morningstar.com for the "5-Yr Restated" financials on HSY, we can see that revenue has slowly grown from $4.8 billion in 2005 to $5.3 billionin 2009. Earnings have been erratic during this period, increasing from $1.97/share in 2005 to $.2.34/share in 2006. However, after dipping to $.93/share in 2007, they have steadily increased to $1.36/share in 2008 and $1.90/share in 2009.
Outstanding shares have decreased from 248 million in 2005 to 229 million in 2009 as the company retired shares with buy-backs.
Free cash flow after dipping from $589 million in 2007 to $257 million in 2008 has also rebounded strongly in 2009 to $939 million. The balance sheet appears adequately solid with $254 million in cash and $1,132 million in other current assets. This total of $1,386 million, when compared to the $910.6 million in current liabilities yields a healthy current ratio of 1.52.
Looking at valuation, using the Yahoo "Key Statistics" on HSY, we can see that this is a large cap stock with a market capitalization of $9.76 billion. The trailing p/e is a tad rich at 22.48 with a forward p/e (fye 31-Dec-11) estimated at 17.26. With the previously noted single-digit growth rate in earnings estimated by Hershey management, this results in a PEG ratio of 2.86, a bit rich by my standards as I prefer to invest in companies with PEG's between 1.0 and 1.5.
Yahoo reports that the company has 227.9 million shares outstanding with 227.6 million that float. The company trades an average volume of 1.9 million shares. With 5.93 million shares out short as of 3/15/09, this works out to a short interest ratio of 3.3 a bit higher than my arbitrary '3 day rule' for significance.
The company pays a nice dividend of $1.28 (going forward), with a forward annual dividend yield of 3.0%. The company does pay a good chunk of its earnings on its dividend with a payout ratio of 63%. The last stock split was a 2:1 split in June, 2004.
Examining the 'Point & Figure' chart on HSY from StockCharts.com, we can see that the company has really been trading sideways since dipping from $51 to a low of $31 in January, 2008. Recently, the stock appears to be technically breaking through resistance and slogging higher with higher lows and higher highs over the short-term.

In summary, They Hershey Company represents a company with core confectionary brands that are identifiable and well-respected in the United States and in a lesser fashion worldwide. The stock has found support at the $30-$31 level where it has traded for the past two years and only in the past six months has the price started to move higher. While not cheap in terms of absolute p/e or PEG analysis, the company does pay a solid dividend of 3% and has also managed to regularly raise that dividend over the past five years and longer. Recent earnings have been reasonably strong, the company has a growing free cash flow and a solid balance sheet.
This company may just be the sweet investment that I have been looking for! And that doesn't even count the many health benefits of chocolate!
In my own trading account I am still looking for solid companies with well-recognized products or services and appreciate receiving a dividend that has a track record of regularly being raised.
Thanks again for stopping by and visiting! If you have any comments or questions, please feel free to leave them on the blog or email me at bobsadviceforstocks@lycos.com.
Yours in investing,
Bob
Thursday, 11 March 2010
Walgreen (WAG) and Abbott Laboratories (ABT) "Trading Transparency"
Hello Friends! Thanks so much for stopping by and visiting my blog, Stock Picks Bob's Advice! As always, please remember that I am an amateur investor, so please remember to consult with your professional investment advisers prior to making any investment decisions based on information on this website.
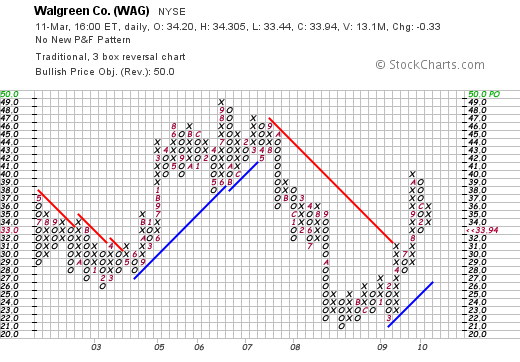
 As part of this blog, I try to share with you my actual trades in my 'Trading Account' and let you know why I made this trade and what I did with the proceeds. Earlier today I sold my position in Walgreen (WAG) and purchased shares in Abbott Laboratories (ABT) in an approximately equal amount. Specifically, I sold my 66 shares of Walgreen (WAG) at $33.71 and purchased 45 shares of Abbott Laboratories (ABT) at $55.37.Walgreen (WAG) closed at $33.94, down $.33 or (.96)% on the day.
My shares in Walgreen were purchased almost exactly a year ago on 3/27/09 at a cost basis of $26.73 so I actually had a gain of $6.98 or 26.1% since purchase. I had actually originally purchased 77 shares but had already sold 11 shares 9/23/09 when the stock hit a price of $34.75 and I had a realized gain of $8.02 or 30% since purchase. My sale today was not based on any appreciation or decline to any specified indicated sale level but rather on my own assessment that Walgreen is currently facing some challenges that may for the short-term hold back the performance of this stock while still believing in the long-term potential of Walgreen in general.
Perhaps my first concern with Walgreen's was in December when they reported that November, 2009 sales while up 8.7%, comparable store sales came in at 3.9% under expectations of 6.1%. On January 6th, 2010, WAG reported their retail numbers and again disappointed with same-store sales declining 0.5% missing expectations again. Proving that this wasn't an isolated set of reports, Walgreen on February 3, 2010, reported that January same-store sales dipped 1.1%. Last week on March 3, 2010, Walgreen did report positive same store sales growth but did report a relatively anemic 0.4% increase again under the 0.5% sales increase expected.
With Duane Reade reporting a loss yesterday, and the impending acquisition by WAG anticipated to close in the next few months and the stock acting weak when other shares were moving higher, my patience was tried to its limit, and I pulled the plug on my Walgreen shares looking for another stock to replace it with.
Quite frankly, if we examine the point and figure chart on WAG, the chart doesn't look like it has truly broken down although it is off from its recent high of $41, it is still trading well above support levels down at the $26 level. I chose to sell this stock due to the above-mentioned retail challenges although I am still a big fan of this company and look forward to a possibly repurchase of these shares in the future.
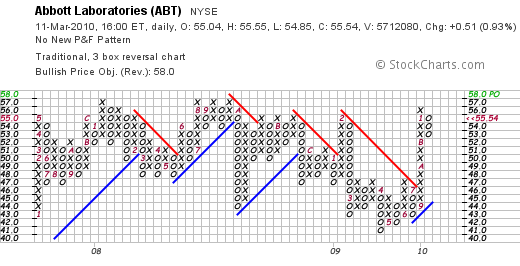
Let's take a closer look at Abbott Laboratories (ABT) and I shall try to explain why I felt more comfortable with this position in my portfolio as opposed to staying with my holding in Walgreen (WAG). ABT closed today (3/11/10) at $55.54, up $.51 or .93% on the day.
According to the Yahoo "Profile" on Abbott, the company
"...engages in the discovery, development, manufacture, and sale of health care products worldwide. It operates in four segments: Pharmaceutical Products, Diagnostic Products, Nutritional Products, and Vascular Products."
If we take a look at their latest quarterly result, Abbott (ABT) reported their fourth-quarter results on January 27, 2010. Their earnings were flat at $1.536 billion or $.98/share compared with $1.536 billion or $.98/share th eprior year. Excluding accounting items, Abbott came in with adjusted earnings of $1.18 vs. $1.06 last year and sales rose 10.6% to $8.79 billion. This was slightly ahead of estimates of $1.17/share on revenue of $8.59 billion.
Reviewing the Morningstar.com "5-Yr Restated" financials on Abbott, we can see that revenue has climbed steadily from $22.3 billion in 2005 to $30.8 billion in 2009. Earnings, after dipping from $2.16/share in 2005 to $1.12/share in 2006, have since climbed steadily to $2.31/share in 2007 and $3.69/share in 2009. Dividends have been increased annually to $1.56/share in 2009 up from $1.09/share in 2005. During this same period, ABT has kept outstanding shares rather stable with 1.56 billion shares in 2005 and 1.55 billion shares in 2009.
Free cash flow has been positive and growing from $3.5 billion in 2007 to $6.2 billion in 2009. The balance sheet also appears solid with $8.8 billion in cash, $14.5 billion in other current assets, and $13.1 billion in current liabilities. This yields a current ratio of 1.79. Abbott does have $16.5 billion in long-term liabilities.
In terms of valuation, looking at Yahoo "Key Statistics" on Abbott, we can see that this is a large cap stock with a market capitalization of $86.23 billion. The trailing p/e is a moderate 15.13 with a forward p/e (fye 31-Dec-11) of 11.64. Thus, the PEG ratio comes in at a very nice 1.12.
Abbott has 1.55 billion shares outstanding with 1.5 billion that float. As of 2/26/10 there were 8.97 million shares out short with a short ratio of only 1.2 (well under my own arbitrary 3 day rule for significance.) Abbott has a forward annual dividend rate of $1.76/share with a forward dividend yield of 3.2%. With a payout ratio of 42%, this dividend appears quite secure. In fact, Abbott is a regular dividend grower and increased its dividend 10% as reported on February 19th.
Examining the "point & figure" chart for Abbott on StockCharts.com, we can see that the stock has really been traveling sideways for the past two years between $41 and $57. Hopefully my purchase will not be at the upper range of a continued trading channel and we shall see Abbott move higher breaking through resistance at $57. In any case, the stock is certainly not over-extended. On the other hand, from my amateur perspective, the stock has not 'broken-out' yet to a higher level.
Looking at the Standard & Poor's Stock Report dated 3/10/10 on ABT, (available to me through my Fidelity account), there is a discussion of S&P's estimate of $33 billion of revenue in 2010 vs. $30.8 billion in 2009. The company is in the midst of a purchase of the Solvay Group. The company also just announced a purchase of Facet Biotech with a 67% premium over the market price. This acquisition extends its drug 'pipeline' with treatments for Multiple Sclerosis. This company is making waves on multiple fronts including announcing yesterday approval of the one-pice Tecnis multifocal intraocular lens implant for cataract patients.
In any case, in this market that is subject to the vagaries of an economy that is far from back to normal, I chose to switch from Walgreen to Abbott. With double the yield, a similar p/e, and what appears to be a more stable stock price, I hope that this decision will work out well for me and for my portfolio. Both companies are great growth stock stories and I could not fault anyone for staying tight with Walgreen. For the time being, I chose to make the switch. Wish me well.
If you have any comments or questions, please feel free to leave them on the blog or email me at bobsadviceforstocks@lycos.com.
Yours in investing,
Bob
Saturday, 6 February 2010
ResMed (RMD) "An Update on a Recent Stock Pick"
Hello Friends! Thanks so much for stopping by and visiting my blog, Stock Picks Bob's Advice! As always, please remember that I am an amateur investor, so please remember to consult with your professional investment advisers prior to making any investment decisions based on information on this website.
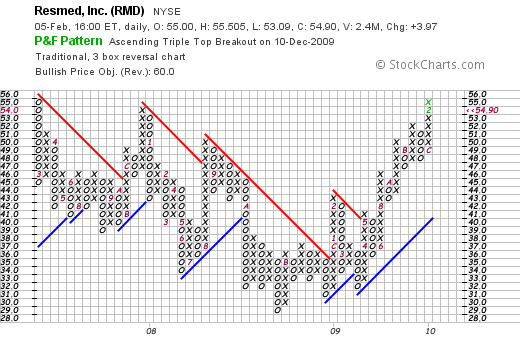
 In the midst of the recent market correction, there was a stand-out that defied the market decline, and moved strongly higher closing at $54.90, up $3.97 to close at $54.90 on the back of good news. That company was ResMed (RMD) an 'old favorite' that I recently reviewed on September 20, 2009. I do not own any shares of ResMed but it still is the kind of stock that belongs in my portfolio and certainly on this blog.
On February 4, 2009, after the close of trading, ResMed (RMD) announced results for the quarter ended December 31, 2009. For the quarter, ResMed came in with revenue of $275.1 million 23% higher than the prior year, exceeding analysts' expectations of $259 million. Earnings came in $46 million or $.60/share in the quarter up from $33.9 million or $.44/share the prior year and again exceeding expectations of $.55/share according to Thomson Reuters I/B/E/S.
Wells Fargo responded by upgrading its own assessment of the stock's prospects to "Market Perform" from "Underperform".
I have briefly discussed sleep apnea in my previous entry, needless to say it is widely diagnosed, associated with the much-discussed obesity epidemic, and can be successfully treated with positive airway pressure. For a more detailed review, you may wish to read this Mayo Clinic review of the subject.
ResMed (RMD) is far from a 'one-quarter-wonder'! If we revisit the Morningstar.com "5-Yr Restated" financials from Morningstar.com, we can see that the company has consistently grown its revenue from $426 million in 2005 to $921 million in 2009 and $1.002 billion in the trailing twelve months (TTM). Earnings have steadily improved (except for a dip between 2006 and 2007, from $.91/share in 2005 to $1.90/share in 2009 and $2.24/share in the TTM. No dividends have been paid. Outstanding shares have been stable at 75 million in 2005 increasing to 79 million in 2008 and then decreasing back to 77 million in the TTM.
Free cash flow has grown from $14 million in 2007 to $129 million in 2009 and slightly less at $114 million in the TTM. The balance sheet presented on Morningstar.com is exceptionally strong with the $451 million in cash reported enough not only to pay off the current liabilities of $240.6 million but also the $123.1 million in long-term liabilities as well! The company has an additional $476 million of other current assets beyond the cash on hand.
According to Yahoo "Key Statistics", RMD has a trailing p/e of 26.34 and has a forward p/e (fye 30-Jun-11) of 20.11. With the rapid growth anticipated the PEG comes in at an acceptable 1.34 level. The market cap is $4.12 billion. There are 74.96 million shares outstanding with 69.69 million that float. As of 1/15/10 there were 5.9 million shares out short representing 12 trading days of volume (the short interest ratio), above my own arbitrary '3 day rule' for short-interest significance and suggesting the possibility of some short-covering in yesterday's sharp price appreciation in the face of good news. The fact of a lot of shares out short is quite bullish in a stock like ResMed that reports results exceeding expectations.
Examining the 'point and figure' chart on ResMed from StockCharts.com, we can see that the stock, which traded as low as $29 in October, 2008, has convincingly broken through resistance and is moving strongly higher at its current level which is higher than the $54-55 level hit in March, 2007, and again in December, 2007, before joining the correction that drove down most stocks in the market.
In summary, I too am kicking myself about why I didn't choose to add this stock to my own trading portfolio. Frankly, I have been quite anxious about the market and have been selecting larger dividend-paying stocks with the hope that I could avoid some of the downward pressures in the market. A stock like ResMed (RMD) demonstrates once again that while dividends are helpful, it is wise to emphasize earnings, revenue growth, and financial stability while understanding the product in a Peter Lynch fashion isn't a bad idea either!
Thanks again for visiting my blog! If you have any comments or questions, please feel free to leave them right here on the website or email me at bobsadviceforstocks@lycos.com.
Yours in investing,
Bob
Wednesday, 3 February 2010
Walgreen (WAG) "Is the Sky Falling?"
Hello Friends! Thanks so much for stopping by and visiting my blog, Stock Picks Bob's Advice! As always, please remember that I am an amateur investor, so please remember to consult with your professional investment advisers prior to making any investment decisions based on information on this website.
Earlier today I watched in morbid fascination as my shares of Walgreen Co (WAG) plunged from $36.00 at the open to close at $34.62 on the close, down $2.16 or (5.87)% on the day. It was enough to make me feel like traveling down to my local drug store and loading up on a shipment of antacids.
Walgreen (WAG) is one of the eight positions in my Trading Account, having purchased 77 shares on 3/27/09, almost a year ago at a cost basis of $26.73/share. I actually sold 1/7th of my holding, 11 shares, on 9/23/09 after the stock hit approximately $33.75 representing a 30% appreciation on my original shares. Without a disgressionary sale, my own trading system would give me a sale signal should WAG return to my original cost or $26.73 a share, a level considerably lower from its closing price. Today I chose to ride through this sell-off although I certainly came close to pulling the plug on this stock during the day.
Let's take a closer look at what drove the stock price lower. As the market opened Walgreen announced that January sales came in at $5.36 billion, a 2.7% increase over the $5.22 billion for the same month in 2009. However, sales in comparable stores open for the full year, so called "same-store sales", a more reliable retail figure, decreased (1.1)%. The company pointed out that the calendar itself had a negative effect on this figure as this January had one less Thursday and one more Sunday compared to January, 2009.
Overall pharmacy sales increased 1.6% but the same-store pharmacy numbers decreased (1.2)%. Similarly, so-called front-end sales (non-pharmacy), while overall showing an increase of 3.9% showed a decrease of (1.0)% when same-store figures were considered. Other factors attributed to this decline included a large number of generic sales as well as simply less illness in terms of decreased flu cases in 2010 compared to January, 2009.
As is often the case, while the drop in same-store sales wasn't really precipitous and could be explained through different observations, the fact remained that analysts had been expecting instead of a decline of (1.1)%, an increase of 3.2% according to Thomson Reuters. Certainly this 'disappointment' in sales results accounted for the plunge as the street was caught proverbially 'off-guard' and investors dumped shares of Walgreen in a day in which the market itself was performing in an anemic fashion with the Dow dipping 26.30 today to 10,270.55, and S&P dipping 6.04 or (.55)% to 1,097.28.
On January 28, 2009, Rite Aid (RAD), a competitor to WAG reported a decrease in same store sales of (2.1)%. Not only did Rite Aid attribute a drop in sales to increasing generics, unlike WAG, RAD reported a dip of (1.1)% in total prescriptions. Walgreen actually reported an increase of 2.7% in the number of prescriptions filled. CVS, another competitor does not report monthly sales figures.
Probably of equal impact to the January, 2009 sales numbers was the fact that December figure also disappointed when they reported a 0.3% drop in same store sales. Also that month, the 'street' had been expecting a 2.3% increase in sales. Thus even Walgreen (WAG) is subject to the continuing contraction in consumer spending after a United States record decline in 2009 of 6.2% in retail sales according to government records that track back to 1992. If you subscribe to the cockroach theory of financial news, two months does not truly make a trend, but a holder of shares might well be concerned that the next several months will continue to be challenges for Walgreen to get back onto its usual record of steady growth, although I am sure that expectations even now are being reduced by analysts.
And I had hoped that WAG would continue to resist this decline.
Walgreen (WAG) continues to work to restructure its marketing with new inclusions of fresh food, bringing back beer & wine to its stores after deleting this items more than ten years ago, and a generally more conservative expansion plan with few future store openings to save $500 million in 2011 in capital expenditures.
Last month, the company declared that the company should emerge from the downturn in 'an even stronger position'. I shall be patient as my small sale at my 30% appreciation level allows me to tolerate more price volatility within my own investment approach. Hopefully, Gary Kaminsky from "Fast Money" will be on the money and this pullback will be a buying opportunity. As he stated this evening: "I think it's a stock you want to own long term." As an owner of shares, I hope that Gary is right!
As always, if you have any comments or questions, you can reach me at bobsadviceforstocks@lycos.com.
Yours in investing,
Bob
Newer | Latest | Older


