Stock Picks Bob's Advice
Sunday, 23 January 2022
Fits and Starts and Retirement
Hello Friends! Thanks so much for stopping by and visiting my blog, Stock Picks Bob's Advice! As always please remember that I am an amateur investor, so please remember to consult with your professional investment advisors prior to making any investment decisions based on information on this website.
The market has been terribly volatile and in a funk to sayl the least. Indices are down and the bullish tenor of the investment world is quite diminished. To say the least. My own personal holdings, as I am sure yours, are well below their peak value. This is to be expected as the market cannot go forever in one direction. All we can be certain of beyond our own sure mortality, is that values move up and down. It does seem that in the long run, prices trend higher.
I would like to restart my blogging here. I do not know if I have any hanger-ons from my prodigious effort at blogging some years back. A couple of times I have tried to jump back in and then again I have gotten distracted and haven't. I miss the discussion of investing this allows and I very much enjoy sharing my own philosophy and even my own occasional political views right here on the blog. As always you are entitled to disagree, to suggest other thoughts or critiques of investing or politics and enter into the discussion. All the more power to you.
This entry is not about any particular stock at this time. We shall look at individual stocks soon. This is about limiting losses. Something I have really accepted after reading many different investment texts and certainly being very convinced by William O'Neil and his CANSLIM approach, is that the first rule of investing is to limit your losses.
For O'Neil (of IBD fame), an 8% loss is his limit after an initial purchase. This is all well and good and I accept that. But the problem arises after selling is 'what to do with the proceeds?'. Should one re-invest into something else? And when? For there is no point in taking a loss only to buy another different equity and to lose once again. For through that strategy one is literally compounding their losses and not limiting at all.
Somehow there needs to be more effort at sitting on one's hands with the proceeds of a stock in which you have taken a loss. I don't have a good method although in the past I have suggested that appreciation of a holding and a partial sale with a gain could be such a signal.
But I haven't generally employed that method although I have written about it in the blog. I do sell stocks with very limited losses. My cash component does go up in my own portfolio. And I do look to buy 'value' stocks that have been neglected or underperforming in these periods.
I did say I wouldn't mention stocks but I do have to tell you that I purchased some shares of Newell (NWL), and also ATT (T) recently both being what I woulsd call 'value' investments. Not sure if that will work, but I will let you know.
Anyhow, this shall be a short entry. I wanted to let you know that I am back at the wheel and while a bit rusty, getting ready to post some more entries especially in light of this tumultuous market.
Yours in investing,
Bob
Wednesday, 4 December 2019
Can we get this Blog Restarted? Or, thoughts about a Stock Club.
Hello Friends! Thanks so much for stopping by and visiting my blog, Stock Picks Bob's Advice! As always, please remember that I am an amateur investor, so please consult with your own investment advisors prior to making any investment decisions based on information on this website.
I have almost disappeared from the blogging world.
Almost, but not quite :).
I still love investing, love thinking about stocks and am perpetually working at the Holy Grail of investing, 'how to pick a stock' for investing that ends up being profitable. I guess that's what it is all about.
I wanted to talk a little generally about investing and the Stock Club "Investnuts" that I have mentioned previously and that I have been a member for many years. As you might guess, I am a bit passionate at meetings and sometimes I am likely downright intolerable. Yes I confess, yours truly can be intolerable sometimes. Not that I am not a nice guy but still.....
The 8 or 9 of us get together each month and with the help of George, our Treasurer, who does a real outstanding job of reporting the holdings, and our financial status, we go through our stocks in our portfolio and decide about selling a part of all of each holding---with rules I will discuss in a bit. And we entertain new names for consideration.
I guess that is what most stock clubs do lol.
I have been a member for about 22 years now---the club has been in existence for a few years before I joined. We all kick in $100/month and over the years we have had a good time which should be the major reason for having a club. Getting together, shooting the 'bull' as we say, and thinking about a rational approach to investing.
As I have discussed elsewhere, I have been greatly influenced by one of the greatest writers (IMHO) about investing William O'Neil, the publisher of my favorite newspaper the Investor's Business Daily, and author of another of my favorite books, How to Make Money in Stocks.
I like to joke that I have a simple stock profile that I like, one with a chart that is 'lower on the left and higher on the right'!
But seriously, when one puts together a portfolio of stocks, one needs to 'manage' the portfolio. If I am to continue my comparison schtick, then I would say we need to think of our portfolio like a horse race investor with a herd of horses. We need to concentrate on owning the horses that win races and sell (or send off to pasture) the horses that falter, that do not perform like we would like.
O'Neil likes to compare it to putting together a garden, pull the weeds not the flowers.
I get it. Most investors I suspect don't.
None of us are that smart. We make mistakes. Often many mistakes. But what distinguishes a winning strategy in investing is the ability to recognize your mistakes.
The stock market makes it very easy to recognize mistakes. Investments that lose money for you are mistakes. Investments that appreciate in price are successes.
It really is that simple.
What is so difficult is implementing that strategy.
Start off by realizing that success in investing is purchasing shares at a given price and seeing them go to a higher price sometime in the future. Success isn't being smarter than everyone and seeing the potential in a stock that you have purchased and had the price decline because you are smarter and know that eventually the price will rise showing how smart you really were and besides you haven't lost money until you actually sell shares.
I have believed all of those things in the past.
Being smart is having a limit of your tolerance for losses. For O'Neill and the CANSLIM strategy that he advocates for and that has become integrated into my own thinking more or less, an 8% loss or decline in a stock price after a purchase is enough to trigger a sale. Sometimes I use a dollar amount like $100 and if I lose that much (usually on about a $2500 or $3000 purchase) I part ways with that stock.
The most important things is to limit your losses so that bad purchase decisions don't go from small errors to major catastrophes.
Save your capital for another purchase.
If the entire market is in a correction, then pause before re-investing those proceeds. You certainly don't want to compound your losses in a declining market.
Because as O'Neil points out (no I don't get paid by the O'Neil company---I am just a big fan of rational investment strategy)--the Market (the M in CANSLIM) determines a big portion of the stock price movement of all shares. Like the sea that moves ships up and down with the tide--virtually all shares move either higher or lower based on the overall market.
Gosh I have already written a lot and I have hardly gotten into this subject. Please let me know if I am boring any of you but clearly after not blogging for quite awhile, I have a lot to say and share with all of you. (are there readers out there who are interested what I have to say I wonder?)
So we sell our losing stocks quickly.
And what about our gaining stocks? In our stock club when we first purchase shares we sort of dip our toes in the water making about a 1/4th sized investment in a new idea. We really try to have that stock essentially prove itself before making it a full-size holding.
How do we do that?
Generally we try to let the stock appreciate a given percent. Sometimes about 10 or 15% to the upside before we decide that it is a good idea and then commit funds to bring it up to a full position.
What is our 'full position' size? It used to literally be $10,000---over the years the size of our whole portfolio has grown and we now consider $20,000 to be a full position. Of course if your portfolio, or your stock club's portfolio, is smaller or larger that position would be a different $ amount. You see that a full position for us has nothing to do with the number of shares but the value of that holding.
I hope you are still with me.
We have chosen to sell portions of our holdings, maybe about 1/6th of a holding, when a stock appreciates about 30%. Then another 1/6th if it appreciates 20% or so above that and so on. Our holdings do grow in absolute size, but we like to think about our holdings as almost a fruit tree or similar that we can harvest a little many times over if we are lucky over time.
So far we have been lucky!
I do think this entry has dragged on long enough. I will write next about stock selection borrowing heavily from William O'Neil and some of my own observations from my own many years of investing experience.
Thank you for visiting again. I hope in the months ahead to invigorate my writings here and please leave any of your comments or questions in the comment section.
Yours in investing,
Bob
Sunday, 26 August 2018
Nanometrics (NANO)
Hello Friends! Thanks so much for stopping by and visiting my blog, Stock Picks Bob's Advice! As always, please remember that I am an amateur investor, so please remember to consult with your professional investment advisers prior to making any investment decisions based on information on this website.
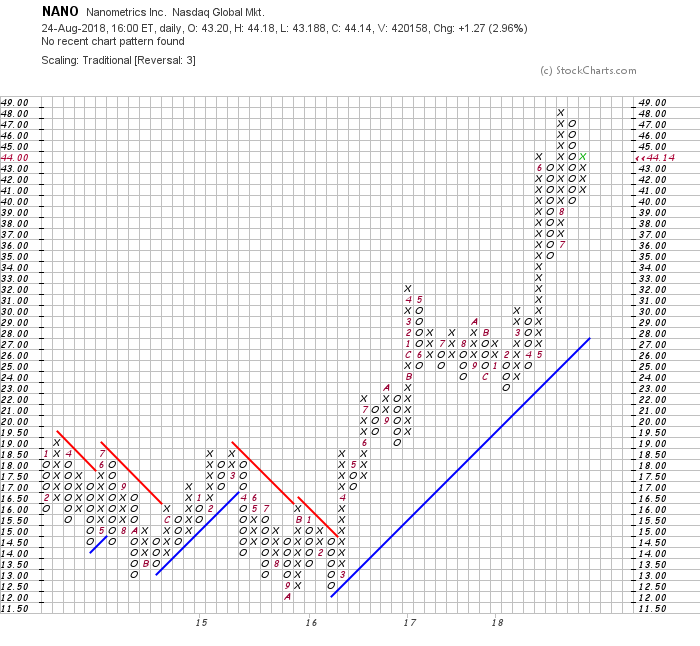
I wanted to share with an idea that I came across today reading the Investor's Business Daily IBD50 rankings. Nanometrics (NANO) has some of the features that I utilize in my own investing and also on this blog. At this time, I do not own any shares of NANO. For the record, NANO closed at $44.14 on August 24, 2018, up $1.27 or 2.96% on the day.
NANO was ranked #11 on the '50' today (Week of August 27, 2018). According to the IBD, NANO has 22.4 million shares outstanding and ranks on the IBD as a '95' composite rating with a 99 earnings per share rating and a relative strength of 94.
According to the Yahoo "Profile" on Nanometrics, the company
"...provides process control metrology and inspection systems for use primarily in the fabrication of semiconductors and other solid-state devices worldwide. It offers automated metrology systems that provide optical critical dimension, thin film metrology, and wafer stress for transistor and interconnect metrology applications; and integrated metrology systems that are installed onto wafer processing equipment to provide near real-time measurements. The company's materials characterization products include systems that are used to monitor the physical, optical, electrical, and material characteristics of discrete electronic industry, opto-electronic, high brightness LED, solar photovoltaic, compound semiconductor, strained silicon, and silicon-on-insulator devices, including composition, crystal structure, layer thickness, dopant concentration, contamination, and electron mobility."
To put it simpler, Nanometrics is listed in the 'Semiconductor Equipment & Materials' Industry.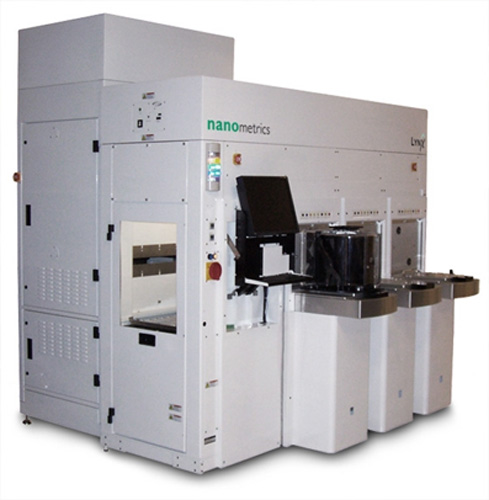
On July 31, 2018, Nanometrics reported their 2nd quarter results:
Earnings for the quarter came in at $.72/share, beating Zacks average of three analysts who were expecting $.66/share. Revenue for the quarter came in at $88.6 million ahead of the $86.2 million expected by analysts.
Revenue growth was up sequentially from the prior quarter by 8% and year over year an increase of 38%. Earnings per share of $.72 was up from the $.67 the prior quarter and up over 100% from the $.32 reported in the second quarter of 2017.
Longer-term, reviewing Morningstar.com on NANO, we can see that the company has a beautiful revenue ramp from 2013 when revenue was $144 million, this increased to $166 mil in 2014, $187 mil in 2015, $221 mil in 2016 and $259 mil in 2017. In the trailing 12 months, NANO has reported $306 million in revenue.
Earnings, while strong recently have been more erratic with $(.61)/share reported in 2013, dipping to $(1.30)/share loss in 2014, turning profitable at $.12/share in 2015, up to $1.75 in 2016, dipping back to $1.17 in 2017 but increasing strongly to $2.03 in the TTM.
The Morningstar.com balance sheet shows that Total current assets stand at $240 million as of 12/2017 with total current liabilities of $44 million. This works out to a very healthy current ratio of 5.45.
In terms of Free cash flow, NANO reported $15 million in 2017 and now has reported $64 million in the TTM.
What about valuation?
According to the Yahoo "Statistics" on Nanometrics, the company has a market cap of $1.07 billion making it a small cap stock. The trailing P/E is a modest 21.98 (for this type of growth stock) with a forward P/E of only 17.73. The PEG ratio, a better measure of valuation for growth stocks, comes in at a reasonable (imho) 1.55. The Short Ratio is rather high at 6.32 suggesting either there are a lot of people out there a lot smarter than I am speculating that this stock is going to fall, or perhaps the stocks is being set up for a 'short squeeze' as short-sellers are forced to buy shares to cover their 'pre-sold' positions---amore bullish scenario.
And what about the chart?
If we look at the Nanometrics 'point and figure' chart from StockCharts.com, we can see a strong technical appearance since March, 2016, when the chart broke through the resistance level at $14.50 and soared to the current level of $44.14.
To summarize, NANO appeared in the IBD50 list today. Scanning across the list what attracted me initially was the strong chart, the reasonable valuation with big numbers for revenue and earnings growth. Further review shows that the company has a solid balance sheet, is generating increasing amounts of free cash flow, exceeded expectations on both revenue and earnings growth the latest quarter and even has a whole bunch of short-sellers seemingly headed for a 'squeeze'. In addition, they have an revenue ramp of multiple years of steady growth although the earnings has been actually a bit more inconsistent.
I do not own any shares, but this is my kind of stock and if I were looking or decide to buy a stock I might start here. Always remember to limit losses and consult with your own professional investment advisers instead of this amateur stock observer that you have with me!
It is nice to be back blogging. Sorry for the absence. Hope to blog again soon.
Yours in investing,
Bob
Posted by bobsadviceforstocks at 7:48 PM CDT
|
Post Comment |
Permalink
Updated: Sunday, 26 August 2018 8:29 PM CDT
Saturday, 16 September 2017
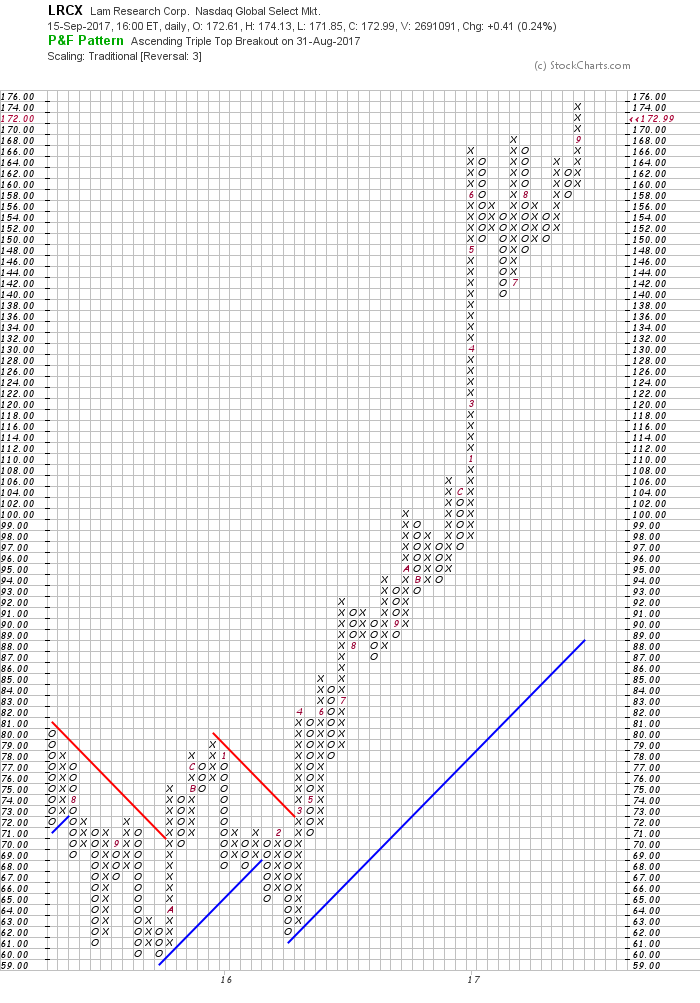
Lam Research Corp (LRCX)
Hello Friends! Thanks so much for stopping by and visiting my blog, Stock Picks Bob's Advice! As always, please remember that I am an amateur investor, and that you should always consult with your professional investment advisor prior to making any decisions based on information on this website.
I apologize for the infrequency of my posts here on this blog. I have not forgetten any of you who might choose to follow my posts and I hope that I may have contributed to your understanding of my own methods (which far from unique or original) may assist you in making decisions on purchases of shares that hopefully will ultimately be profitable for you.
 Looking through the Monday (9/18/17) edition of the Investor's Business Daily "IBD50", I came across Lam Research (LRCX) that happened to be listed as #13 on the list of top 50 stocks as rated by the IBD. Lam Research closed at $172.99 on September 15, 2017, up $.41 or .24% on the day. I do not currently own any shares of LRX but I may buy some in the future as I find this particular investment very attractive as I shall try to explain.
As I look through this list of stocks, I apply my own strategy of trying to identify stocks with strong growth characteristics without being, from my perspective, too overly priced. In fact even as a momentum investor, I am looking for good value, perhaps making me a GARP investor.
What exactly does Lam Research do?
According to the Yahoo Profile on LRCX, the company
"..designs, manufactures, markets, refurbishes, and services semiconductor processing equipment used in the fabrication of integrated circuits worldwide."
And the latest quarterly results?
On July 27, 2017, LRCX reported 4th quarter 2017 results. Earnings for the quarter came in at $3.11/share exceeding Zacks estimates of $3.02. Sequentially this was an 18.9% increase over the prior quarter and year-over-year this was a sharp 84.1% increase.
Revenues for the quarter were equally impressive coming in at $2.34 billion exceeding estimates of $2.31 billion and this was an 8.9% sequential improvement and a 51.7% increase over the prior year.
The company also raised guidance for fiscal first quarter 2018 with a new earnings estimate of $3.25 (+/- 12 cents) over the prior guidance, according to Zacks of $2.76/share.
I like to call this kind of quarterly report a "Trifecta" (with apologies to my horse racing fans) as the company came in with strong earnings as well as revenue and beat expectations and then went ahead and raised guidance!
And longer-term results?
For this I like to turn to Morningstar which has some excellent information for stocks as well as mutual funds which many of us are more familiar with their 'star ratings'. Reviewing the 5-year financials, we can see outstanding results with revenue increasing in an un-interrupted fashion from $3.59 billion in 2013 to $5.9 billion in 2016 and $8.0 billion in 2017.
Similarly, diluted earnings per share have grown dramatically from $.66/share in 2013 to $5.22/share in 2016 and $9.24/share in 2017. Outstanding shares have grown modestly from 173 million shares in 2013 to 184 million shares in 2017. I prefer to see some retirement of outstanding shares with buy-backs but this isn't much of an inflation of shares outstanding.
Free cash flow data from Morningstar is also quite impressive. Lam Research reported $559 million in free cash flow in 2013 which increased to $1.2 billion in 2016 and $1.9 billion in 2017.
And valuation? Taking a look at some Yahoo Statistics on LRCX, we find that the company is a large cap stock with a market capitalization of $28.1 billion. The trailing P/E is a moderate 18.72 but the forward P/Eis a dirt-cheap 12.69 giving this stock a screaming bargain PEG ratio of 0.65 (5 year expected). There are 162.46 million shares outstanding with 9.21 million shares out short and with average trading volue of 2.32 million, this yields a short ratio of 3.81---a bit over my own arbitrary 3 day level of significance.
The company pays a small dividend of $1.80/share yielding 1.09% going forward. LRCX has paid dividends regularly since 2014 and has increased its dividend payments each year.
And technicals on this stock?
Looking at the StockCharts.com 'Point & Figure' chart on Lam Research we can see that the stock was trading sideways between July, 2015 and March, 2016 in the $60 to $80 range and then literally 'took off' moving rapidly up to $100 in December, 2016, and then once again in January, 2017, moved sharply higher up to $166 and is currently trading near its high at $172.99.
To summarize:
Lam Research (LRCX) is firing on 'all cylinders'. The company has reported strong earnings that exceeded expectations, it has a 5 year record of growing its business, it has great value with a PEG under 1.0, the chart is quite strong and the company even pays a dividend which it has also increased regularly over the last several years.
Some people might complain that Lam, like many successful tech companies is 'expensive', that is it sells at over $170/share and they might liike something 'cheaper' so that they could purchase a larger number of shares. But expensive and cheap are not based on the price of a share which tells you only how many shares you might own for a given amount of buying power. This stock while "expensive" in price is actually "cheap" in value as its P/E and PEG ratio tell a different story of a stock price lagging its actual value. Thus the steep upward ascent in the stock price.
Thank you again for stopping by and visiting here. If you have questions or comments you can leave them here on the blog. With luck, I shall get to a few more posts on a more regular basis :).
Yours in investing,
Bob
Monday, 2 January 2017
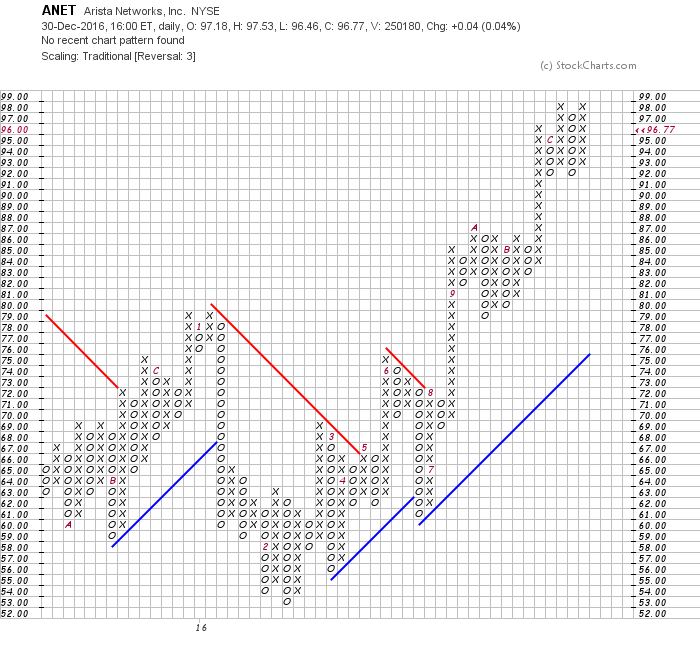
Arista Networks Inc (ANET)
Hello Friends! Thanks so much for stopping by and visiting my blog Stock Picks Bob's Advice! As always, please remember that I am an amateur investor, so please remember to consult with your professional investment advisers prior to making any investment decisions based on information on this website.
I have had quite a hiatus in blogging here. I spent some time managine several models on Covestor but after the Interactive Brokers Acquisition, changes came to that platform, and although I am quite happy about my own performance, I remain an amateur investor (haven't I said that already?) and no longer manage any models for them. However, I still have a continuing Model, the Sparrow "Freedland Healthcare" model that continues on after me and in light of that Model, I shall refrain from commenting on Healthcare stocks on this website.
But there are certainly many other stocks out there to examine. One of my favorite places to identify some new ideas to discuss remains the Investor's Business Daily which has moved from a real "Daily" to one that is published on a weekly basis. In each of these editions, there is an IBD50 which for me is a treasure trove of stock investment ideas and often, as today, I like to identify candidates for inclusion either in my actual trading portfolio or like today just as an entry for consideration.

Arista Networks, Inc. (ANET) made the IBD50 this weekend at the #11 position. They closed Friday (12/30/16) at $96.77 up $.04 or .04% on the day. I do not own any shares of this stock nor am I planning to purchase any in the immediate future. But as I will show you, some of their numbers are quite compelling, and it is the type of stock that I would like to add to my portfolio some day.
According to the Yahoo "Profile" on Arista, the company
"... supplies cloud networking solutions in the United States

and internationally. The company’s cloud networking solutions consist of extensible operating systems, a set of network applications, and gigabit Ethernet switches. It also offers technical support services. The company serves a range of industries, including Internet companies, service providers, financial services organizations, government agencies, media and entertainment companies, and others. Arista Networks, Inc. markets its products through direct sales force, as well as channel partners, such as distributors, value-added resellers, systems integrators, and original equipment manufacturer partners."
If you are a regular reader of this blog (even though I have been far from a regular poster here!), you may know that I like to take a look first at the latest quarterly result.
In this case, Arista reported 3rd quarter results on November 4, 2016. As the Motley Food commented:
"Sales jumped by a third to $290.3 million, which was slightly faster than the ambitious 30% growth rate that investors wanted to see. On the bottom line, adjusted net income was up 44% to $61.2 million, and that produced adjusted earnings of $0.83 per share. That figure was $0.10 per share higher than the consensus forecast for earnings among those following the stock."
For me, the important thing was that the revenue and the earnings were postiive and they beat expectations. The company also raised guidance (part of what I call my 'trifecta' of results with beats on both the revenue and earnings side and then raising of guidance).
According to the Motley Fool:
"Arista's guidance for the fourth quarter was also encouraging, giving investors a reasonable expectation that the company's outperformance can continue. Arista said that it expects to generate between $310 million and $320 million in revenue during the fourth quarter, and that range is above the current consensus forecast among investors for the period."
What about longer-term? A single quarter does not make a successful investment from my perspective. For this I turn to Morningstar.com and take a look at the "5-Year Financials".
Here we can see that Revenue has grown steadily from $140 million in 2011 to $838 million for the year ending 12/15 and $1.047 billion in the trailing twelve months (TTM). Diluted earnings per share have grown from $.73/share in 2013 to $1.67/share in 2015 and $2.31/share in the TTM. Outstanding shares have increased somewhat from 54 million in 2013 to 71 million in 215 and 73 million in TTM. I prefer to see the shares stable or declining but certainly the rate of growth of outstanding shares lags behind both the revenue and the earnings growth so this is quite acceptable.
In terms of financial health, a quick measure is the comparison of current assets to current liabilities giving us the current ratio. According to Morningstar, Arista has $974 million in current assets as compared to $235 million in current liabilities. This yields a current ratio of 4.14. As a minimum a current ratio, from my perspective, is 'healthy' when it is 1.5 or higher.
In terms of free cash flow, Morningstar reports that ANET had $10 million in free cash flow in 2011, by 2015, Arista was reporting $181 million in free cash flow and this has dipped to $173 million in the TTM. We prefer to identify stocks like Arista generating free cash flow and not using up their existing cash.
Looking at some basic Statistics from Yahoo on Arista, we see that the company is a mid-cap stock with a market capitalization of $6.79 billion. The trailing P/E is a rich 48.14, but with the rapid growth in earnings anticipated the forward P/E is at a more reasonable but not cheap 28.21. The PEG isn't too far out of line at 1.57 suggesting actually reasonable valuation (from my own particular perspective 1.0 to 1.5 is ok) for this stock.
There are 70.21 million shares outstanding with 43.76 million that float. Currently there are 5.24 million shares out short, above my own '3 day rule of significance' with a short ration of 6.5.
No dividends are paid and no splits are reported.
Finally, if we look at the chart from StockCharts.com, we can see a very stong chart that broke out sometime in late August, 2016, as it broke through the prior high at $80 and is currently trading just under the recent high of $98 at $96.77. The stock looks bullish to my own amateur eyes!
It should be noted that browsing through the news on Artista we can see stories regarding ongoing disputes between Arista and Cisco (CSCO) another networking giant. Recently, Arista had a good court ruling in a lawsuit that Cisco had apparently filed against it. Cisco does plan to appeal the ruling and had been seeking nearly $355 million in damages. This story deserves continued watching.
Overall I like this stock. I like the steady earnings and revenue growth, the excellent financials, valuation is satisfactory, recent earnings surprised on the upside, and the chart looks encouraging as well. I might just buy some shares in the future!
Thank you so much for stopping by and visiting here. I will of course try to do a better job at posting. If I get it together I might even get a Podcast out! Your loyalty is appreciated and you are more than welcome to post any comments or questions right here on the website.
Yours in investing,
Bob
Monday, 6 July 2015
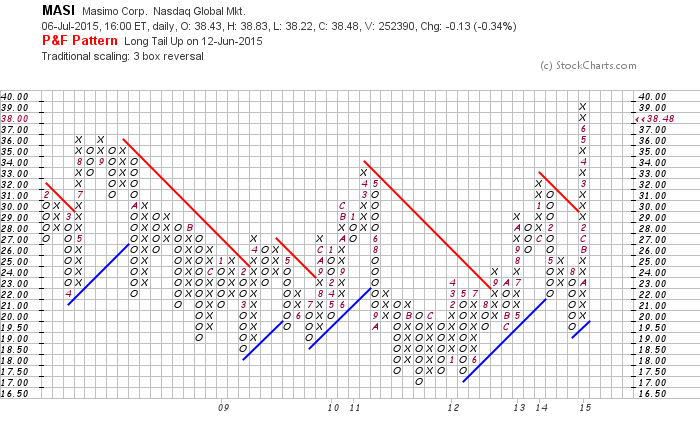
Masimo (MASI)
Hello Friends! Thanks so much for stopping by and visiting my blog, Stock Picks Bob's Advice. As always, please remember that I am an amateur investor, so please remember to consult with your professional investment advisers prior to making any investment decisions based on information on this website.

On June 11, 2015, I purchased shares of Masimo (MASI) in my Covestor Growth and Momentum model at a price of $36.67. Masimo (MASI) closed at $38.48 down $(.13) today of (.34)% (7/6/15). Let's take a closer look at this company and I shall share with you some of my thoughts about what was behind my decision to buy.
According to the Yahoo "Profile" on MASI, the company
"...develops, manufactures, and markets noninvasive monitoring technologies worldwide."
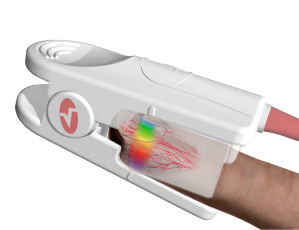
The company has devices that moitor oximetry, oxygen saturation, pulse rate, perfusion index, respiration rate, and even non invasively measure hemoglobin and EEG signals--among other abilities.
When I first came across this company, I immediately thought of the recent Apple Watch and speculation about non-invasive measurement of health data. In fact, Apple has actually hired some personnel from Masimo for the Apple Watch. I actually am not sure how this helps Masimo to lose one of the medical specialists, but clearly the company is in the right place with the right type products that may well have increasing application.
For the most part, I don't really like story stocks. I like to pick stocks with real earnings, real revenue growth and bullish price charts. (Don't we all?) So let's take a look at the numbers that MASI has recorded.
On May 6, 2015, Masimo reported 1st quarter results. First quarter profits came in at $20.5 million or adjusted earnings of $.41/share exceeding Zacks estimates of $.36/share. Revenue for the quarter came in at $154.5 million, also exceeding Zacks estimates of $152.1 million. Revenue for the quarter increased 11% over prior year's results and adjusted eps increased to $.41/share from $.31/share last year. The company also raised guidance for 2015 results to $608 million in revenue (from previous guidance of $605 million), and earnings to $1.33/share (from previous guidance of $1.30).
A financial report cannot be much better than this. In the past I have referred to this as a "trifecta-plus" stock. This would mean earnings that grew, revenue that grew, expectations that were beaten, and guidance raised! How could an investor do better?
What about longer-term results? If we look at the Morningstar.com '5-Year Financials' we can see that revenue has increased from $405 million in 2010 to $587 million in 2014 and $601 million in the trailing 12 months (TTM). Diluted earnings per share have not been as consistent with $1.21 reported in 2010, dipping to $1.02 in 2013, and $1.30 in 2014 with $1.29 in the TTM. Outstanding shares have decreased from 61 million in 2010 to 55 million in the TTM.
Briefly looking at the Morningstar.com 'balance sheet' on Masimo, we can see that the company is reported to have $315 million in total current assets compared to $124 million in total current liabilities. This yields a 'healthy' current ratio of 2.54. In terms of free cash flow, the company has had increasing capital expenditures and in the trailing twelve months has a $(2) million in free cash flow per Morningstar.
Reviewing the Yahoo "Key Statistics" on Masimo (MASI) for some valuation numbers, we can see that first of all, the company is a small mid-cap stock with a market capitalization of $2.01 billion. The company has a trailing P/E of 29.95, with a forward P/E (fye Jan 3, 2017) of 25.32 and a PEG of 1.76. There are 52.26 million shares outstanding and 44.37 million of them float. Currently there are 2.22 million shares out short (6/15/15) and with the average volume of 327,512 shares, this yields a Short Interest Ratio of 8.00, well ahead of my own arbitrary 3 day value for significance. No dividends are paid and no stock splits are reported.
Examining the Masimo 'point and figure' chart from StockCharts.com, we can see that this stock has gone almost nowhere between 2008 and 2014 trading in a rather tight range between $17 and $36. In fact, the trend was actually quite negative until the stock bottomed in November, 2011 at about $17 and started moving higher. The stock really took off in October, 2014 and has charged higher from $19.50 to its current level of $38.48, breaking through resistance at around $29. I leave it to you to make your own call, but the stock chart looks strong without being over-valued from my own amateur perspective.
To summarize, I recently purchased some shares of Masimo (MASI). I like their latest financial results, I am intrigued by the non-invasive devices and wonder if applicability to wearable watches and the like might offer some consumer applications beyond the obvious medical placements.
Thanks again for stopping by! If you have any questions, please feel free to leave them right here.
Yours in investing,
Bob
Saturday, 3 January 2015
Avago Technologies (AVGO)
Hello Friends! Thanks so much for stopping by and visiting my blog Stock Picks Bob's Advice. As always, please remember that I am an amateur investor, so please remember to consult with your professional investment advisers prior to making any decisions based on this website.
 On October 17, 2014, I purchased shares of Avago Technologies (AVGO) for inclusion in my Covestor Growth and Momentum model at a cost of $75.54. AVGO closed at $100.09 on January 2, 2015. Thus far, this has been an absolutely terrific purchase for this Covestor Model. It deserves a closer look here on this blog.
According to the Yahoo "Profile" on Avago Technologies, the company
"... is engaged in the design, development, and supply of analog  semiconductor devices with a focus on III-V based products. Its product portfolio comprises RF power amplifiers, RF filters, RF front end modules, ambient light sensors, low noise amplifiers, proximity sensors, multimarket-wave mixers, diodes, fiber optic transceivers, serializer/deserializer ASICs, optical laser and receiver components, motion control encoders and subsystems, optocouplers, LEDs, and industrial fiber optics. The company’s products are used in cellular phones, consumer appliances, data networking and telecommunications equipment, enterprise storage and servers, data communications, smart phones, base stations, core routing and transport, in-car infotainment, motor controls, factory automation, displays and lighting, power isolation, power conversion, and renewable energy systems applications."
Avago reported outstanding 4th quarter results on December 4, 2014, with earnings coming in at $1.99 a 124% increase over the prior year with revenue climbing 118% to $1.61 billion. These results easily beat expectations of earnings of $1.69 on $1.55 billion in sales according to analysts as polled by Thomson Reuters.
The company also provided guidance ahead of expectations for first quarter 2015 results with stable to up 4% revenue which works out to $1.61 to $1.67 billion ahead of the $1.51 billion expected.
Avago is benefitting from the phenomenal success of the iPhone 6 launch which carries 50% more Avago chips than the iPhone 5. For perspective, it is estimated that Apple (AAPL) sold 71.5 million iPhone 6 in the 2014 final quarter. That would represent a 40% increase in iPhone sales from the prior year.
In terms of longer-term results, reviewing the Morningstar.com 5 Years Financials on Avago, revenue increased from $2.09 billion in 2010 to $2.36 billion in 2012, then really took off increasing to $2.5 billion in 2013 and $4.27 billion in the trailing twelve months (TTM).
Diluted earnings per share, however, increased from $1.69/share in 2010 to $2.19/share in 2013, but only came in at $.99/share for the TTM. However, this does not appear to reflect the last quarter (above) which was reported at $1.99/share in the 3 month final period of the year. Outstanding shares have increased slightly from 246 million in 2010 to 267 million in the TTM.
A brief look at the Morningstar.com reported Balance Sheet shows that current assets as of 10/14 came in at $3.8 billion, compared to current liabilities of $1.02 billion yielding a current ratio of above 3.0.
Free cash flow has also been impressive with $431 million reported in 2010 increasing to $486 million in 2013 and $766 million in 2014.
In terms of valuation, examining the Yahoo Key Statistics on Avago, the company has a market cap of $25.42 billion, the trailing P/E is reported at 101.31 but with the rapid growth as reported in the fourth quarter (above), the Forward P/E (fye Nov 2, 2016) is only 12.62 resulting in a PEG (5 yr expected) of only 0.44. Personally, I like to see a growth stock with a PEG between 1.0 and 1.5 to consider it a 'good value'. With the PEG of AVGO at 0.44, the stock at least through this perspective is downright cheap.
Yahoo reports that there are 254.0 million shares outstanding with 231.7 million of them that float. Currently (11/28/14) there are 2.89 million shares out short, and considering the average volume of 1.1 million shares traded, this represents a short interest ratio of 1.80 (under the 3.0 level I personally use to consider significant short interest).
The company even pays a dividend with a forward dividend rate of 1.4%. They recently raised the dividend to $.35/share quarterly from $.32/share previously paid---as the trailing dividend rate works out to only 1.3%. While the payout ratio appears to be an unsustainable 115%---with the rapid growth in earnings, this does not appear to be a problem at all.
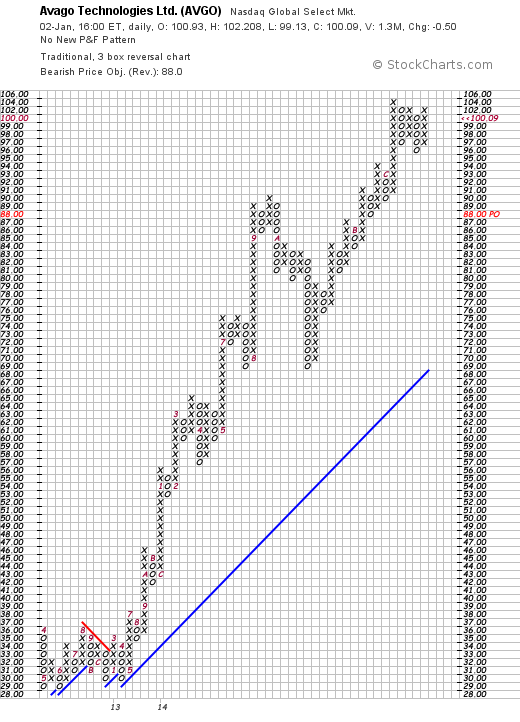
Looking at the beautiful 'point & figure' chart on Avago Technologies (AVGO) from StockCharts.com, we can see that the stock traded sideways between $36 and $29 between April, 2012, and June, 2013, before literally exploding to the upside to the current $100 level it just closed at last week. I was very fortunate to catch it as it was coming out of a brief correction at the $75 level in mid-October, 2014.
Avago Technologies (AVGO) has been benefiting from the amazing sales results of the iPhone 6 introduced this past year. Another of my holdings NXP Semiconductors (NXPI) is also receiving business from sales of this mobile device. Skyworks Solutions (SWKS) also receives business from the iPhone and is also another holding in this model. In fact, expanding on this investing theme, I have also purchased shares of Apple (AAPL) in another Covestor Model, the Sustained Momentum platform. I suppose one could say I have profited from an excellent iPhone connection. With the Apple Watch on the near-term horizon, the interest in the iPhone and Apple products appears far from over.
Yours in investing,
Bob
Posted by bobsadviceforstocks at 8:41 PM CST
|
Post Comment |
Permalink
Updated: Saturday, 3 January 2015 10:46 PM CST
Saturday, 8 November 2014
AmerisourceBergen (ABC)
Hello Friends! Thanks so much for stopping by and visiting my blog, Stock Picks Bob's Advice! As always, please remember that I am an amateur investor, so please remember to consult with your professional investment advisers prior to making any investment decisions based on information on this website.
 On October 10, 2014, I purchased shares of AmerisourceBergen (ABC) in my Covestor Healthcare Model for a cost of $77.70 a share. ABC closed at $86.73 on November 7, 2014 down $(.67) or (.77)% on the day. The stock has performed well since my purchase and I would like to share with you the reasons underlying that performance.
First let's take a look at what this company does. According to the Yahoo "Profile" on AmerisourceBergen, the company
"...sources and distributes pharmaceutical products to healthcare  providers, pharmaceutical and biotech manufacturers, and specialty drug patients in the United States and internationally. Its Pharmaceutical Distribution segment distributes brand-name and generic pharmaceuticals, over-the-counter healthcare products, home healthcare supplies and equipment, and related services to various healthcare providers, including acute care hospitals and health systems, independent and chain retail pharmacies, mail order pharmacies, medical clinics, long-term care and other alternate site pharmacies, and other customers."
This company has been 'on a roll' since March, 2013, when they announced an agreement with Walgreen's thought to be worth $400 billion over 10 years. This arrangement also gave Walgreen's and its partner Alliance Boots a 7% stake in ABC with option to increase its ownership up to 23%.
In terms of their financial performance, let's take a look first at their latest quarter just reported on October 30, 2014. ABC reported fourth quarter 2014 results for the period ended September 30, 2014. Earnings for the quarter came in at $1.10/share, beating expectations of $1.05/share according to Zacks Consensus. Revenue increased a strong 29.1% to $31.6 billion well ahead of Zacks Consensus Estimate of $30.6 billion. For the full year the company beat expectations in both revenue and earnings coming in at $119.6 billion in revenue, up 35.9% from fiscal 2013 and ahead of Zacks Estimate of $118.7 billion. Earnings came in at $3.97/share for the year up from $3.21/share in 2013 and again ahead of Zacks which had expected $3.21.
Finishing off this excellent announcement, the company provided strong guidance of $4.36-$4.50/share in 2015, up 10%-13% from 2014 and mostly above of Zacks estimates of $4.37/share for the coming year. I have found it to be a strong indicator of future price appreciation when a company reports results ahead of expectations and then guides strongly into the future!
In terms of longer-term results, reviewing the Morningstar.com '5-year financials', we can see that revenuehas grown steadily from $71.8 billion in 2009 to $112.4 billion in the trailing twelve months (TTM). Diluted earnings per share during this same period have been less consistent and grew from $1.66/share in 2009 until peaking at $2.80/share in 2012 before dipping to $1.84/share in 2013 and to $1.10/share in the TTM. Outstanding shares have declined from 303 million in 2009 to 235 million in the TTM.
Taking a brief look at the balance sheet on Morningstar, we can see that as of September, 2013, AmerisourceBergen had $14.4 billion in current assets as compared to $14.9 billion in current liabilities for a current ratio of just under 1.0.
In terms of free cash flow, ABC reported $1.1 billion in free cash flow in 2012, dipping to $586 million in 2013 and $338 million reported in the TTM.
From all of the above we can see that Amerisource Bergen (ABC) which reported very strong results this past year has until recently been experiencing a decrease in earnings, some stress on its balance sheet, and a reduction in free cash flow. These results need to be monitored going forward.
Technically, the 'point & figure' chart from StockCharts.com on ABC is nothing short of phenomenal. After selling off to a low of $12.50 in November, 2008, the stock has just about been on fire flying to a peack of $89/share this past month. This stock has been very favorably received by investors!
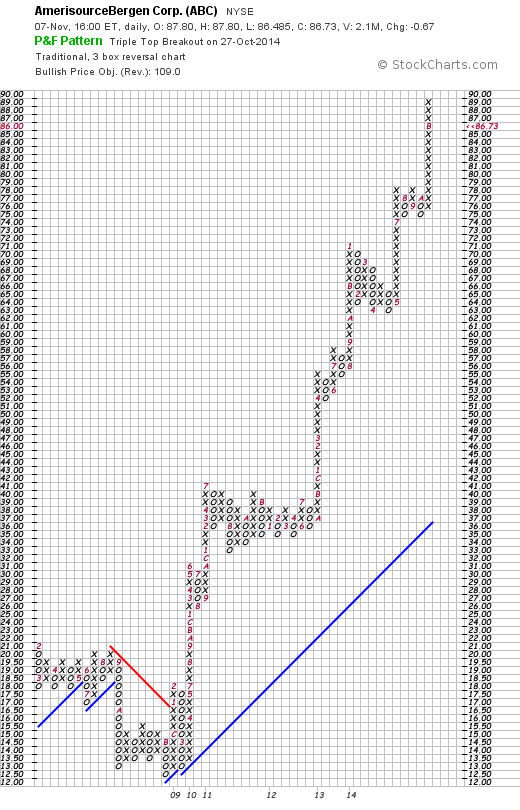
To summarize, AmerisourceBergen (ABC) is a recent addition to my Covestor Healthcare Model. The company distributes medications and healthcare products and recently established a relationship with Walgreen's and Boots that has allowed it to accelerate revenue and earnings growth. The latest quarter was quite strong as the company beat expectations on earnings and revenue results and provided strong guidance. Longer-term, ABC has demonstrated a consistent pattern of revenue growth yet earnings growth has been inconsistent with results improving recently. The balance sheet while acceptable shows a little stress as the company has issued debt to handle its rapid growth. Free cash flow while still strong is also not quite as positive at least as of last year. Technically, the stock is incredibly strong. I like the current prospects of ABC and am a holder of the stock. I expect the other financial numbers to continue to improve with the rapid growth in revenue and earnings its prospects suggest.
Thank you for stopping by and visiting my blog! If you have any comments or questions, please feel free to leave them here on the website.
Yours in investing,
Bob
Sunday, 29 June 2014
Williams-Sonoma (WSM)
Hello Friends! Thanks so much for stopping by and visiting my blog Stock Picks Bob's Advice! As always please remember that I am amateur investor, so please remember to consult with your professional investment advisers prior to making any investment decisions based on information on this website.
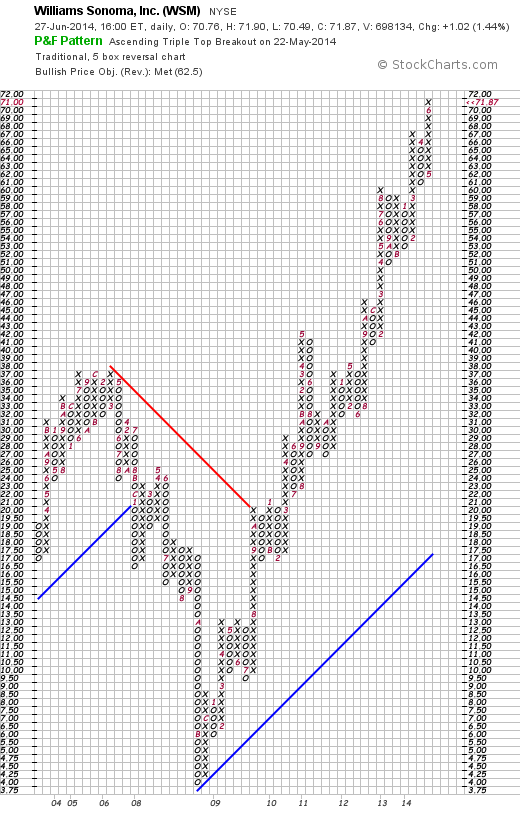
 On May 21, 2014, I purchased shares of Williams-Sonoma at $63.80/share for my Covestor Growth and Momentum model. WSM closed at $71.87 on June 27, 2014 for a nice gain in a relatively short holding period.
This stock is an 'old favorite' of mine here on this blog as I first wrote it up on August 25, 2004, nearly ten years ago (!) when it was trading at $34.64. In retrospect it might appear that I had made a brilliant selection, but in reality the stock nearly collapsed into the 2008 financial mess bottoming at approximately $4.00/share November, 2008 as the following StockCharts.com 'point and figure' chart shows.
Most of us are quite familiar with Williams-Sonoma (WSM) which may be found in many high-end malls with their clever and expensive gadgets that make Espresso or Waffles or process food with the many clever devices and utensils. They also operate the Pottery Barn brand. As the Yahoo.com profile describes them, the company
"...operates as a multi-channel specialty retailer of home products. The company operates in two segments, Direct-to-Customer and Retail. It offers cooking, dining, and entertaining products, including cookware, tools, electrics, cutlery, tabletop and bar, outdoor, furniture, and a library of cookbooks essentials under the Williams-Sonoma brand; furniture,  bedding, bathroom accessories, rugs, curtains, lighting, tabletop, outdoor, and decorative accessories under the Pottery Barn brand; and products designed for creating magical spaces where children can play, laugh, learn, and grow under the Pottery Barn Kids brand. The company also provides an assortment of products, including furniture, bedding, bathroom accessories, rugs, curtains, lighting, decorative accessories, dinnerware, kitchen essentials, and gifts under the West Elm brand; and a line of furniture, bedding, lighting, decorative accents, and others for teen bedrooms, dorm rooms, study spaces, and lounges under the PBteen brand. In addition, it offers lighting and home-goods product lines, including lights, hardware, furniture, and home décor that span periods back to the 1870s; and women’s and men’s accessories, small leather goods, jewelry, key item apparel, paper, entertaining and bar, and home décor, as well as seasonal items under the Mark and Graham brand. The company markets its products through e-commerce Websites, direct mail catalogs, and specialty retail stores."
What really grabbed my attention wasn't the gadgets, the stores, the Peter Lynch part of investing, but simply the outstanding fundamental and technical performance of the stock. On May 21, 2014, WSM announced 1st quarter 2014 results. First quarter revenues increased 9.7% to $974 million vs $888 million in the prior year same period. Operating income increased 16.5% to $74 million and operating margin increased to 7.6% compared to 7.2% the prior year same period. Earnings for the quarter increased 20% to $.48/share. Expectations for the quarter of $.44/share were easily surpassed.
Total same-store sales growth increased by 10% in a somewhat anemic retail environment. For the full year WSM guided to same-store sales growth in the 5% to 7% range---still an impressive number.
I do not believe that stocks should be purchased on the basis of a single great quarter if everything else isn't also 'in line'. It is important to identify those companies that perform well quarter after quarter IMHO. Let's take a look at the Morningstar.com '5 Years Financials' on Williams-Sonoma (WSM). Revenue has steadily increased from $3.1 billion in 2010 to $4.39 billion in 2014 and $4.47 billion in the trailing twelve months (TTM). Net income has also steadily increased from $77 million in 2010 to $279 million in 2014 and $286 million in the TTM. Diluted earnings per share have also steadily increased from $.72/share in 2010 to $2.82/share in 2014 and $2.92/share in the TTM. Meanwhile outstanding shares, which did increase from 107 million in 2010 to 110 million in 2011 have subsequently been decreasing each year to 99 million in 2014 and 98 million in the TTM.
 Taking a quick look at the Balance Sheet on Morningstar, we can see that Total current assets total $1.42 billion, with Total current liabilities coming in at $861 million for a healthy current ratio of 1.65. Free cash flow remains positive but has fluctuated with $418 million in 2010 dipping to $159 million in 2013 with $259 million reported in the TTM.
What about valuation? Is Williams-Sonoma (WSM) still priced at a level worth considering a new committment of funds?
According to the Yahoo "Profile" on WSM, this company has a market cap of $6.76 billion making it a 'mid cap' stock. The trailing P/E is a moderate 24.49, not what I would call 'cheap' but then again not bad considering its current financial performance. Thus the Forward P/E (fye Feb 2, 2016) is estimated at 19.69 with a PEG Ratio (5 year expected) a tad rich for me also at 1.63 but really not excessive from my amateur perspective.
According to Yahoo WSM has 94.1 million shares outstanding with a float of 81.8 million. As of May 31, 2014, there were 4.00 million shares out short, a bit of a significant short interest ratio--using my own arbitrary 3 day rule for significance. The company pays a forward dividend of $1.32/share (up from $1.26 in the trailing 12 months--in itself a positive finding) with a forward estimated yield of 1.9%. The company has a payout ratio of 43%. The company has been increasing its dividend regularly for at least the last 8 years. Williams-Sonoma last split its stock with a 2:1 split back on May 10, 2002.
To summarize, there are so many different reasons I find this stock very attractive. Besides the intuitive delight in visiting their main chains of Pottery Barn and Williams-Sonoma stores, the company reported a solid quarter and raised guidance for the year (although it did express cautious guidance for the 2nd quarter), they have been executing well for the past five years. Valuation isn't cheap but it is reasonable. Technically the stock is firing on all cylinders. To top it off I love their waffle irons :).
Thanks so much for stopping by and visiting my blog! If you have any comments or questions, please feel free to leave them here.
Yours in investing,
Bob
Wednesday, 7 May 2014
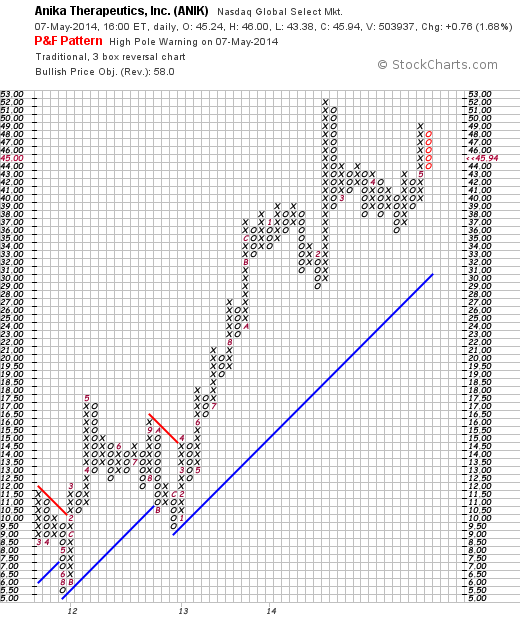
Anika Therapeutics (ANIK)
Hello Friends! Thanks so much for stopping by and visiting my blog, Stock Picks Bob's Advice! As always, please remember that I am an amateur investor, so please remember to consult with your professional investment advisers prior to making any investment decisions based on information on this website.
 On May 5, 2014, I purchased shares of Anika Therapeutics (ANIK) for the Covestor Healthcare Model at a cost of $47.19. Anika (ANIK) closed at $45.94 on 5/7/14 for a gain on the day of $.76 or (1.68)%
This model has been a terrific performer for me and for those on Covestor who are following along. Over the last 365 days the Model is up 34.3% and since its inception (October 6, 2010), the Covestor Healthcare Model has experienced an annualized appreciation of 18.6% exceeding the S&P 500 which during the same period appreciated 16.7% annually but lagging the S&P 500 Healthcare Index which averaged a 21.7% gain. Unfortunately, this Model also pulled back during the rather severe March and April Biotech correction.
At the same time that the Biotech Correction was developing, the so-called 'momentum stock correction' also kicked in taking its toll on many of my same holdings. From my own perspective, I do not think it is really possible that momentum stocks will fail to rise. It is simply that the stock market experienced a rotation out of old momentum names into other names that hadn't appreciated to quite as lofty of levels. As one of my favorite stock market commentators Jim Cramer would say, "There is always a bull market somewhere!"
With some cash within the model from prior sales of correcting healthcare stocks, I purchased shares of Anika (ANIK), a fast-growing company which according to the Yahoo "Profile":
"...develops, manufactures, and commercializes therapeutic products for tissue protection, healing, and repair in the United States, Europe, and internationally. The company’s products are based on hyaluronic acid (HA), a naturally occurring biocompatible polymer found in the body. Its orthobiologics products comprise ORTHOVISC, ORTHOVISC mini, and MONOVISC for the treatment of osteoarthritis of the knee and joints; Hyalofast, a biodegradable support for human bone marrow 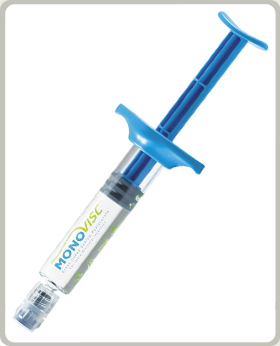 mesenchymal stem cells that is used in connection with soft tissue regeneration; Hyalonect, a woven gauze used as a graft wrap; Hyaloss used to mix blood/bone grafts to form a paste for bone regeneration; and Hyaloglide, an ACP gel used in tenolysis treatment. The company’s dermal products include wound care products that comprise Hyalomatrix and Hyalofill, for treatment of complex wounds, such as burns and ulcers; Hyalograft 3D and Laserskin scaffolds for use in connection with the regeneration of skin; and ELEVESS, an aesthetic dermatology product. Its surgical products comprise Hyalobarrier, a post-operative adhesion barrier for use in the abdomino-pelvic area; INCERT, a HA product for the prevention of spinal post-surgical adhesions; Merogel, a woven fleece nasal packin; and Merogel Injectable, a viscous hydrogel. The company’s ophthalmic products include AMVISC, AMVISC Plus, STAARVISC-II, Optivisc, AnikaVisc, and AnikaVisc Plus that are injectable HA products used as viscoelastic agents in ophthalmic surgical procedures, including cataract extraction and intraocular lens implantation; and veterinary product comprise HYVISC, an injectable HA product used for the treatment of joint dysfunction in horses."
On April 29, 2014, Anika (ANIK) reported 1st quarter 2014 results. Revenue for the quarter came in at $34.0 million, up 124% from the $15.2 million in the same quarter the prior year. Net income for the quarter came in at $15.0 million or $.97/share up 378% from $3.1 million or up 362% from the $.21/diluted share the same quarter last year. Needless to say these are phenomenal growth numbers for this company.
A highlight for the company during the quarter was the FDA approval of Monovisc which is an injection into the knee to treat people with osteoarthritis who might benefit from this hyaluronic acid which acts as a supplement to the synovial fluid lubricating the knee joint. It is estimated that 80% of Americans over the age of 65 have knee osteoarthritis. Clearly this is a very big market as all of us baby boomers age!
In terms of longer-term results, examining the Morningstar.com "5 Years Financials" on Anika, we can see that revenue has grown steadily from $40 million in 2009 to $75 million in 2013 and $94 million in the trailing twelve months (TTM). Diluted earnings per share have literally sky-rocketed from $.32/share in 2009 to $1.39/share in 2013 and $2.15/share in the trailing twelve months. Outstanding shares have increased from 12 million in 2009 to 15 million in the TTM.
Some of the highlights from the Morningstar.com report on the balance sheet shows that as of 12/2013 ANIK had $95 million in total current assets balanced against $9 million in total current liabilities and NO long-term debt. Free cash flow has improved from $(1) million in 2009 to $25 million in 2013 and $32 million in the TTM.
According to the Yahoo "Profile" on Anika (ANIK), the company's stock should be considered a Small Cap stock with market capitalization calculated at $664.34 million. The trailing P/E is reported at 21.28. (The forward P/E, according to Yahoo is 27.84, but I suspect this estimate is lagging the latest quarter and the spectacular growth in revenue and earnings just reported.) In fact, the PEG Ratio, utilizing the estimated 5 year growth, comes in at a very reasonable 0.68.
Yahoo reports 14.46 million shares outstanding with 14.09 million that float. As of 4/15/14 there were 670,860 shares out short representing a short interest ratio of 2.3 trading days. No dividends are paid and no stock splits are reported.
In terms of the technical performance of the stock price, looking at a 'point & figure' chart on Anika (ANIK) from StockCharts.com, we can see that the stock has appreciated sharply from $5.00/share in July, 2011 to a high of $52 in February, 2014. The stock has been consolidating at that level and is trading below the high but overall the chart still appears quite strong from my amateur perspective!
To summarize, I recently purchased shares of Anika Therapeutics (ANIK) in my Covestor Healthcare Model. This is a small company with a rapidly growing product line based around Hyalonic Acid product in Orthopedic, Dermatologic, Ophthalmic and Neurosurgical procedures among other uses. They recently reported what I could only describe as phenomenal quarterly results and they have been growing rapidly for at least the past five years. Their financials are gorgeous as they are cash rich and have no long-term debt and little current liabilities. In fact, they are growing their free cash flow rapidly as well. The valuation is modest with a P/E only at about 21 and a PEG well under 1.0. The chart is equally impressive. In fact, there is little I can find to criticize if only that the company is concentrated around a variety of products conncected to the Hyaluronic Acid material.
Thank you again for stopping by and visiting. If you have any comments or questions, please feel free to leave them here on this website.
Yours in investing,
Bob
Newer | Latest | Older


