Stock Picks Bob's Advice
Thursday, 6 May 2004
Thoughts on disciplined trading.
Hello Friends. Yesterday I was in love with IPXL and was thinking about breaking trading rules to buy a little. Today the market is pulling back and BOY AM I GLAD I DIDN'T BUY! I was waiting for the market to TELL ME to buy with a signal of a partial sale on a stock that was doing well....How do you like that? I don't need to go to the blackboard....now if I just could get the stock market to cooperate a little!
Anyhow, will be looking for some new stocks to consider....thanks so much for stopping by!
Bob
Wednesday, 5 May 2004
May 5, 2004 Impax Labs (IPXL)

Hello Friends! I am going to TRY to add some images to these posts...let's see how this works! As always, PLEASE remember to do your own investigation of all of these investments discussed on this website as I am an AMATEUR investor! So remember to consult with your own investment advisors prior to making any decisions, to make sure investments discussed are timely and appropriate for you!
I came across Impax Labs (IPXL) this morning. Quite frankly, it is not a perfect fit for this blog, but I suspect if I get TOO picky, we will all miss out on some great companies...let's see how it goes. IPXL is trading currently at $24.95, up $3.95 or 18.81% on the day. According to the Yahoo
profile, IPXL "...is a technology-based specialty pharmaceutical company focused on the development and commercialization of generic and brand name pharmaceuticals, utilizing its controlled-release and other in-house development and formulation expertise."
And guess what? What drove this stock higher was an outstanding
earnings report that was released this morning (5/5/04) before the opening of trading. Check out these numbers: revenue for the first quarter ended March 31, 2004, came in at $38.5 million, up more than 240% from last year's $11.4 million in the same quarter. Now even more impressive, was the point that revenue grew more than 131% from the PRIOR quarter's revenue of $16.8 million! Net income came in at $9.05 million or $.14/diluted share compared to a LOSS of $(3.2) million or $(.07)/share the prior year. These numbers BY THEMSELVES are so interesting I may JUST go buy some shares...if I can find something to sell...hmmmm.
If we check the
"5-Yr Restated" financials on Morningstar, we can see that revenue has grown a bit inconsistently from $1.2 million in 1999 to what Morningstar was reporting at $50.4 million in the trailing twelve months. However, this obviously does not include the current quarter.
Morningstar.com also shows a decreasing loss from $(.73)/share in 1998, to $(.25)/share in the trailing twelve months. This company is JUST turning profitable.
Free cash flow, unfortunately, is also negative but improving with $(34) million in 2001, $(30) million in 2002 and $(22) million in the trailing twelve months.
The balance sheet looks quite adequate, imho, with $22.5 million in cash, $28.7 million in other current liabilities, and $31 million in current liabilities with $27.5 million in long-term liabilities.
Looking at
"Key Statistics" on Yahoo.com, we can see that the Market Cap is at $1.45 billion, the trailing p/e is not meaningful (due to earlier losses) but the forward p/e isn't bad at 21.40, with a PEG (5-yr predicted) downright reasonable at 1.14.
Price/sales is downright expensive however at 20.68.
IPXL has 57.93 million shares outstanding with 36.40 million of them that float. Currently, as of 4/7/04, there were 3.66 million shares out short, which is quite a big number, representing 10.04% of the float or 3.296 trading days. I suspect that today's sharp spike in the price represents a 'squeeze' of the shorts who are scrambling to cover their borrowed shares as the price climbs.
No cash dividend is reported and Yahoo does not report any stock splits either.
How about Technicals? Looking at a
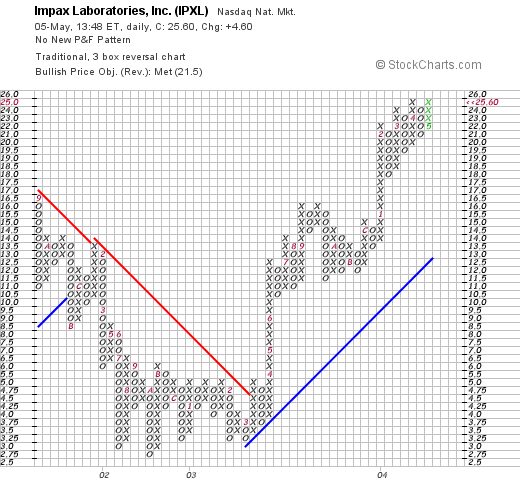
IPXL Point and figure chart, we can see that this stock broke out strongly in mid-March 2003 and has headed higher from the $4.75/share level to its current level.
What do I think? This is an INTRIGUING stock. I do not currently hold any shares or leveraged positions, but would be happy to buy some. I may even check my trading portfolio to see if there is any way to add a few shares! Thanks again for stopping by! If you have any questions, comments, or words of encouragement, please feel free to email me at bobsadviceforstocks@lycos.com
Bob
Monday, 3 May 2004
May 3, 2004 Province Healthcare (PRV)
Hello Friends! Thanks so much for stopping by. As always, remember that I am an amateur investor who writes about stocks...so please do your own investigation of all stocks mentioned on this website and please consult with your investment advisors to make sure that stocks and methods discussed are appropriate and timely for you!
I had a pretty good weekend...hope you did too. It is amazing how the market literally gets into your system and you can feel yourself feeling "down" when the market goes down and "up" when the market soars. Hmmmm....maybe I am taking this too far??
Anyhow, was scanning the lists of market movers this noon, and came across Province Healthcare (PRV). I do not own any shares nor do I have any leveraged positions in this company. PRV, as I write, is trading at $16.80, up $.81 or 5.07% on the day. According to the
Yahoo "Profile", Province "...owns and operates acute care hospitals located in non-urban markets. The Company owns or leases 20 general acute care hospitals in 13 states with a total of 2,284 licensed beds."
Wednesday, after the close on 4/28/04, Province
reported 1st quarter 2004 results. Revenues from continuing operations increased 9.9% to $204.9 million compared to $186.5 million the prior year. Net income came in at $11.6 million vs $9.9 million the prior year or $.23/share vs $.20/share the prior year. These results are just fine!
The picture looks even nicer long-term. If we check the
"5-Yr Restated" financials on Morningstar.com, we can see that revenue has grown very nicely from $238.9 million in 1998, and increased steadily to $766.4 million in the trailing twelve months.
Earnings have been a bit erratic increasing from $.40/share in 1999 to $.69/share in the trailing twelve months. Free cash flow, which was negative at $(11) million in 2000, dropped to $(34) million in 2001, then increased to $46 million in 2002 and $52 million in the trailing twelve months.
This company does have some long-term debt, but the cash is adequate at $38.8 million and other current assets total $149.2 million, more than enough to cover the $71 million in current liabilities and make a small dent in the $498.8 million in long-term liabilities.
What about valuation? Looking at
"Key Statistics" on Yahoo.com, we can see that the market cap is a mid cap $817.5 million. (I always forget the cut-offs for these classifications...for your review Ameritrade has a nice
reference on capitalization...small cap under $500 million, Mid-cap: between $500 million and $3 billion, and Large-cap: over $3 billion.)
The trailing p/e is at 0, but the forward p/e is at 15.25 with a PEG (next 5 years estimated) at only 1.10. So valuation really isn't bad. There are 48.72 million shares outstanding with 47.40 million of them that float. Interestingly, there are 2.19 million shares out short representing 6.254 trading days as of 4/7/04, or 4.62% of the float. We may be in the midst of some coverage of this short position...or a bit of a squeeze.
No cash dividend is paid...and no stock dividend is reported on Yahoo.
Looking at a
"Point and Figure" chart we can see that the stock broke through a resistance level in September, 2003, and has been trading higher since. This looks nice and not over-extended in my opinion.
Overall, I like this stock just fine. With all of the politics over healthcare, I am never particularly enthusiastic about hospital stocks, but the numbers scream for our attention, and I try very hard to put aside personal bias and look at the company's performance. Of course, I am waiting to sell a portion of a stock at a gain before I can dip my toes back into the investing waters!
Thanks again for stopping by! If you have any questions, comments, or words of encouragement, please feel free to email me at bobsadviceforstocks@lycos.com
Happy Monday everyone!
Bob
Sunday, 2 May 2004
"A Reader Writes" What about RHI?
Hello Friends! It is Sunday evening, and I am off to get some sleep in a minute...just checking the mail and had the good fortune to receive another note from Jason M. If you or anyone else has questions or would like to start a discussion on this blog, please write me at bobsadviceforstocks@lycos.com In any case, Jason M. writes:
Hey Bob,
I just read the article on the CNBC website on job
growth and companies that make money helping other
companies hire workers. the article made a lot of
sense to me.
Anyhow on with the point. One of the stocks they
mentioned in the article was RHI. The charts looked
pretty decent on this stock. What do you think of it?
Also, how does News articles like this effect a stock?
J.Jason, I found the
Jim Jubak article you referred to in the email. Jim is a very smart professional and I of course defer to his judgement. Some of the stocks he mentioned included Robert Half (RHI), Administaff (ASF), Labor Ready (LRW), Gevity HR (GVHR), and Manpower (MAN). Of these stocks, I have only
posted Gevity HR on my blog on March 29, 2004. But let me take a look at Robert Half (RHI) as well!
As you probably know, the first thing I like to do is to look at the latest quarterly earnings report. On April 22, 2004, Robert Half (RHI)
reported 1st quarter 2004 earnings. Revenues rose nicely to $572.3 million from $473.2 million in the same quarter in 2003. In addition, earnings came in at $15.4 million or $.09/share vs a loss of $(3.4) million or $(.02)/share last year. This was a nice quarter for RHI. (so far so good!)
The next place for me to check a stock is Morningstar.com. On that website, I check under the "5-Yr Restated" financials. For RHI, this is
located here. Now what I do, is not necessarily the only way to assess a stock, and my picks do NOT guarantee success nor do I claim to be better at stock picking than the next person. However, looking at the revenue picture long-term for RHI, we can see that the company peaked in 2000 at $2.7 billion and then dropped to a low of $1.9 billion in 2002. They have stayed at that level in 2003 with $2.0 billion in revenue. Personally, I like to see a steady increase in revenue over the last five years. Like I said, a turn-around may result in a large price appreciation, but that is more speculative than I prefer to be, and like to see STEADY growth year after year! So on this point, RHI doesn't make the cut.
What about earnings? Again RHI peaked at $1.00 in 2000, and dropped all the way to $.01/share in 2002, improved to $.04/share in 2003, but still is way BELOW peak earnings levels.
The company IS generating a nice level of free cash flow and has a beautiful (!) balance sheet, which per Morningstar.com, shows $376.5 million in cash and $322.1 million in other current assets vs. a moderate $188.9 million in current liabilities and $2.3 million in long-term debt. THESE numbers look great!
So again, RHI might be a GREAT investment at this time, especially if it is turning itself around and becoming more profitable. However, it is just NOT my style...so I am unable to endorse it. That does NOT mean you shouldn't buy any, it just means it doesn't fit into our criteria for picking stocks.
Indeed the
"Point & Figure" chart on RHI looks nice as well!
Certainly, good media coverage DOES help propel a stock upward. I do not think that just a plug in a story is enough to continue the price move. I believe strongly that good fundamentals underlying the stock price are what determines the long-term price action of any company.
Thanks again for stopping by! If you have any additional questions, comments, or words of encouragement, please feel free to email me at bobsadviceforstocks@lycos.com
Bob
"Seven Months Ago" A longer term view examining the week of October 6, 2003
Hello Friends! It is great to be kicking back and enjoying the weekend! I hope you are having a wonderful Sunday as well! First, the disclaimer: Please remember to do all of your own work on stocks discussed as I am an AMATEUR investor, and also, PLEASE consult with your investment advisors as I am not one, and the investments discussed on this website may or may not be timely, profitable, or even appropriate for your investment needs! There, I just wanted to get that out of the way! As I like to do on weekends, this is an opportunity when the market is closed to pause and reflect, to see how the picks that I have made in the past have ACTUALLY performed! This week, I am up to the week of October 6, 2003. Soon (!) I will be blogging for a year and will need to see if I drop the seven week follow up and stay with about a 7 month, 12 month review. If you have any suggestions, or other comments, as always, please feel free to email me at bobsadviceforstocks@lycos.com
Back to business.
The first selection that I
posted on Stock Picks Bobs Advice that week was Inter Parfums (IPAR) which was listed at $10.98 on 10/6/03. IPAR closed at $22.00 on 4/30/04 for a gain of $11.02 or 100.3% during this period!
Insofar as recent news, IPAR
4th quarter 2003 results on 3/9/04. Net sales rose 33% (23% when adjusted for currency exchange rates) to $49.2 million from $37.1 million. Net income increased 34% to $3.7 million from $2.8 million, and diluted earnings/share increased 29% to $.18/share from $.14/share. This company is doing just fine!
The second stock picked that week was Fargo Electronics (FRGO) which
was posted for the Blog on 10/6/03 at a price of $14.28. FRGO closed 4/30/04 at $9.65 for a loss of $(4.63) or (32.4)%.
On April 21, 2004, FRGO
reported 1st quarter 2004 results. Net sales for the quarter ended March 31, 2004, were $15.6 million compared with net sales of $15.5 million in the same quarter in 2003. Net income for the quarter was $1.4 million or $.11/share vs $1.3 million or $.10/share the prior year. The results were at least steady if not spectacular growth.
I
posted Regis (RGS) on Stock Picks Bobs Advice on 10/7/03 at a price of $35.17. RGS closed at $43.42 on 4/30/04 for a gain of $8.25 or 23.5%.
On 4/20/04, RGS
announced 3rd quarter 2004 results. Consolidated revenues increased 14% to $481 million from $422 million during the quarter ended March 31, 2004. Earnings increased to a record $25.6 million from $20.9 million or $.55/diluted share compared to $.46/diluted share last year. On a same-store sales basis, they reported a 2.8% increase in same-store sales. These, in my humble opinion, are all solid results!
O.K., three down and four to go!
On October 7, 2003, I also
posted CVS Corp (CVS) on the blog at a price of $33.57. CVS closed at $38.63 on 4/30/04 for a gain of $5.06 or 15.1%.
Looking through the news for the latest earnings report,
CVS announced 4th quarter 2003 results on 2/12/04. During the quarter, net sales increased 18% to $7.45 billion with same-store sales increasing 7.4%. Same-store pharmacy sales were up 9.1% during the period and earnings came in at $263.4 million or $.64/share up from $.49/share the prior year. These were nice results!
Ceradyne (CRDN), the armor manufacturer, was
posted on Stock Picks Bobs Advice on 10/8/03 at a price of $30.50. CRDN split 3:2 on 4/8/04, thus our "pick price" was $20.33. CRDN closed on 4/30/04 at $28.71 for a gain of $8.38 or 41.2%.
On 4/22/04, CRDN
announced 1st quarter 2004 results. Sales for the quarter ended March 31, 2004, jumped 91.3% to $36.7 million from $19.2 million the prior year. Net income was up 231.5% to a record $5 million or $.31/diluted share from $1.5 million or $.11/diluted share the prior year. The average # of shares increased to 16.3 million compared to 13.4 million the prior year due to the "follow-on public offering" in July, 2003. Clearly, the additional shares were NOT enough to water down what appears to be SPECTACULAR results!
Hang in there...two to go!
On October 9, 2003, I
posted NetGear (NTGR) on the blog at $17.88. NTGR closed on 4/30/04 at $10.85 for a loss of $(7.03) or (39.3)%.
On 2/12/04, NTGR
announced 4th quarter 2003 results. Net revenue increased 20.7% to $86.8 million. Fourth quarter net income dropped to $.12/share from $.15/share, although overall net income was up to $3.9 million from $3.4 million, the number of diluted shares ballooned to 31.6 million from 23.3 million the prior year. Apparently, this stock issuance and the resultant watering down of otherwise nice results is putting a damper on this stock!
LAST ONE!
On October 7, 2003, I
selected Infosys Tech (INFY) for the blog at $77.40. INFY closed at $80.74 for a gain of $3.34 or 4.3% during this period.
On April 13, 2004, INFY
announced quarterly results for the period ended March 31, 2004. Net profit grew 30% to 3.37 billion rupees ($77 million) from 2.59 billion rupees. They expect net sales also to grow 30 to 31% for the year ended March 31, 2004.
NOW, looking at ALL of the stocks for the week, I had an average gain of 16.1% for the week, with the gains supported by the large 100.3% gain on IPAR, and dragged down by the strong losses in FRGO (32.4)% and Net Gear (39.3)%. CRDN had a nice gain of 41.2% as did Regis at 23.5%. The other stocks had smaller gains.
Thanks again for stopping by! If you have ANY questions, comments or words of encouragement, please feel free to email me at bobsadviceforstocks@lycos.com Have a great Sunday everyone and a profitable week trading next week!
Bob
Saturday, 1 May 2004
"How are we doing?" A look back on the week of February 16, 2004
Hello Friends! Thanks so much for stopping by! As I always like to remind you, I am an AMATEUR investor so please do your own investigation of all stock investments discussed on this website and please discuss your choices with your financial advisor to make sure they are appropriate and timely for you!
It is Saturday and the good news is that the stock market in the United States did not actively drop today! (oh well...it is closed!) One of the things I like to do on weekends, and if you click on the calendar on the upper left of the blog, you can navigate through this and the preceding months, is to do a little retrospective analysis of past stock selections. Unfortunately, I DID post a selection on Sunday, February 15, 2004, that did NOT get reviewed last week, so I will add it on right here!
During the week I made five stock selections. The first
selection to be reviewed in The Sportsman's Guide (SGDE) which was listed on 2/15/04 at $21.64. SGDE closed on 4/30/04 at $20.301, for a loss of $(1.339) or (6.2)%.
The next pick was MarineMax (HZO) which was
listed on Bob's Advice on 2/17/04 at $26.52. HZO closed on 4/30/04 at $28.51 for a gain of $1.99 or 7.5%.
Marine Products (MPX) was
posted on Stock Picks Bob's Advice at $29.45 on 2/18/04. MPX had a 3:2 split so the resultant "pick price" was actually $19.64. MPX closed on 4/30/04 at $17.68 for a loss of $(1.96) or (10)%.
The fourth stock listed that week was Omnivision Technologies (OVTI) which was
Posted on Bobs Advice at $29.45 on 2/19/04. OVTI closed on 4/30/04 at $22.38, for a loss of $(7.05) or (24)%.
Finally, UniFirst (UNF) was
posted on Stock Picks Bobs Advice at $26.83 on 2/21/04. UNF closed at $29.50 on 4/30/04 for a gain of $2.67 or 10%.
Overall how did we do? (First remember that this past seven weeks was a pretty AWFUL time for all investors) I had two stocks gaining: MarineMax, up 7.5%, UnikFirst (UNF) up 10%. Otherwise, the other three stocks lost money, ranging from $(6.2)%, to a loss of $(24)%. Averaging in all of the percentage changes, I find an average loss of (4.54)%.
Thanks again for stopping by! If you have any questions, comments, or words of encouragement, please feel free to email me at bobsadviceforstocks@lycos.com
Bob
Friday, 30 April 2004
"A Reader Writes" How about your stock-selling strategy?
Hello Friends! Thanks again for stopping by....remember to do your own work on the stocks discussed and to always use your own investment advisor as I am an amateur investor who likes to write about stocks!
Jason M. wrote a follow-up question:
oh yeah i also wanted to go over your stock selling
strategy again.
so i may or may not understand it. you sell when you
lose 8% in a stock. you sell 20% of you holdings in a
cokpnay that has gained 20%. you sell another 20% of
your holdings when it has gained 40% and so on and so
forth up to 100%. is that correct?
J.Jason, first of all thanks so much for your interest in my strategy. As you invest in stocks, I am sure you will develop some sort of strategy borrowing from here and there on the way. Much of my sell strategy is based on William O'Neill's "How to Make Money in Stocks" and the CANSLIM approach. That is, I like to sell for "negative" reasons in two situations, 1) when the stock is hitting an 8% loss or worse, regardless of when I purchased the stock, and 2), after making a profit in a stock, that is, having sold a portion of the stock at least one time, I will try to sell a stock BEFORE it goes back into the loss column.
When do I sell at a profit? In general, my approach is to sell the losers QUICKLY (at 8%) and sell the winners slowly, and partially. That is, when a stock has appreciated about 30-33%, so that it is about at 4/3 of its original value, I try to sell about 1/4 of the stock, thus leaving the orginal purchase value. Do you follow?
I try to repeat this selling at about a 60%, 90%, and 120% gain. After 4 such sales, and yes I have had some stocks where I have had this many sales, I am now trying to slow down my selling pace so that the actual $'s invested will grow. Thus, after 120% sell point, my next sell point is at 180% (and I sell a 1/4 of the remaining shares), 240%, 300%....etc.
Does this work? It has been working well for me. But it does require discipline because sometimes, quite frankly, I kind of fall in love with a stock...now don't go telling my wife or anything...but I HATE to sell a stock but I DO anyway. For instance my recent sale of Merit Medical....why I really LIKE that stock....but the price declined and out it went!
I hope that answers your question. If you have any questions, or if anyone else has questions, PLEASE feel free to email me at bobsadviceforstocks@lycos.com and I will try to get right back to you!
Bob
April 30, 2004 Intuitive Surgical (ISRG)
Hello Friends! Thanks again for stopping by if this is a return visit. If you are new to the visit, consider visiting the
Bob's Advice for Stocks main website where I go over some of the criteria I use to look at stocks. You will find links there for my 2003 and 2004 selections and the updated prices. So go ahead and explore. Please remember that I am an amateur investor myself and just like to write about stocks. Thus, you should do your own investigation on all financial matters discussed on this site and discuss any investment decisions with your investment advisors to make sure they are timely and appropriate for you. For questions, or comments, please email me at bobsadviceforstocks@lycos.com
ANYHOW, now that I have THAT out of the way, phew....where was I? Oh yes, looking at stocks again today....so what else is new?.....and I came across what appeared initially to be a stock that wasn't quite meeting criteria, but the more I looked the more I liked! Intuitive Surgical (ISRG) is having a nice day today trading at $16.35 as I write, up $1.22 on the day or 8.06%. I do not own any shares of this company nor do I have any leveraged positions. (like options). According to the
Yahoo "Profile", ISRG "...manufactures and markets the da Vinci Surgical System, an advanced surgical system for use in performing what the Company calls intuitive surgery....The da Vinci Surgical System seamlessly translates the surgeon's natural hand movements on instrument controls at a console into corresponding micro-movements of instruments positioned inside the patient through small puncture incisions, or ports." Hey, is this COOL or what?
Guess what? What drove this stock higher was what we are seeing this time of year:
a good earnings report. They announced yesterday, 4/29/04, after the close, that their 1st quarter sales jumped 41% from $19.2 million for the first quarter of 2003 to $27.1 million for 1st quarter 2004. Net income came in at $.9 million or $.02/diluted share compared to a net loss of $(2.3) million or $(.12)/diluted share for the first quarter of 2003. We may be catching this company just at the CUSP of profitability....just as it turns from a losing venture into a profitable venture...I love stocks like that!
Looking at
"5-Yr Restated" financials on Morningstar.com, we find that revenue was negligible in 1998, $10.2 million in 1999 and has increased steadily to $85.2 million in the trailing twelve months.
The company HAS previously been losing money, with $(.94)/share lost in 2001, $(1.02)/share in 2002, and $(.37)/share in the trailing twelve months.
Free cash flow has been negative, but has improved recently from $(16) million in 2000, $(24) million in 2001, $(20) million in 2002 and $(11) million in the trailing twelve months.
Balance sheet-wise, ISRG has $35.4 million in cash and $39.4 million in other current assets, plenty to cover BOTH the $31.9 million in current liabilities and the relatively low level of $2.2 million in long-term liabilities.
Taking a look at
"Key Statistics" from Yahoo.com, we can see that this is a small cap stock with a market cap of $538.77 million. There is no trailing p/e, but a forward p/e (fye 31-Dec-05) isn't bad at 28.37. The PEG is a bit steep at 2.11. Price/sales also a bit rich at 5.50...(but this technology is amazing!)
Yahoo reports 33.32 million shares outstanding with 26.60 million of them that float. There is large short interest out there at 1.32 million shares representing 4.98% of the float and 8.386 trading days (!). This is up from the prior month's 1.22 million shares out short. No dividend is paid, and the last split, was a REVERSE 1:2 split in July, 2003. (see the previous post about splits).
Technicals? Looking at a
"Point & Figure" chart from stockcharts.com, we can see that this stock was actually trading lower until mid March, 2003, when it broke through a resistance level around $12. It then has basically been heading higher the last twelve months.
What do I think? This is FASCINATING technology. Real Star Trek stuff....operating remotely! And this company is SELLING the equipment! The valuation looks reasonable, the revenue growth is impressive, the balance sheet is fine, but they ARE just turning profitable. In addition, there ARE a bunch of shares out short...which may add to the squeeze on the upside. I may even buy a few shares.....I know, sit on my hands until I sell a portion at a gain...but then again....:)
Thanks SO MUCH for stopping by! If you have any questions, comments, or words of encouragement, please feel free to email me at bobsadviceforstocks@lycos.com
Regards!
Bob
"A reader writes" What does a stock split mean?
Hello Friends! Thanks again for stopping by. I got another email from Jason M. who writes:
Hey Bob,
As the one person in the world of advice that doesn't
make me feel bad for asking dumb questions, I would
like to throw yet another one your way.
What does a stock split mean and how does it effect a
stock?
Thnx again for everything.
J.Well Jason, I was always told there are NO dumb questions, and I believe that is the case. Many of us have assumptions about our understanding of things that may be totally off base, so if you are not sure about something, never hesitate to ask! And you KNOW I like to get emails!
Basically, a stock split comes in the form of a "dividend." That is, a distribution to current stock holders of additional shares of stock. Sometimes, and I will comment on this in a second, the split is what is called a "reverse split" where actually shares are "redeemed" from shareholders so there are actually LESS stocks outstanding. But the stock distribution, or additional shares, is the usual route.
Let me try to explain this with a simplified example. Let's assume we have a company that makes widgets and has ten shares outstanding. In other words, anyone who has one of the shares owns 10% of the company. For argument's sake, let's say that the world figures this company is worth $100. That is, if you could buy all of the ten shares, it would cost you $100. Thus, each of the ten shares would be worth $10. The total value of the shares, calculated by multiplying the price/share by the # of shares would be $100 or as we like to refer to it, the "Market Capitalization" of this widget company is $100. I hope you are following me!
Next, let's say that the CEO of the company and the shareholders decide that they wold like to have more people have shares of stock....and that they would like the stock pricer to be cheaper so more people could own shares. What they decide to do is to distribute an additional 10 shares to existing shareholders. This doesn't actually make the company worth any more! They are just sending out pieces of paper, stock shares, to each shareholder. In fact, each shareholder would be entitled to one additional share of stock. Thus, there would be a total of twenty shares in our example, and since the company presumably is not worth any more, the value of the company would be $100/20 or $5/share.
This is what happens in real life. With a 2:1 stock split, this means that for each share you had previously, you will now have two shares. This is also called a 100% stock dividend. Other types of split are also possible. For instance, a 50% stock dividend means that for every TWO shares you have, you will now have THREE or, it may also be referred to as a 3:2 split.
Sometimes when stock prices get incredibly cheap, into the pennies sometimes, the company may choose to do a REVERSE stock split to increase the price of the stock. How does that work? For instance if you have a 1:5 split, a reverse split, you would be issued a new share and five old shares would become worthless. The price of the stock would presumably also increase five-fold not because the company was WORTH any more, but just because the SAME value of the company was now divided among FEWER shares.
PHEW....I didn't mean to go on so long. I hope you followed my discussion. I know you had another question, and I will get to that shortly!
Thanks so much again for inquiring and I hope that my answer was helpful to you! If you or anyone else has any other questions, I would be happy to try to give you an explanation (as long as I understand the answer!)...just email me at bobsadviceforstocks@lycos.com
Bob
Thursday, 29 April 2004
April 29, 2004 Fisher Scientific Intl (FSH)
Hello Friends! It is late again and I just want to squeeze in a quick post. I mean if you guys weren't stopping by, then I wouldn't feel the NEED to post...but if somebody is going to read this stuff....well then somebody (me) is going to have to WRITE it!!! jk Anyway, as always, PLEASE do your own investigation of all of the stock information I write on this website as I am an AMATEUR investor, passionate at that, and you really need to check with your investment advisors to make sure that the investments discussed are appropriate, timely, and a good decision for you to make.
I came across Fisher Scientific (FSH) earlier today and really meant to post it earlier but one thing led to another...you know how that is! Anyhow, FSH had a nice day today in an otherwise mediocre market, closing at $58.60, up $2.06 (3.64%) on the day. According to the
Yahoo "Profile", FSH "...serves science through more than 600,000 products and services that it offers to more than 350,000 customers located in approximately 145 countries." Yahoo goes to point out that Fisher "...primarily serves the scientific research, clinical-laboratory and safety markets." I do NOT own any shares or have any leveraged position in this stock.
What drove the stock higher, as is the case with most of our stocks this time of year, was an
earnings report that was released after the market close yesterday. Sales for the first quarter 2004 ended March 31, 2004, increased 21% to $1.01 billion from $.83 billion the prior year. Even EXCLUDING the positive effects of the exchange rate, sales still came in with an 18% growth to $983.5 million. First quarter net income came in at $34.6 million or $.51/diluted share compared to a net loss of $(0.9) million or $(.02)/diluted hsare in the first quarter of 2003.
Looking at the
"5-Yr Restated" financials from Morningstar.com, we can see that revenue has grown steadily from $2.5 billion in 1999 to $3.6 billion in the trailing twelve months. Earnings have been a bit erratic but have grown from $.55/share in 1999 to $1.29/share in the trailing twelve months.
Free cash flow has been solidly positive and slowly increasing with $119 million in 2001, $115 million in 2002, and $138 million in 2003.
Balance sheet-wise, FSH has $83.8 million in cash and $927.0 million in other current assets, enough to cover the $648.5 million in current liabilities AND make a dent in the $1.6 billion in long-term liabilities.
If we look at
"Key Statistics" from Yahoo, we can see that the Market Cap is $3.74 billion. The trailing p/e is rich at 45.25, but the company is expected to continue its rather fast growth so the forward p/e (fye 31-Dec-05) is only 17.60. The PEG is at 1.40 which isn't bad and the price/sales is even nicer at 1.01.
There are 63.79 million shares outstanding with 58.00 million of them that float. Currently there are 7.58 million shares out short, representing 13.08% of the float, or 4.782 trading days. In my opinion, whenever we get over 1 or 2 trading days, the amount of the short interest becomes increasingly significant, as the risk of a 'short squeeze' increases.
No cash dividend is paid and the last stock split was a 5:1 reported on Yahoo in April, 1998.
How about technicals? Looking at a
"Point and Figure" chart, we can see that FSH was trading sideways between 2001 and early 2003. Then in November, 2003, FSH broke through a resistance level at about $32 and has traded higher rather strongly since.
What do I think? I actually like this stock a lot. The p/e isn't too bad in light of the growth, and the PEG is reasonable. They are cash flow positive with a solid balance sheet. The only thing holding me back (lol) is the fact that I DON'T have any CASH!!! My account is in margin in a correcting market, and I am in the "raise cash" mode....at least insofar as new investments are concerned. I will wait until I sell a portion at a nice gain before adding another position.
Thanks so much for stopping by and visiting. If you have any questions, comments, or words of encouragement, PLEASE feel free to email me at bobsadviceforstocks@lycos.com
Bob
Newer | Latest | Older


