Stock Picks Bob's Advice
Sunday, 25 March 2007
ResMed (RMD) "Weekend Trading Portfolio Analysis"

RESMED (RMD) IS RATED A BUY
Hello Friends! Thanks so much for stopping by and visiting my blog, Stock Picks Bob's Advice! As always, please remember that I am an amateur investor, so please remember to consult with your professional investment advisers prior to making any investment decisions based on information on this website.
 One of the things I like to do on this blog is to share with you my actual holdings in my Trading Portfolio, my actual trades, and the results of such activity. I started this a bit over a year ago, realizing that I hadn't been keeping you all posted as well as I should on what my actual stocks I own have been doing, and how I have been managing with them.
Two weeks ago I wrote up my Quality Systems (QSII) holding. Going alphabetically, I am up to ResMed (RMD) and shall try to update you on this position. I had some interesting comments on that entry and they were not entirely without merit. I should point out that all sales that I make have negative consequences of both the cost of the transactions (I use a discount broker but that is really necessary if you are going to make the many transactions that I make) and you also are going to incur tax consequences.
Furthermore, I write this blog not trying to assert that this is the only way, or even the best way to invest. I write this as my own personal journey through the investing world, sharing with all of you my thoughts and perspectives on investing. There are many other smarter minds out there, there are other approaches to identifying stocks and averaging up on stocks or whatever. This is merely my diary of my own technique, a technique that I have adopted after reading of many other approaches and experimenting in a mostly 'seat-of-the-pants' system of investing. My disciplined approach has been working well for me. I hope that all of you are able to learn from my successes and failures and utilize as many of my techniques as you find profitable.
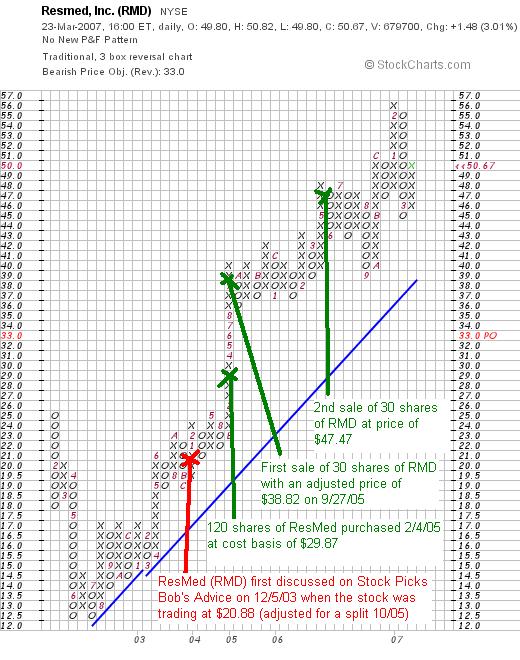
I first discussed ResMed on Stock Picks Bob's Advice on December 5, 2003, when the stock was trading at $41.76/share. This represents a price of $20.88 adjusted for the 2:1 stock split in October, 2005.
I currently own 150 shares of ResMed (RMD) that were acquired 2/4/05, at a cost basis of $29.87/share. My original purchase was reported on Stock Picks on the same day, February 4, 2005, as 120 shares purchased at $59.67. RMD had a 2:1 stock split on October 3, 2005, making my effective stock purchase price actually $29.87.
ResMed closed at $50.67 on March 23, 2007, giving me an unrealized gain on these remaining shares (I have sold portions of my holding as the stock has appreciated) of $20.80 or 69.6% on my current holding. My over-all performance with this stock is lower, because I have taken smaller gains, at both 30% and 60% levels on portions of my original purchase.
In fact, I sold 30 shares of my original holding (using my original strategy of selling 1/4th of my remaining shares at targeted appreciation points) on 9/27/05 at a price of $76.09/share, representing a gain of $16.42 or 27.5%, leaving me 90 shares before the 2:1 stock split. Then of my 180 shares, I sold another 30 shares of RMD on 5/5/06 at a price of $47.47, representing a gain of $17.60 or 58.9% above my original cost.
Going forward, my planned next sale would be 1/6th of my 150 shares or 25 shares at a 90% appreciation point or 1.90 x $29.87 = $56.75. On the downside, I plan on selling all of my remaining shares if the stock should trace back to a 30% appreciation point (1/2 of my highest sale point of 60%) or 1.30 x $29.87 = $38.31/share.
So can I calculate what my actual return has been (still not taking into consideration tax issues) on both my realized and unrealized holdings? To summarize, I purchased 120 shares of ResMed at $59.67 = $7,160.40. I have sold two portions of this stock, 30 shares in 9/27/05 with proceeds of $2,329.25 (price of $38.82 adjusted for the 10/05 2:1 split), and 30 shares 5/5/06 with proceeds of $1,424.20 (price of $47.47), giving a sum of $3,753.45 of sales. I have 150 shares remaining of RMD and with Friday's closing price of $50.67, that means I still have $7,600.50 of stock left. Thus if I add together the $3,753.45 with the $7,600.50 = $11,353.95. This represents a gain of $11,353.95/$7,160.40 = 1.586 or 59% appreciation on my original purchase. This is less than the 69.64% appreciation on the remaining shares but reflects the shares already sold and is fairly close to that figure as well!
I hope this more clearly reflects my selling strategy for this stock. I want things to be as transparent as possible with all of my discussions. I am not trying to overstate my performance which I believe stands on its own just fine!
Let's take a little closer look at ResMed and see if it still deserves a spot on the blog.
What exactly does this company do?
According to the Yahoo "Profile" on ResMed (RMD), the company
 "...engages in the development, manufacture, and marketing of products for the screening, treatment, and long-term management of sleep-disordered breathing and other respiratory disorders. It offers medical equipment for sleep-disordered breathing (SDB), which includes obstructive sleep apnea (OSA) and other respiratory disorders that occur during sleep. The company�s products include airflow generators; diagnostic products; mask systems; headgear; and other accessories, including humidifiers, cold passover humidifiers, carry bags, breathing circuits, Twister remote, the Aero-Click connection system, and the AeroFix headgear."
How did they do in the latest quarter?
On February 6, 2007, ResMed announced 2nd quarter results. For the quarter ended December 31, 2006, revenue came in at $178.4 million, up 22% over the same quarter ended December 31, 2005. Net income was $29.0 million, up from $22.3 million last year, and diluted earnings per share came in at $.37/share, up from $.30/share the prior year.
The company came in a little light on revenue as analysts expectations were for revenue of $182 million.
How about longer-term financial results?
Reviewing the Morningstar.com "5-Yr Restated" financials on ResMed, we can see the beautiful progression in revenue from $204.1 million in 2002 to $607 million in 2006 and $675.5 million in the trailing twelve months (TTM).
Earnings have also steadily increased from $.55/share in 2002 to $1.16/share in 2006 and $1.32/share in the TTM. During this time, while revenue has been up over 200% and earnings have climbed about 100%, the number of shares outstanding has grown just a little over 20% from 64 million to 77 million in the TTM. This is an acceptable dilution of shares from my perspective. No dividends are paid.
Free cash flow has been a little erratic with $19 million in 2004, growing to $31 million in 2005, then falling to a negative $(4) million in 2006, but rebounding to a nice $27 million in the TTM.
The balance sheet is solid with $254.6 million in cash and $336.3 million in other current assets. This total of $590.9 million can easily cover both the $163.7 million in current liabilities as well as the $117.9 million in long-term liabilities combined. Looking just at the current ratio, comparing the total current assets of $590.9 million to the $163.7 million in current liabilities yields a very strong ratio of 3.61. (Generally I consider current ratios of 1.25 or higher as being 'healthy' all things considered.)
What about some valuation numbers?
Examining the Yahoo "Key Statistics" on RMD, we find that this is a mid-cap stock with a market capitalization of $3.89 billion. The trailing p/e is a bit rich at 38.18, with a forward p/e (fye 30-Jun-08) estimated at 25.72. The growth is expected to be vigorous going forward with a PEG (5 yr expected) estimated at 1.46. (PEG's of 1.0 to 1.5 are reasonable from my perspective.)
According to the Fidelity.com eresearch website on RMD, the Price/Sales (TTM) for RMD is a very reasonable 5.65 relative to the industry average of 30.09. Again, according to Fidelity, the Return on Equity (TTM) is just a bit under the industry average of 15.87%, with RMD coming in at 13.64%.
Finishing up with Yahoo, we find that there are 76.80 million shares outstanding with 74.38 million that float. Currently, there is a bit of a significant short interest on this stock with a short ratio of 5.3 trading days or 4.8% of the float. I generally use 3 days for my own idiosyncratic cut-off for significance. If the company continues to report good news, these short-sellers may well be 'squeezed' as they scramble to cover their 'shorts' buy buying shares on the open market. This could add to any price rise if such good news is forthcoming.
No dividend is paid, and as I noted above, the last stock split was a 2:1 split on October 3, 2005.
What does the chart look like?
If we review the "Point & Figure" chart on ResMed from StockCharts.com above, I think we can see that except for technical weakness back in January, 2002, through July, 2002, when the stock declined from $25 to a low of $12.50, the stock has been on a 'tear' with steady price appreciation the past four or five years. This has been a very strong stock and a strong chart to match!
Conclusion: What do I think?
Well, I still like this stock a lot. In fact, I own shares in this stock! And you should certainly take that into consideration. I don't talk much about my own personal life, but I can tell you that I personally use one of these CPAP machines and have slept better (when I am not blogging!) and have let my wife sleep better as well! The stock itself has been kind to me and represents the kind of stock I believe belongs in my portfolio.
The last quarter was solid. The past five years have been terrific. Valuation is a bit rich but with the steady performance of this stock, may well be worth the premium.
Thanks so much for stopping by and visiting! If you have any comments or questions, please feel free to leave them on the blog or email me at bobsadviceforstocks@lycos.com. If you get a chance, be sure and visit my Stock Picks Podcast Website. Hopefully, I shall also get a chance to write up and report on a new stock on the Podcast this week!
Bob
Posted by bobsadviceforstocks at 10:52 PM CDT
|
Post Comment |
Permalink
Updated: Tuesday, 27 March 2007 3:20 PM CDT
Saturday, 24 March 2007
IHS (IHS)
Hello Friends! Thanks so much for stopping by and visiting my blog, Stock Picks Bob's Advice! As always, please remember that I am an amateur investor, so please remember to consult with your professional investment advisers prior to making any investment decisions based on information on this website.
 I purchased shares in IHS on Thursday, March 22, 2007, and I wrote it up here on the blog. I promised you that I would write up a few things about this stock, which actually has traded a bit lower since I purchased shares at $44.07. (IHS closed at $42.10 on 3/23/07) so thus far it hasn't been a knock-out purchase, but I still like the numbers and want to review the company for all of you readers here on Stock Picks!
First of all,
What exactly does this company do?
According to the Yahoo "Profile" on IHS, the company
 "...provides technical information, decision-support tools, and related services to customers in the energy, defense, aerospace, construction, electronics, and automotive industries worldwide. It operates in two segments: Energy and Engineering. The Energy segment develops and delivers oil and gas industry data on exploration, development, production, and transportation activities to energy producers and oil companies. It also provides decision-support tools and operational, research, and strategic advisory services to these customers, as well as to utilities and transportation, petrochemical, coal, and power companies. The Engineering segment provides solutions, such as technical specifications and standards, regulations, parts data, design guides, and other information to customers in its targeted industries. This segment serves defense, aerospace, construction, energy, electronics, and automotive industries."
How did they do in the latest quarter?
It was the announcement of 1st quarter 2007 results after the close of trading on Wednesday, March 21, 2007, that drove the stock higher on Thursday. Revenue for the quarter ended February 28, 2007, came in at $152.6 million, up 18% over the first quarter 2006 revenue figure of $129.9 million. Net income for the quarter increased 36% to $18.4 million or $.32/diluted share, up from $13.5 million or $.24/diluted share in the same quarter last year.
In addition, the company raised guidance:
"IHS revises guidance upwards to revenue growth in the range of 11 to 13 percent and adjusted EBITDA growth in the range of 18 to 22 percent for the full year ending November 30, 2007."
The adjusted earnings per share of $.38 beat analyst expectations of $.35/share and the revenue of $152.6 million also beat expectations of $148 million in revenue.
From my perspective, this was a very strong earnings report with strong revenue and earnings growth, beating of expectations, and the raising of guidance. However, the stock price was hit on Friday, apparently from a non-event (imho) of a shareholder filing to sell 3.8 million shares in a public offering. At this time, the market seems to have absorbed this news and the stock is trading fractionally higher in after-hour quotes.
How about longer-term financial results?
If we review the Morningstar.com "5-Yr Restated" financials on IHS, we find that the company has steadily been increasing revenue from $339 million in 2002 to $551 million in 2006. Earnings were $.99/share in 2006 and from the latest report are continuing to show strong growth. (There are limited figures available on Morningstar) IHS has a long history, but as noted in the history, underwent an initial public offering on the NYSE on November 11, 2005.
The company reported 56 million shares in 2006 and 59 million in the trailing twelve months (TTM). The company reported $63 million in free cash flow in 2004, $43 million in 2005 and $105 million in 2006.
The balance sheet appears solid with $182.1 million in cash and $198.8 million in other current assets. This total of $380.9 million, when compared with the $338.5 million in current liabilities yields a current ratio of 1.125. While not as strong as many of the company reviewed here, this current ratio does not reflect the very low level of long-term debt totaling $40.6 million and the nice free cash flow.
What about some valuation numbers?
Looking at the Yahoo "Key Statistics" on IHS, we find that the company is a mid cap stock with a market capitalization of $2.47 billion. The trailing p/e is a bit rich at 42.31, with a forward p/e (fye 30-November-08) estimated at 24.91. The company is growing rapidly enough that the PEG (5 yr expected) is estimnated at 1.70. While preferring a value of 1.0 to 1.5, this isn't too far out of line for me.
Checking the Fidelity.com eresearch website, we find that the Price/Sales TTM ratio is indeed a bit steep at 4.32 compared to an industry average of 2.39. The company is also a bit richly priced in terms of profitability, with a Return on Equity (ROE) (TTM) of 11.15%, compared to an industry average of 14.11%.
Returning to Yahoo, we find that there are 58.79 million shares outstanding with only 23.43 million that float. As of 2/12/07, there were 834,300 shares out short representing 2.50% of the float or 4 trading days of volume (the short ratio). While more than my own 3 day rule for significance, this doesn't appear to be a big factor in the recent stock price rise.
No dividends are paid and no stock splits are reported on Yahoo.
What does the chart look like?
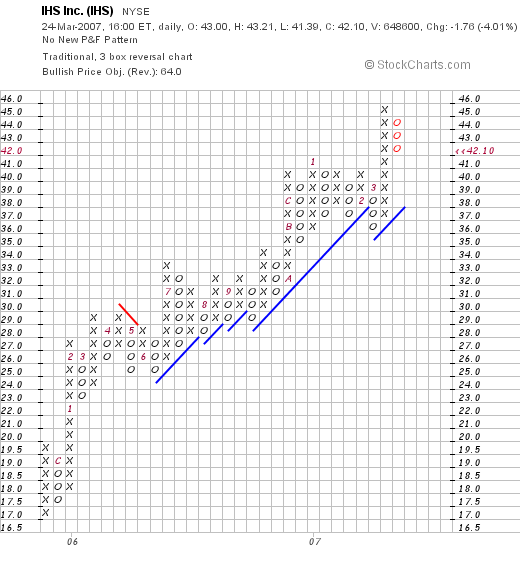
If we look at the "Point & Figure" chart on IHS from StockCharts.com, we can see that the stock has moved steadily higher since first trading at $17 in late 2005, when it came public. The chart simply looks strong to me and does not appear to evidence any particular weakness.
Summary: What do I think?
Well, I liked this stock enough to buy some shares :). Seriously, with the big move in Bolt (BTJ), I do believe I was biased enough to pick this engineering firm with ties to the energy business. Their latest quarter was great with solid revenue growth and earnings growth that beat expectations, and raising of guidance into the upcoming year. That is often enough to propel a stock higher. Meanwhile I am down a bit on the purchase, but the company is still interesting. However, valuation is a bit rich and the balance sheet, while solid, could be stronger with more current assets vs. the current liabilities. The rest looks nice.
Thanks again for visiting my blog! If you have any comments or questions, please feel free to leave them on the website, or you can email me at bobsadviceforstocks@lycos.com
Have a great weekend everyone!
Bob
Thursday, 22 March 2007
IHS (IHS) "Trading Transparency"
Hello Friends! Thanks so much for stopping by and visiting my blog, Stock Picks Bob's Advice! As always, please remember that I am an amateur investor, so please remember to consult with your professional investment advisers prior to making any investment decisions based on information on this website.
With the third partial sale of Bolt (BTJ), this gave me a "permission slip" to add a new position in my Trading Account. Looking through the list of top % gainers on the NYSE today, I came across IHS (IHS), an oil industry related company making a nice move higher today on the back of solid earnings news.
With my permission slip in hand :), I went ahead and purchased 120 shares of IHS at $44.07. I shall try to post up an entry on this company as soon as possible to explain my rationale for this selection. Meanwhile, I wanted to keep you posted with my progress for the sake of 'transparency'. As I write, IHS is trading at $44.04, up $4.08 or 10.21% on the day.
Wish me luck!
Bob
Bolt Technology (BTJ) "Trading Transparency"
Hello Friends! Thanks so much for stopping by and visiting my blog, Stock Picks Bob's Advice! As always, please remember that I am an amateur investor, so please remember to consult with your professional investment advisers prior to making any investment decisions based on information on this website.
A few moments ago I sold 34 shares of my Bolt (BTJ) holding at a price of $33.08. These shares were purchased 1/12/07 at a cost basis of $17.44/share. Thus, I had a gain of $15.64 or 89.7% on this sale. My target was a 90% gain, which at the time I entered the order, Bolt had reached.
This is my third sale of Bolt, having sold 50 shares on 2/23/07 with proceeds of $1,148.01 at a price of $22.96, representing a gain of $5.52 or 31.7% (my targeted 30% appreciation point), a second sale on 3/12/07 of 41 shares with proceeds of $1,165.71 at a price of $28.43, representing a gain of $10.99 or 63% since purchase (my targeted 60% 2nd appreciation point), and today's sale of 34 shares with proceeds of $1,124.70, at a price of $33.08, representing an appreciation of 89.7% (virtually at my 90% 3rd sale point.)
My strategy shall be to sell another 1/6th of remaining shares or 175/6 = 29 shares if the shares should hit my 4th targeted sale point on the upside at a 120% appreciation point. This is calculated by multiplying 2.20 x $17.44 = $38.37.
On the downside, I allow a stock that has been sold more than once to decline to 50% of its highest appreciation sale, or since I have sold at a 90% appreciation point, I would unload ALL remaining shares if Bolt should decline to a 45% appreciation point, which calculated, works out to 1.45 x $17.44 = $25.29. I always also reserve the right to sell all remaining shares on the back of any announced fundamentally bad news.
In terms of portfolio management, since this is a 'good news' sale, which for me is a sale at an appreciation event instead of a 'bad news' sale on a decline or fundamentally bad news announcement, and since I am below my 25 position maximum (currently at 17 positions), I thus have a 'permission slip' to start looking for a new position to add today!
And as I like to always say :), that nickel is burning a hole in my pocket already! Thanks so much for stopping by and visiting! If you have any comments or questions, please feel free to leave them on the blog or email me at bobsadviceforstocks@lycos.com.
Bob
Readers Write: "Software, Banks Stocks, and what about this stock (SIMO)?"
Hello Friends! Thanks so much for stopping by and visiting my blog, Stock Picks Bob's Advice! As always, please remember that I am an amateur investor, so please remember to consult with your professional investment advisers prior to making any investment decisions based on information on this website.
 I haven't been writing up many new stocks the past few days. In fact, last weekend I missed my review (I can tell you that all the 3 or 4 stocks I was to review from that week a year ago actually did poorly, but I shall get you the details hopefully this weekend.) There are a lot of things I need to take care of around my house and I suspect I shall be laying a bit low the next few days or so. But I did want to get to a few letters I received and answer the comments the best I can.
I always appreciate receiving comments and communication from people who stop by and visit my blog. I truly am an amateur investor. I don't have all or even am sure that my answers are correct or the best response to your inquiries. So please do your own homework on all of this. My stock strategy has been working for me. And I enjoy sharing with you my own peculiar approach to picking stocks and managing my portfolio. This blog has helped me develop my own discipline in dealing with the stock market. I now know what I am going to do if stocks soar (as they did yesterday) or collapse (as they did a couple of weeks ago). I am thankful to all of you who have written in suggestions and have added comments to these discussions.
Back to the subject :).
First letter from Steven T. who wrote from Frankenmuch, Michigan:
"Bob, Just came across your website. Wow! What agreat website! Packed with information.
Was wondering if in all your past postings if there are ones( dates) that you could drect me to where you may have discussed bank stocks. I am an avid bank stock investor and am always on the look out for information on them. Am particularly interested in regional/community banks.
Sincerely,
Steven T"
First of all, thanks for you comments. There are indeed a lot of 'stuff' packed into this website. But the organization is certainly lacking. But I can save you the search. In general, I haven't been writing up financials or bank stocks on the blog. I don't have a good handle on how to evaluate these types of companies. My approach to using Morningstar.com works well with other companies, companies that make 'widgets' or sell 'stuff' at the retail level.
That certainly doesn't mean that bank stocks, especially regional/community banks aren't a GREAT investment--perhaps. It just means I don't have an opinion on them and haven't been buying any. They may well be the GREATEST place to invest! In fact, if you have an approach to buying regional/community banks, and would be kind enough to share with me and my readers your technique, please write in and I would be happy to post it---and yes, consider using it as well :). My particular approach is NOT necessarily the best way to pick stocks. I do not want to ever say that. I am just sharing with all of you some stocks that meet my own particular approach of examining investments.
Next letter.
Jim C. wrote:
"Dear Bob,
Stumbled across your website and found it interesting. You describe yourself as an amateur stock picker so I quess that would put me at the embryonic stage. Been wanting to get involved in securities investing for a quite a while now and think that once I've finished reading some of my preliminary books to start my education that I would like to handle my own portfolio because no one will care more about my IRA and retirement funds more than me. My question is do you have a recommendation for a stock research program for beginners to experienced investors? I've been to seminars pitching "Market Investors", had a hedge fund manager recommend the "Worden Brothers TC 2000" and have heard good and bad about both but I just want to ask around as much as possible for any good software programs that can help with the research and provide good solid, legitimate recommendations for investment. I'm sure you're busy with more important issues on your blog but if you could find the time to help a late starting retirement embryo like me I'd sure appreciate it. Thankyou.
Jim C"
Jim, thanks for writing. And no, I DON'T have more important things to write about than to discuss a great question with a reader.
Unfortunately, like the prior reader's inquiry, I am going to tell you 'I don't know.'. In other words, I don't use any of that fancy investment software to come up with my own stock picks. I don't even automate my buys and sales in my own investment account. I manually go through the list of stocks and my brokerage house will let me know what % gain or loss I have. I then figure out (in my head) whether I need to sell a stock at a loss or a gain.
When I go to buy a stock, I manually go through the lists of top % gainers. I then go over to Yahoo, or Morningstar.com, or Fidelity.com, or wherever I need to go online to get the news or information. On each entry I post these links.
So I don't have an opinion on software because I don't use any. That does not mean that software isn't a GREAT option. It might be. It just means that since I don't use any of these programs, I don't have an opinion on them. Let me know what you find out and what you decide! And if any of you readers have comments or suggestions for Jim, PLEASE leave them on the comments right here on the blog or email me at bobsadviceforstocks@lycos.com and I can share with Jim your ideas.
Finally, I had an email from Marcus A. L. from Knoxville Tennesee who wrote:
"Hi Bob,
I'm still plundering through your website; I'm adopting you style of stock picking. I saw this stock (SIMO) on "today's top gainers list." Fundamentally speaking, everything looks great; if you have a minute or two let me know what you think of it. I'm going to wait until the stock dips, and I then I'm pulling the trigger. Hopefully she will continue to climb the market, although she is up over %100 for the year. No matter what happens, if she falls %8 i will get out asap.
Marcus A L"
Marcus, thanks for writing. First of all, I don't have any shares of Silicon Motion Technology ADR (SIMO). Let's take a very brief view of this stock and see if it fits my strategy. The stock, which is an ADR, meaning it is an American Depository Receipt (or foreign-based company) which is trading on some equivalent basis in the States, is actually based in Taiwan. That still does not 'disqualify' the stock as I have written up and owned ADR's myself. But that is a fyi anyhow. I am sure you knew this anyhow.
According to Morningstar, the company
"...develops and manufactures embedded graphics, digital signal processing, and multimedia companion chips. The company's graphics, video, and audio applications are designed for use in a wide variety of products, including handheld devices, wireless broadband terminals, LCD presentation devices, and other consumer devices."
So far so good.
Latest quarter: sales up 34% year over year and 13% sequentially. Nice. Net income up 36% year over year and 16% sequentially. Very nice. EPS came in at $.32 vs $.24 year over year and up 15% sequentially from $.28 prior quarter. Also very nice.
The Morningstar.com "5-Yr Restated" is a bit sparse with information. However, revenue does show steady growth, net income is growing, there aren't a lot of information (any) on earnings/share or total shares. I suspect that this ADR is new for trading in the United States. Free cash flow is growing and the balance sheet is solid.
You are basically correct. This is the kind of stock I usually do like. However, a couple of caveats, the data isn't very good on Morningstar.com, suggesting a recent IPO. Also, the chip business is notoriously cyclical with periods of booms and busts common. So be careful.
I do like you commitment to selling a stock at an 8% loss if needed. I am not quite in agreement with your strategy of waiting for the stock to dip. That doesn't mean it isn't a good way to do it. It just isn't how I buy stocks. I like to buy stocks when they are making a big % gain. Might be a little riskier than your approach. Also, I only buy when my own portfolio gives me a 'signal'. If you are just starting out, then this might well be a good stock to add into your portfolio. Thanks so much for writing.
Remember that I am truly an amateur. So you will need to do your own homework (as you are doing!) and develop your own rules to determine your own buys and sales. Pick something that works for you and stick to it! You won't be successful all the time. But if you are profitable most of the time you will be ahead of the pack.
Thanks again for all of you who took the time to write! Take everything I write with a 'grain of salt' and do your own homeowork and develop your own buying and selling strategy. If you have any comments or questions, please feel free to leave them on the blog or email me at bobsadviceforstocks@lycos.com.
Bob
Posted by bobsadviceforstocks at 7:36 AM CDT
|
Post Comment |
Permalink
Updated: Thursday, 22 March 2007 7:42 AM CDT
Saturday, 17 March 2007
"Looking Back One Year" A review of stock picks from the week of October 31, 2005

Hello Friends! Thanks so much for stopping by and visiting my blog, Stock Picks Bob's Advice! As always, please remember that I am an amateur investor, so please remember to consult with your professional investment advisers prior to making any investment decisions based on information on this website.
I like to write about stocks! But in order to find out what works and what doesn't I also find it important to 'look back' and review past stock picks and discussions about stocks. These reviews assume a "buy and hold" approach to investing. The performance evaluation assumes an equal $ purchase of each stock discussed that week and a decision to hold the stocks without regard to their performance. In reality, I advocate and practice a disciplined buying and selling strategy that limits losses and starts realizing profits as they develop. This difference in strategy would certainly affect the performance of any investment and should be considered when reading these reviews.
However, for the ease of review, I have chosen to assume a buy and hold approach for all stocks discussed.
 On October 31, 2005, I posted Hi-Tech Pharmacal (HITK) on Stock Picks Bob's Advice at a price of $37.55. HITK had a 3:2 stock split on 1/12/06 with a resultant 'pick price' of $25.03. HITK closed at $11.48 on March 23, 2007, for a resultant loss of $(13.55) or (54.1)%.
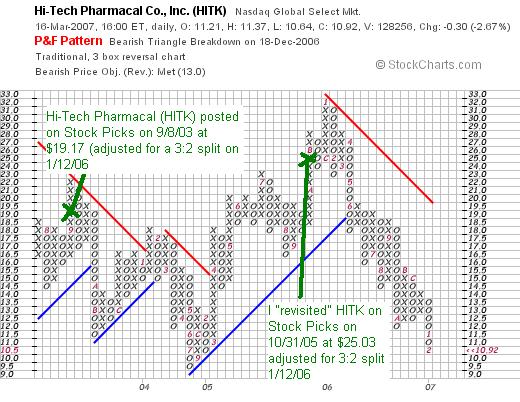
 On March 8, 2007, HITK announced 3rd quarter 2007 results. For the quarter ended January 31, 2007, net sales came in at $18.0 million, down 21% from the $22.9 million reported in the year-earlier same quarter. Net income declined to $.7 million from $4.9 million in the same quarter last year, and diluted earnings per share also declined sharply to $.06/share, down from $.36/share last year.
HI-TECH PHARMACAL (HITK) IS RATED A SELL
 On November 2, 2005, I posted Aspect Medical (ASPM) on Stock Picks Bob's Advice when the stock was trading at $35.40. ASPM closed at $15.66 on March 23, 2007, for a loss of $(19.74) or (55.8)% since posting.
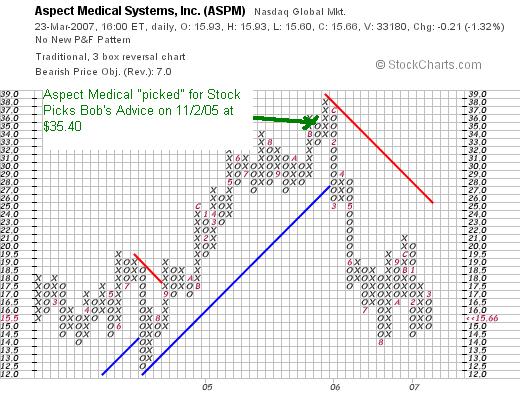
On February 7, 2007, Aspect Medical reported 4th quarter 2006 results. For the quarter ended December 31, 2006, revenue increased to $24.0 million from $21.6 million in the same quarter last year. Net income before a one-time tax benefit decreased to $2.4 million from $3.1 million the prior year. With the tax benefit, net income increased to $30.6 million this year vs. $3.1 million in the same quarter last year or $1.32/diluted share vs. $.13/diluted share last year. Even though I am convinced of the importance of GAAP results, one-time tax reversals, etc., should be understood before believing that earnings really have increased almost ten-fold, when actually they declined.
In addition, the company guided first quarter results to below expectations. They guided to first quarter profit of $.01 to $.03/share while analysts had been expecting first quarter earnings of $.16/share. Also, the company predicted revenue of $22.6 to $23.6 million in the first quarter of 2007. Again, analysts had been expecting revenue of $25.5 million in the quarter.
ASPECT MEDICAL (ASPM) IS RATED A SELL
 Finally, on November 3, 2005, I posted Fair Isaac (FIC) on Stock Picks Bob's Advice when the stock was trading at $44.50. FIC closed at $38.49 on March 23, 2007, for a loss on this selection of $(6.01) or (13.5)% since posting.
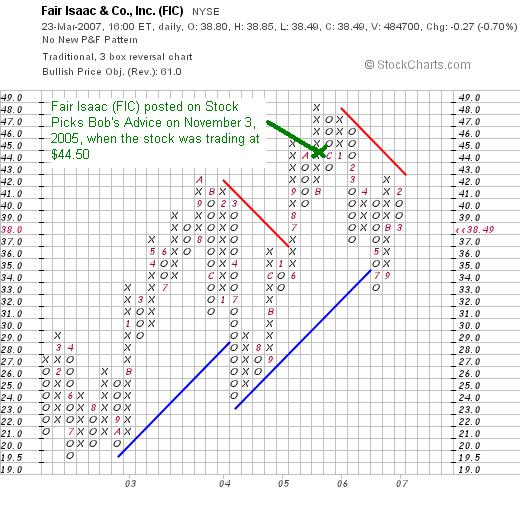
On January 24, 2007, Fair Isaac announced 1st quarter 2007 results. For the quarter ended December 31, 2006, revenue came in at $208.2 million ahead of the $202.8 million reported in the same quarter in the 2006 fiscal year. Net income was $31.2 million or $.52/diluted share vs. $28.5 million or $.43/diluted share. However, $2.3 million of income resulted from a one-time tax benefit.
The company slightly missed revenue expectations of $210 million.
FAIR ISAAC (FIC) IS RATED A HOLD.
So how did I do with these three stocks during that week in October/November, 2005? In a word, well the best word would be AWFUL. I had three stocks selected and ALL three stocks declined after I picked them. Is there anything else I need to write to tell you there is nothing guaranteed about what I write? It is important to keep looking through stocks, letting stocks that don't work out go, and hanging on to the winners! Anyhow, my average performance for these three was a loss of (41.1)%. YIKES....now you can see why I waited a week to review these three!
Thanks again for stopping by and visiting! If you have any comments or questions, please feel free to leave them on the blog or email me at bobsadviceforstocks@lycos.com. If you get a chance, be sure and visit my Stock Picks Podcast Website. Have a great week trading and investing!
Bob
Posted by bobsadviceforstocks at 11:16 PM CDT
|
Post Comment |
Permalink
Updated: Sunday, 25 March 2007 1:38 PM CDT
Friday, 16 March 2007
A Reader Writes "How do I follow your portfolio?"
Hello Friends! Thanks so much for stopping by and visiting my blog, Stock Picks Bob's Advice! As always, please remember that I am an amateur investor, so please remember to consult with your professional investment advisers prior to making any investment decisions based on information on this website.
I very much enjoy receiving letters from readers.
I had a nice note earlier today from Al B. who wrote simply:
"How do I follow your portfolio?
Thanks,
Al"
That doesn't sound like an unfair question to me. Unfortunately, you probably won't like my answer. But what I have been doing, is every several months, writing up an update of all of the stocks I own, my cost basis, the date of purchase, and the current unrealized gain (or loss) on each holding. When I first started writing this blog---way back in 2003---I tried to regularly update my Trading Portfolio and the list of all of the stocks 'picked'. Being the amateur that I am, this was a job beyond my time constraints and I simply gave up.
So I try to do this regularly and meanwhile, each time that I do a trade, I post a note called "trading transparency", kind of like my latest note on my unfortunate foray into Angeion, a company that otherwise suits my needs on this blog.
But since you are asking, let me pull up my account and review my holdings with you. I currently have 17 positions, out of my maximum planned 25 holdings. These results are as of the close of trading today 3/16/07.
Company (symbol), number of shares, date purchased, cost basis, closing price, unrealized gain (loss)
Bolt Technology (BTJ), 209 shares, 1/12/07, $17.44, $30.73, 76.24%
Cerner Corp (CERN), 120 shares, 2/2/07, $49.76, $55.64, 11.81%
Coach (COH), 71 shares, 2/25/03, $8.33, $48.77, 485.39%
Cytyc (CYTC), 188 shares, 1/29/04, $14.86, $33.07, 122.60%.
Hologic (HOLX), 120 shares, 1/31/07, $55.58, $54.12, (2.63)%
Harris (HRS), 120 shares, 1/31/07, $50.05, $47.65, (4.80)%
Jones Soda (JSDA), 300 shares, 3/12/07, $18.22, $18.85, 3.48%
Kyphon (KYPH), 125 shares, 5/20/05, $29.21, $42.85, 46.67%
Morningstar (MORN), 140 shares, 11/22/05, $32.57, $51.12, 56.93%
Precision Castparts (PCP), 100 shares, 10/24/06, $69.05, $99.84, 44.59%
Quality Systems (QSII), 88 shares, 7/28/03, $7.75, $38.42, 395.81%
ResMed (RMD), 150 shares, 2/4/05, $29.87, $47.58, 59.30%.
Starbucks (SBUX), 50 shares, 1/24/03, $11.40, $30.58, 168.13%.
Universal Electrs (UEIC), 180 shares, 2/23/07, $25.24, $27.38, 8.48%.
Meridian Bioscience (VIVO), 210 shares, 4/21/05, $11.13, $28.01, 151.70%.
Ventana Medical Systems (VMSI), 188 shares, 4/16/04, $23.47, $39.68, 69.07%.
Wolverine World Wide (WWW), 200 shares, 4/19/06, $23.55, $28.28, 20.11%.
As of 3/16/07, my stock holdings stood at $99,116.95, with a margin debit balance of $54,961.58, for a net value of $44,155.37.
The total of unrealized gains were $31,124.44.
During 2007, I have taken realized net short-term gains of $471.95, and realized net long-term gains of $2,140.72, for a total net realized gain of $2,612.67.
During 2006, I had a total realized gain of $5,460.82, consisting of a net short-term loss of $(5,237.30) and a net long-term gain of $10,698.12.
I hope this helps you understand what my holdings are, my current performance of my holdings and my net trading results for 2006 and 2007. If you have any comments or questions, please feel free to leave them on the blog or email me at bobsadviceforstocks@lycos.com.
Bob
Manitowoc Company (MTW) "Revisiting a Stock Pick"
Hello Friends! Thanks so much for stopping by and visiting my blog, Stock Picks Bob's Advice! As always, please remember that I am an amateur investor, so please remember to consult with your professional investment advisers prior to making any investment decisions based on information on this website.
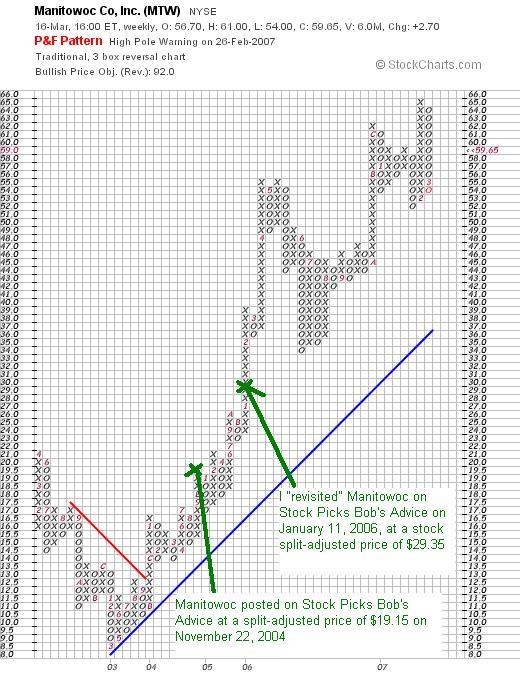
 I was looking through the list of top % gainers on the NYSE today and came across one of my favorite Wisconsin companies, Manitowoc (MTW) which closed at $59.65, up $4.18 or 7.54% on the day. I do not own any shares of Manitowoc, but I have encouraged my Stock Club to buy some shares, and have purchased some shares for my wife's IRA as well as a few shares for a couple of my kids' accounts. I also say 'favorite' because I have blogged about this stock previously. In fact, I first discussed Manitowoc on Stock Picks Bob's Advice on November 22, 2004, when the stock was at $38.29 (actually $19.15 when adjusted for a 2:1 stock split April 11, 2006). I then first "revisited" Manitowoc on Stock Picks on January 11, 2006, when the stock was trading at $58.70 ($29.35 when adjusted for the 2:1 stock split a few months after that post).
Here is the recent "Point and Figure" chart on Manitowoc from StockCharts.com:
Let's take another look at Manitowoc and I will share with you why I believe it still deserves a place on this blog.
What exactly does this company do?
According to the Yahoo "Profile" on Manitowoc, this company
"...engages in the manufacture and marketing of cranes and related products, foodservice equipment, and marine products in the United States and internationally. It operates through three segments: Cranes and Related Products (Cranes), Foodservice Equipment (Foodservice), and Marine."
How did they do in the latest reported quarter?
On January 30, 2007, Manitowoc (MTW) reported 4th quarter 2006 results. Net sales climbed 32% to $775.2 million from $589.3 million in the 2005 quarter. Net earnings more than doubled to $43.9 million in the 2006 4th quarter compared to $18.2 million in the 4th quarter of 2005. Diluted eps also increased more than 100% to $.69/share, up from $.30/share the prior year. As good as these results were, the stock dropped on an analyst downgrade from Robert Baird. As reported:
"Baird's Robert F. McCarthy cut his rating on the stock to "Neutral" from "Outperform" and price target by $10 to $56, citing a slowing of crane order growth and lower-than-expected food service results in the fourth quarter.
"While cycle-to-cycle financial performance has been impressive and near-term financial prospects appear robust, we believe moderating order growth for the segment that now accounts for 80 percent of operating income makes the stock vulnerable to multiple compression," McCarthy wrote in a note to investors.
Fourth-quarter crane orders were estimated at $705 million, representing a 5 percent increase over the prior year's period, but a 2 percent decrease from the third quarter of 2006, McCarthy said.
Manitowoc officials said the company's foodservice equipment business was hurt by higher commodity costs and weak beverage equipment sales. The unit's operating income slipped to $9.2 million from $10.9 million in the prior-year quarter."
It should be noted that even while the Baird analyst was downgrading the stock, the quarterly report beat expectations of earnings of $.67 (the company came in at $.69/share) on revenue of $761 million (the company came in at $775.2 million).
In fact, business has remained strong for Manitowoc. As reported yesterday after the close of trading, the company raised guidance for fiscal 2007, raising per share guidance from $3.85 to $4.00 to a range of $4.20 to $4.30. Also, the company suggested that reported earnings per share for the first quarter of 2007 will "exceed the average of published Wall Street estimates by approximately 10 percent." This announcement yesterday was the cause of the interest in the stock today even though the rest of the market was selling off!
How about longer-term results?
Reviewing the Morningstar.com "5-Yr Restated" financials, you can see why I like this stock so much and why I believe it has performed so well.
First of all revenue. This has grown steadily from $1.05 billion in 2001 to $2.3 billion in 2005 and $2.7 billion in the trailing twelve months (TTM).
Next earnings. Except for a dip from $.93 in 2001 to a loss of $(.40) in 2002, earnings have steadily grown to $1.07/share in 2005 and $2.25/share in the TTM. The company also pays a dividend which while increased from $.15/share in 2001, to $.32/share in 2002, has been $.14/share from 2003 to the TTM.
During this period, the company has expanded the number of shares from 49 million to 62 million...a slightly greater than 25% increase in shares while revenue climbed over 100% and earnings were also up about 100%. This is an acceptable trade-off imho.
Free cash flow, while dipping from $119 million in 2003, to $14 million in 2004, increased to $52 million in 2005 and $144 million in the trailing twelve months.
The balance sheet appears adequate with $113.5 million in cash and $947.1 million in other current assets giving a total of $1.06 billion in total current assets. When compared to the $835.8 million in current liabilities this yields a satisfactory current ratio of 1.27.
What about some valuation numbers?
Looking at Yahoo "Key Statistics", we find that Manitowoc is a mid cap stock with a market capitalization of $3.71 billion. The company has a nice trailing p/e of 22.53 with a forward p/e (fye 31-Dec-08) of only 12.53. Thus the PEG comes in at a very attractive (to me) 0.90.
According to the Fidelity.com eresearch website, MTW has a Price/Sales ratio of 1.16 compared to an industry average of 1.32. The company, while being cheaper in valuation that the average in its industry is also more profitable, at least as measured by the return on equity (TTM) which comes in at 24.75%, compared to an industry average of 22.82%.
Yahoo reports 62.14 million shares outstanding with 60.05 million that float. There are only 1.21 million shares out short as of 2/12/07, representing 1.4 trading days of volume (less than my 3 day rule for significance in a 'short ratio'), and this represents 2% of the float. The company as noted pays a forward dividend of $.14/share yielding 0.3%. The last stock split, as I noted above, was a 2:1 split last year on April 11, 2006.
What does the chart look like?
If we review the above chart, we can see that since bottoming around $8 in 2003, the stock has literally been on a tear, moving strongly higher. In other words the chart looks great to me.
Summary: What do I think?
This is one great company! And on top of this it is from Wisconsin as well. Boy do I love those Badger-state companies :). Seriously, this is the third time I have written up this stock and it still looks interesting! The latest quarter was strong. The company beat expectations on both earnings and revenue and just yesterday raised guidance for the next quarter and year. The company has been raising its revenue and growing earnings steadily for several years. They even pay a small but steady dividend and the number of shares has grown far slower than the rate of revenue and earnings growth. Free cash flow is positive and growing recently and the balance sheet looks nice.
To top it off, valuation is cheap with a p/e in the low 20's, a forward p/e in the teens, a PEG under 1.0, a Price/Sales lower than average in its group and a ROE higher than average. Finally the chart looks strong! I like this stock a lot and if I were in the market to buy some shares today, this is the kind of stock I would be buying. Meanwhile, it remains in my vocabulary for future consideration as I like to say.
Thanks so much for stopping by and visiting! If you have any comments or questions, please feel free to leave your comments on the blog or email me at bobsadviceforstocks@lycos.com. If you get a chance, you are welcome to drop by my Stock Picks Podcast Site where I from time to time podcast a stock or two that I write up here on the blog!
Bob
Posted by bobsadviceforstocks at 10:19 PM CDT
|
Post Comment |
Permalink
Updated: Friday, 16 March 2007 11:05 PM CDT
Thursday, 15 March 2007
Angeion (ANGN) "Trading Transparency"
Hello Friends! Thanks so much for stopping by and visiting my blog, Stock Picks Bob's Advice! As always, please remember that I am an amateur investor, so please remember to consult with your professional investment advisers prior to making any investment decisions based on information on this website.
I had an email the other day suggesting that maybe my Angeion purchase was a bit too volatile to be held long term. I don't know about that, but certainly with my 'disciplined' trading strategy, any new stock addition is subject to a quick sale even if the long-term prospects seem just fine. Especially if they are a lower-priced and relatively thinly traded stock like Angeion. O.K. enough excuses. I was checking my portfolio this noon and noticed that Angeion had hit and actually exceeded my 8% loss limit on a holding. Even if it is true that I had just purchased it.
So a few moments ago I sold my 300 shares of Angeion at $13.77. If you can believe it, as you must probably know, I just purchased Angeion (ANGN) for my trading account just two days ago (!) on the 13th at a price of $15.09. Thus, this represented a quick loss of $(1.32) or (8.75)% on this trade. I don't care if I have held a stock for two hours or two days, if the stock hits that 8% loss, out it goes. Furthermore, since this is a sale on 'bad news' (do I need to explain that taking a loss is bad news?), I use this as a 'signal' that things aren't perfect in my portfolio so I 'sit on my hands' and shall not be using the proceeds for anything (except to pay down my growing margin balance.)
Thanks so much for stopping by and visiting! If you have any comments or questions, please feel free to email me at bobsadviceforstocks@lycos.com or just leave your comments on the blog. If you get a chance, be sure and visit my Stock Picks Podcast Website. And if I get a chance, I shall have to get around to a new podcast. It has been a few weeks and I need to put together a new 'episode'.
Bob
Wednesday, 14 March 2007
My Second Worst Stock Pick!
I thought I would share with you the other stock in the sub-prime lending market that made its way onto this blog. While it may be that you could have ridden the stock up to a gain, the stock has recently been under increasing selling pressure. Here is my entry, again back in 2003 when I was just 'getting going' here on Stock Picks.
Monday, 9 June 2003
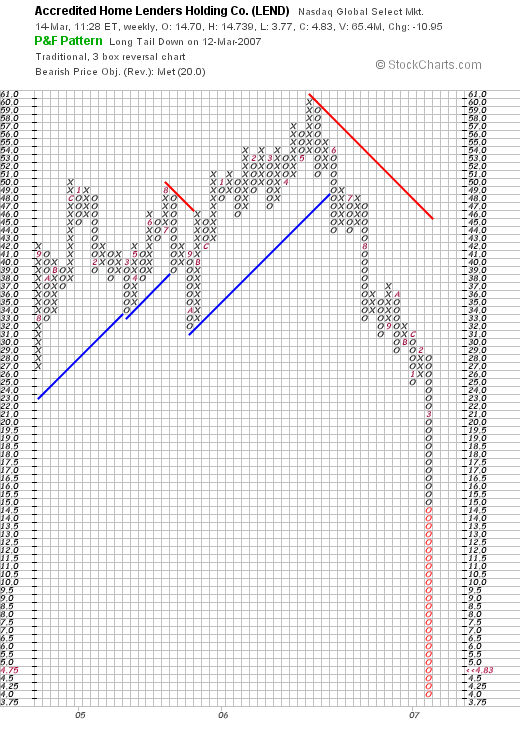
June 9, 2003 Accredited Home Lenders Holding Co. (LEND)
It is Monday morning. I was GOING to update the main page on this site....but didn't get to it. This weekend was graduation weekend for my senior and well.....enough excuses!
Anyhow, market a little soft today, getting a bit of a rest. This stock showed up on the NASDAQ top gainers and is worth a look. I have never heard of it before, it is actually a relatively new issue, and nobody in my family including me has any shares.
LEND is according to CNN.money, "a nationwide mortgage banking company that originates, finances, sells, securitizes and services subprime mortgage loans secured by single-fammily residences." Sounds a little like our New Century Finance...and look how well THAT one has done.
The stock is currently trading at $19.58 up $1.63 on the day or 9.08% to the upside.
On April 29th, LEND reported first quarter results. As noted on the news report from NYTimes on the web, LEND was founded in 1990, and came public in the first quarter of the year.
Total revenues for the quarter increased by 111% to $79.1 million from $37.5 million for the prior year (!). Net income was $14.8 millionl, or $.85/share, a 170% increase from the $37.5 million for the comparable quarter in 2002 (!!!).
Morningstar shows a steady improvement in annual revenue from $12.6 million in 1997, $18.3 million in 1998, $39.3 million in 1999, $56.6 million in 2000, and $96.5 million in 2001. Based on the $79.1 million in revenue for the first quarter, 2003 could bring in up to $300 million. This is a very pretty progression!
Morningstar is a bit spotty on the results regarding free cash flow and assets/liabilities...but watch this site for updates as the company is public longer.
The stock jumped today on guidance from the company, with second quarter eps raised to $1.20-$1.25 and full year eps guidance raised to $3.50-$3.75.
This is a very interesting stock, and if it performs anything like NCEN, represents a good buying opportunity right here.
Bob
It is interesting if you look at the LEND chart, you will see that if you had purchased shares in LEND, and sold at intervals, and sold when the stock declined you probably would have done real well following this pick advice. However, it also shows the problems of 'buying and holding' without managing your stock holdings.
Thanks so much for stopping by and visiting! If you have any comments or questions, please feel free to leave them on the blog or email me at
bobsadviceforstocks@lycos.com.
Bob
Newer | Latest | Older


