Stock Picks Bob's Advice
Sunday, 30 December 2007
"Trading Portfolio Update" December 30, 2007
Hello Friends! Thanks so much for stopping by and visiting my blog, Stock Picks Bob's Advice! As always, please remember that I am an amateur investor, so please remember to consult with your professional investment advisers prior to making any investment decisions based on information on this website.
As we approach the end of 2007 and begin a new year in a couple of days, I thought that this was about as good a time as any to take a look at my Trading Account. I haven't been doing these updates quite as frequently as previously because you can all venture over to my Covestor Page where my holdings and performance are summarized and analyzed and compared to indices as well as other investors on the site.
In fact, I last reviewed my holdings on October 7, 2007, and my overall performance has been pretty neutral since that post.
This is the status of my account as of December 30, 2007. These holdings are listed in the alphabetical order of their trading symbols followed by number of shares, date of purchase, price of purchase, latest price (12/28/07), and percentage unrealized gain or (unrealized loss).
Abaxis (ABAX), 180 shares, 10/25/07, $28.29, $36.90, 30.42%
Cerner (CERN), 103 shares, 2/2/07, $49.76, $57.58, 15.71%
Copart (CPRT), 210 shares, 9/27/07, $33.73, $42.62, 26.36%
Covance (CVD), 102 shares, 4/9/07, $62.61, $87.28, 39.40%
Harris (HRS), 103 shares, 1/31/07, $50.05, $62.69, 25.25%
IHS (IHS), 140 shares, 10/1/07, $58.53, $61.21, 4.58%
Morningstar (MORN), 103 shares, 11/22/05, $32.57, $77.60, 138.22%
Precision Castparts (PCP), 64 shares, 10/24/06, $69.05, $138.54, 100.63%
ResMed (RMD), 150 shares, 2/04/05, $29.87, $52.55, 75.94%
Universal Electronics (UEIC), 155 shares, 2/23/07, $25.24, $33.33, 32.05%
Meridian Bioscience (VIVO), 199 shares, 4/21/05, $7.42, $30.57, 312.05%
VCA Antech (WOOF), 210 shares, 7/27/07, $41.04, $44.60, 8.68%
Currently I am at 12 positions with 20 being the maximum and 5 the minimum. My equity value is $90,809.41 with $28,702.47 in margin outstanding with a net account value of $62,105.02. My margin equity percentage is 68.30%, up from 57.11% at the last report in October.
As of December 28, 2007, I had a net of $27,511.45 in unrealized gains in the account. Since the first of the year I have taken a net of $282.20 in short-term gains and $30,851.56 in long-term gains giving me a total of $31,133.76 in realized gains.
I have had total income of $422.74 and have paid $(4,888.66) in margin interest as of this date.
This has been a very good year for me in the market. I hope that the market has treated you just as kindly. Wishing all of my friends the happiest and healthiest of New Years in 2008.
Bob
Saturday, 29 December 2007
"Looking Back One Year" A review of stock picks from the week of June 26, 2006

Hello Friends! Thanks so much for stopping by and visiting my blog, Stock Picks Bob's Advice! As always, please remember that I am an amateur investor, so please remember to consult with your professional investment advisers prior to making any investment decisions based on information on this website.
It is the weekend and it is time for a review! Last weekend I reviewed the only stock selected on the blog during the week of June 19, 2006. Going ahead a week, during the week of June 26, 2006, I also had only one stock that I 'picked' for the blog. Let's take a closer look at Interactive Intelligence (ININ), find out how that pick would have worked out had we purchased any shares, and whether that stock still deserves a spot in the blog.
These reviews assume a 'buy and hold' approach to investing. Actually I advocate as well as practice a very disciplined portfolio management strategy for all of the stocks in my Trading Account. That is, instead of just 'buying and holding' any particular stock, I actively respond to news as well as the price movement of the equity, trying to limit losses by aggressively selling declining stocks, and locking-in gains by selling portions of appreciating stocks as they hit 'appreciation targets.'
But enough of all of that. Let's take a closer look at Interactive Intelligence.
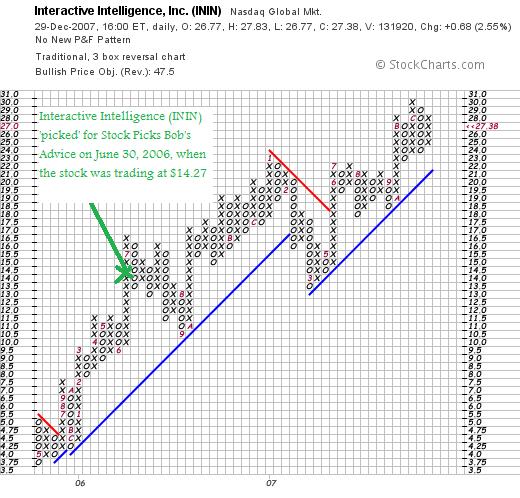
 I posted Interactive Intelligence (ININ) on Stock Picks Bob's Advice on June 30, 2006, when the stock was trading at $14.27/share. ININ closed at $27.38 on December 28, 2007, for a gain of $13.11 or 91.9% since posting. I do not own any shares nor do I have any options on this stock.
What exactly does this company do?
According to the Yahoo "Profile" on ININ, the company
"...provides software applications for contact centers and voice over Internet protocol (VoIP) applications to enterprises. Its products include Customer Interaction Center that provides contact centers and enterprises a single platform and a pre-integrated all-in-one application solution for IP telephony; Vonexus Enterprise Interaction Center, an IP PBX phone and communications system for SIP-supported VoIP in the mid-sized enterprises; Interaction Dialer that provides call scripting, multi-site campaign management, intelligent campaign staging, and compliance options; and Interaction EasyScripter, which integrates to Interaction Dialer for easy Web-based scripting."
How did they do in the latest quarter?
On October 29, 2007, Interactive Intelligence reported 3rd quarter results. For the quarter ended September 30, 2007, revenue came in at $28.7 million, up 29% over last year's $22.2 million in the same period. GAAP earnings came in at $.13/share vs. $.26/share last year. However, these results include one time gains and expenses--and removing this year's expenses related to stock-based compensation and a non-cash income tax benefit last year, the 'non-GAAP' results were net income of $3.3 million this year vs. $2.2 million in 2006 or $.17/share, up from $.12/share.
The company beat expectations which were for $.12/share earnings on revenue of $26.9 million according to analysts polled by Thomson Financial.
What about longer-term results?
Reviewing the Morningstar.com "5-Yr Restated" financials on ININ, we find that revenue has steadily increased and actually that growth has accelerated recently. They had $47.8 million in revenue in 2002 increasing to $62.9 million in 2005, $83.2 million in 2006 and $103.9 million in the trailing twelve months (TTM). Earnings have also steadily increased improving from a loss of $(.50)/share in 2002 to $.06/share by 2004, $.56/share in 2006. With the latest dip in earnings in the latest quarter (see the above comments), earnings for the TTM have dipped to $.41/share.
Free cash flow has also been improving turning from a negative $(2) million in 2004 to $3 million in 2005, $7 million in 2006 and $9 million in the TTM.
The balance sheet appears adequate with $23 million in cash and $49 million in other current assets. This total of $72 million in total current assets, when compared to the $50.7 million in current liabilities yields a current ratio of 1.42.
How about some valuation numbers?
Reviewing the Yahoo "Key Statistics" on ININ, we can see that this is a small cap stock with a market capitalization of only $440.7 million. The trailing p/e is quite rich at 66.14, with a forward p/e (fye 31-Dec-08) of 38.56. With the solid growth estimated (5 yr expected), Yahoo derives a PEG ratio of 1.57. Generally ratios beetween 1.0 and 1.5 are reasonable. This number also shows the 'richness' in valuation.
Using the Fidelity.com eresearch website, we can see that the Price/Sales (TTM) ratio is reasonable at 4.58 compared to the industry average of 6.61. Also on Fidelity, we can see that the Return on Equity (TTM) is a bit under the industry average at 27.30%, compared to the industry number of 31.76%.
Returning to Yahoo, there are 16.10 million shares outstanding while only 12.38 million float. As of 11/27/07, there were 1.2 million shares out short representing 7 days of trading volume (the short ratio) which also works out to 9.5% of the float. Using my own '3 day rule' for short interest, this is a significant level that may well result in a 'short squeeze' if the company continues to report solid results. No dividends and no stock splits are reported on Yahoo.
What does the chart look like?
Looking at the 'point & figure' chart on ININ from StockCharts.com, we can see a very strong record of price appreciation from May, 2005, when the stock was trading as low as $3.75/share to the current level of $27.38, just under the high of $30. The stock had one episode of price weakness in March, 2007, when it broke through support from $22 down to a level of $13.50 before turning around and heading higher. Overall the chart looks quite strong to me.
Summary: What do I think about Interactive Intelligence (ININ)?
To review a few of the points, this has been a great stock pick for me and the blog, with an appreciation of nearly 92% since posting the stock about 18 months ago. The latest quarter was a bit opaque with solid revenue growth and actually nice earnings appreciation once we take out the 'one-time' accounting events. The company also beat expectations on both revenue and earnings.
Longer-term the stock has also been recently accelereating its growth with solid revenue improvement, earnings growth, relatively stable outstanding shares, and increasing free cash flow. The balance sheet appears solid.
Valuation-wise, the p/e ratio is quite rich with a PEG just over 1.5. Price/Sales is reasonable but the Return on Equity was a tad under the industry.
There are lots of shares out short which without any known negative news is a positive factor. Finally the chart looks solid.
With all of this,
INTERACTIVE INTELLIGENCE (ININ) IS RATED A BUY
Thanks so much for visiting! If you have any comments or questions, please feel free to leave them on the blog or email me at bobsadviceforstocks@lycos.com. Other associated websites you might wish to visit includ my Stock Picks Podcast Page, where you can download mp3's of my discussions on some of the same stocks I blog about, my Covestor Page where my actual Trading Portfolio is evaluated and compared to the indices and other investors, and my SocialPicks page where most of my stock picks for this year are reviewed and monitored.
Wishing you all a wonderful 2008!
Bob
Friday, 28 December 2007
Actuant Corporation (ATU)
Hello Friends! Thanks so much for stopping by and visiting my blog, Stock Picks Bob's Advice! As always, please remember that I am an amateur investor, so please remember to consult with your professional investment advisers prior to making any investment decisions based on information on this website.
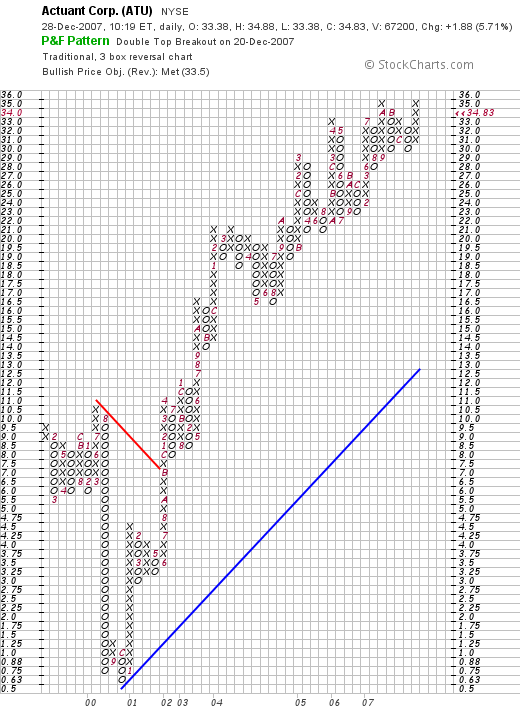
 I was looking through the list of top % gainers on the NYSE and came across Actuant (ATU) which is currently trading at $34.70, up $1.75 or 5.31% on the day. I do not own any shares or options on this stock but do think it deserves a spot on this blog.
ACTUANT (ATU) IS RATED A BUY
Let's take a closer look at this company and I will explain to you why I like this stock.
What exactly does this company do?
 According to the Yahoo "Profile" on Actuant, the company
"...manufactures industrial products and systems worldwide. It operates in four segments: Industrial, Electrical, Actuation Systems, and Engineered Products."
How did they do in the latest quarter?
On December 19, 2007, ATU reported 1st quarter 2008 results. For the quarter revenue came in at $415.1 million, up 21% from the prior year. Earnings were $27.4 million or $.43/share up from $25.1 million or $.41/share last year. Prior to restructuring charges, earnings were $.52/share.
With this report the company actually beat expectations which were for $.48/share and revenue of $395 million according to Reuters Estimates. In the same report, the company also raised guidance for the second quarter, with earnings now expected at $.39 to $.42/share on sales of $385 to $395 million. Analysts had been expecting earnings of $.42/share on revenue of $379.6 million.
As you probably know, this is what I look for in an earning report. That is, strong revenue and earnings growth, beating street expectations, and raising guidance. In my terminology, I call this a 'trifecta plus'. (But of course, I don't go to the races, so I don't really know much about horse-racing!)
What about longer-term results?
As I have written about over and over on this blog, my search for stocks is to identify companies that have consistently been reporting great results. Not just a quarter or even one year of financial success. I know that this search is pretty 'picky' and I shall miss lots of great opportunities, but my belief is that if we restrict our attention to the finest companies available, we shall have a more consistent performance than otherwise.
Anyhow, I like to refer to Morningstar for these results, and the Morningstar.com "5-Yr Restated Financials" on Actuant support this consistent pattern. Revenue has grown steadily from $585 million in 2003 to $1.46 billion in 2007. Earnings have also steadily increased from $.59/share in 2003 to $1.69/share in 2007. The company initiated dividends in 2006 at $.04/share and also paid $.04/share in 2007. (If I had my druthers, this would also show an increasing pattern--but the presence of a newly initiated dividend does offer an attractive feature to an investment.)
Outstanding shares have not been extremely stable; that is they have increased from 49 million in 2003 to 64 million shares in 2007. However, this approximately 25% increase in shares was accompanied by an approximately 200% increase in revenue and a more than 200% increase in earnings. This is more than acceptable 'dilution' imho.
Free cash flow is not only positive but increasing with $82 million in free cash flow reported in 2005, growing to $102 million in 2006 and $146 million in 2007.
The balance sheet is solid with $87 million in cash and $419 million in other current assets. This total of $506 million in total current assets, when compared to the $290.8 million in current liabilities yields a current ratio of 1.74. Generally ratios abover 1.2 are 'adequate'. The company also carries a not insignificant $710 million in long-term liabilities on its books per Morningstar.
What about some valuation numbers?
According to Yahoo "Key Statistics" on ATU, the company is a small cap stock with a market capitalization of only $940.39 million. The trailing p/e is a very reasonable (imho) 20.23 with the forward p/e even nicer at 15.43 (fye 31-Aug-09).
With the reasonable valuation and the strong record and estimates, ATU ends up with a PEG under 1 at 0.98. Generally from my perspective PEG ratios between 1.0 and 1.5 are reasonably priced. Companies with PEG's under 1.0 are relatively 'cheap', and above 1.5 are generally 'rich' in valuation.
Using the Fidelity.com eresearch website for additional valuation numbers, we can see that the Price/Sales ratio is also reasonably priced at 1.19 (TTM) compared to the industry average of 1.47. In terms of profitability, at least as measured by the Return on Equity (TTM), Fidelity again shows that not only is the company less 'expensive' than its peers by the Price/Sales ratio, the company also is more profitable with a ROE (TTM) of 22.48%, compared to the industry average of 21.52%.
Returning to Yahoo, the company has 27.12 million shares outstanding (54.28 million adjusted for a split), and 53.50 million that currently float. As of 11/9/07, there are 4.77 million shares out short representing 8.9% of the float and 8.1 trading days of volume (the short ratio). Using my own '3 day rule' on short interest, the 8.1 days of trading volume is quite significant and with the ongoing 'good news' being reported by the company, is only another bullish indicator for the stock.
As I noted above, the company is paying $.04/share in annual dividends yielding only 0.04%. The last stock split was last month on November 9, 2007, when the company split its stock 2:1.
What about the chart?
Examining the 'point & figure' chart from StockCharts.com, we can see what I would consider a very strong price performance since January, 2002, when the stock broke through resistance at $9.00/share. The stock bottomed as low as $.63/share in September, 2000 (of course adjusted for stock splits). Since 2002, the stock price has literally been on a tear, climbing to the recent levels of $34.38, just under its apparent all-time high of $35.
Summary: What do I think?
Needless to say I like this stock a lot. I am not buying any shares as I do not have a 'permission slip' from my own portfolio to be adding positions. But if I were, this is my kind of stock!
Reviewing a few of the things that make me attracted to this equity, let's recall that the company just reported a quarterly report with strong revenue growth and earnings growth. They beat expectations and they raised guidance.
They have been steadily been reporting strong results for the past five years or more, have initiated a dividend, kept the outstanding shares reasonably stable, and are reporting positive and growing free cash flow. The balance sheet looks solid.
Valuation-wise, the p/e is just over 20 and the PEG is under 1.0. The price/sales ratio is lower than average, and the Return on Equity is higher than average. On top of this, there are lots of shares out short and the chart looks terrific. WHAT is there NOT to like :).
Anyhow, that's a pick for you for the end of the year!
If you have any comments or questions, please feel free to leave a comment on the blog or email me at bobsadviceforstocks@lycos.com. Furthermore, if you get the time, be sure and visit my Stock Picks Podcast Site, where you can listen to be discuss some of the stocks from the blog. Or visit my Covestor Page where my actual trading portfolio is tracked and compared to the S&P and other investors real-time without me actively providing information. In addition, for a review of my past stock picks for the year, visit my SocialPicks Page where these are recorded and reviewed.
Again, thanks for visiting! Have a great New Year and may 2008 find us reading more about good things in the world instead of Assassinations, Wars, Terrorism and Torture. (o.k. I had to put a little bit of politics in there!)
Regards to all of my readers and their families!
Bob
Posted by bobsadviceforstocks at 11:15 AM CST
|
Post Comment |
Permalink
Updated: Friday, 28 December 2007 11:18 AM CST
Thursday, 27 December 2007
Maintaining Perspective
Hello Friends! Thanks so much for stopping by and visiting my blog, Stock Picks Bob's Advice! As always, please remember that I am an amateur investor, so please remember to consult with your professional investment advisers prior to making any investment decisions based on information on this website.
It was a lousy day in the market.
First we had the assassination of Benazir Bhutto in Pakistan letting us all realize once again how fragile each life is as well as how willing some people are to change history through violent means. The market didn't like that kind of unsettling news and slumped along with increases in oil prices.
In addition, real estate prices are slumping, jobs aren't being created in a vigorous fashion, and consumers weren't buying adequately during the holiday season to set any kind of records. Quite the reverse actually.
But I don't know which direction the stock market will move tomorrow or next week. I don't know whether we are embarking on a prolonged bear market correction or if tomorrow will mark the beginning of a new bull phase of trading.
I don't mean to disappoing anyone but I cannot read the future. I can guess, we can all guess, but nobody really knows these things.
So how do I respond to this turmoil? I stay with my system. I restrict my ownership to high quality companies that are doing well---growing their revenue, earnings, free cash flow, and maintaining outstanding shares as well as a solid balance sheet. And then I respond to market activity by evaluating the price action in each of my holdings. I do not try to guess their moves either, but sell quickly if they incur losses and slowly if they yield gains. And with these sales I either add to my exposure to equities or bias my account more towards cash. In other words, I let the price performance of my existing stocks determine my own strategy.
I don't know if this is the best way, or even the most successful approach. Sometimes, like I yield to the urge of doing a 'trade', I also have the inclination to throw in the towel and move everything to cash. But I don't. I have stopped trying to guess the market direction. Maybe you are a better guesser. As for me, my own portfolio has moved me to 12 positions out of a maximum of 20 and a minimum of 5. My portfolio is literally 'speaking to me'.
And I shall listen.
Thanks again for visiting! If you have any comments or questions, please feel free to leave them on the blog or email me at bobsadviceforstocks@lycos.com.
Bob
Tuesday, 25 December 2007
Movado Group (MOV): A New Podcast Available
Hello Friends! About monthly I have been taking the time to post a new podcast on this blog. Tonight I discussed Movado Group and you can click HERE to reach my Podcast Page and download or listen to this podcast.
As you probably know, I do not own any shares of Movado at this time. However, I still like the stock, I like the company and
MOVADO (MOV) IS RATED A BUY
Thanks so much for stopping by and possibly listening as well! Have a Merry Christmas and a wonderful 2008. If you have any comments or questions, you can feel free to leave them on the blog or email me at bobsadviceforstocks@lycos.com.
Bob
Monday, 24 December 2007
A Reader Writes "Please keep going over your reasons...."
Hello Friends! Thanks so much for stopping by and visiting my blog, Stock Picks Bob's Advice! As always, please remember that I am an amateur investor, so please remember to consult with your professional investment advisers prior to making any investment decisions based on information on this website.
 A while back Bob G. wrote and suggested "stick to what you know." While not exactly following his advice, he wrote intelligent suggestions regarding being careful about plunging into new venture, whether it be trading stocks, or trading pork bellies, and to prepare and educate yourself before rashly losing your money. I could not disagree with him even in the slightest. He was kind enough to write again and tone down his criticism (it wasn't necessary) and I would like to share with you (I hope that's o.k. Bob) his email:
"Hi Bob,
I think your blog is terrific and most certainly not boring. Please keep going over your reasons for buying and selling. It's a great help and a surefire learning process for your readers. In my last email I suggested you stop trading and keep investing and I thought afterwards that I was a little too harsh in my statements.
You are doing great and obviously have a good feel for the markets. Keep putting your toes in the water but don't go above the knee, so to speak. I was wondering if you ever tried to figure out how much of your return is from the market itself moving and how much is from the actual stock picking.
If you look at your graph, and say drop off the first few trades, thus starting later, would you still be ahead of the market or just have market returns (Beta vs alpha)? The reason I ask, is that a way to furthur develop your stockpicking might be to only buy (or trade) when the market is going up. How do you determine when the market is going up? That becomes another problem. Since you like P&F charts, it might be when there is a column of X's on the S&P 500 chart or whatever you feel comfortable with. (Moving averages of the S&P, price above or one ma above another ma etc).
Anyway I just wanted to thank you and wish you and yours a Happy Holiday Season.
Bob G."
Thanks so much for writing again Bob! I have heard your same comments from other readers who have advised me to consider charts before plunging into investments--especially for the short-term. I shall try to look harder at these graphs before diving into a trade in the future.
I am not sure whether my performance would look good if I took off my first couple of trades (the acquisitions of CYTC and VMSI) from my record. I do think I was rather lucky with them. However, I do believe that having two stocks acquired out of your portfolio may well mean that my selection process was similar to the acquiring companies---that is they also recognized a superb company and just wanted to own ALL of the shares instead of the handful that I owned as an amateur investor.
You write about only buying when the stock market is moving higher. I do think the suggestion of using point and figure charts on the S&P or Dow might be helpful. But I haven't ignored this point.
One of the biggest failures of mine in the past has been to be making acquisitions when the market was turning against me. Currently I use my own portfolio as a signal for the appropriate time to be buying or selling stocks. That is, when a stock is sold on bad news (a decline or some other fundamental problem), I sit on my hands with the proceeds and do not have permission to be buying a new position to replace it. If you note my recent sale of my remaining shares of SNCR, I stated it was because I didn't have the 'signal' to be buying a new position.
That signal is also generated by my portfolio in terms of a partial sale of one of my holdings on an appreciation target reached. These sales on appreciation are my 'good news' signals that give me the permission, so to speak, to add a new holding assuming I am below my maximum of 20. Currently I allow my portfolio to drift between 5 positions (the minimum) and 20 positions (the maximum).
In the extreme cases (I don't believe I have faced these situations), if a stock hits an appreciation target and I sell a portion, which usually generates a 'buy signal', I plan on 'sitting on my hands' and avoiding any new purchase if I am already fully invested--with 20 positions. On the other hand, if I am at my minimum and I sell on bad news, instead of sitting on my hands, this would generate a buy signal and I would look for a new stock to own--as long as it met my requirements.
Thanks again for writing! I enjoyed your critique and it is ok to pan any of my decisions and suggest improvements. Just because I have a blog doesn't make me an expert.
Have a very Happy Holiday Season! And again, thanks for writing.
Bob
Synchronoss (SNCR) "Trading Transparency"
Hello Friends! Thanks so much for stopping by and visiting my blog, Stock Picks Bob's Advice! As always, please remember that I am an amateur investor, so please consult with your professional investment advisers prior to making any investment decisions based on information on this website.
A few moments ago I sold my last 200 shares of Synchronoss (SNCR) at $37.54. These shares were purchased as a 'trade' and I wanted to clear them out so that I could get back to my usual portfolio management strategy. (In addition, without these shares I can, in my own mind, make another trade as well!) These shares were just purchased 12/20/07 at a cost basis of $35.96, so I had a gain of $1.58 or 4.4% since purchase.
Regardless of my own sale which has nothing to do with my overall opinion on this stock,
SYNCHRONOSS (SNCR) IS RATED A BUY
Just keeping you posted. I don't know if I should or shouldn't be dabbling in these trades, but since my overall performance has been very solid this year, I am willing to put my toes in the water in this very volatile and very risky activity! Thanks for visiting and wishing you all a very Happy Holiday Season!
Bob
Sunday, 23 December 2007
"Profiling"--Identifying Stocks With Potential
So many of my entries are about individual stocks. And yet for the casual reader I am sure the question is 'Why did you pick that stock?'
For me the answer is about profiling.
I borrowed this diagram from Leatherhead Food International:
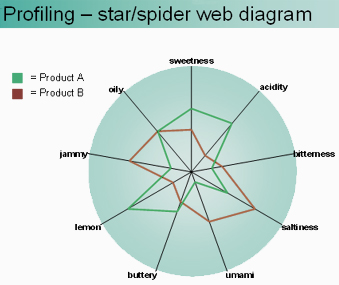
Leatherhead is interested in evaluating new food products.
I am interested in evaluating new stocks.
So instead of "oily" or "buttery" or "bitterness", think about "earnings", "Morningstar", "Valuation", "chart", and other characteristics that we investigate.
I am a very strong believer that earnings drive stock prices. I have seen this over and over and we can match downturns to financial results to downturns in the price of an equity. And with reversals of those same fortunes, comes reversals of stock prices.
But I do not believe in any particular magic about any particular stock. Good management drives results. Of course a great stock should have a great product or service. But it is the financial results, the growth in earnings, the increasing dividend, the stable shares, and solid balance sheet that provides the fuel for the engine of stock appreciation.
When I blog, I am very repetitious. I hope I am not boring anyone. But I am going through my own list of essential characteristics. Much like a packing list on a voyage, I check-off each of the needed things I am searching for in an investment.
So as you read through my stocks, and there are many on this blog, keep thinking about the profiling effort that I am utilizing.
Sometimes I talk about finding the next Fastenal (FAST), a local stock that is a favorite in this area. But I don't know what shape or form the next great investment will take. I am on a great search. In fact, a never-ending exploration of investing that changes with each quarterly report and each session of trading.
I hope that this helps all of you understand what I am doing. I know it helps me. Thanks to all of you readers who regularly stop by, and for those who are new--welcome and stay awhile. There is a lot of content on this website and I believe that even if I am an amateur, there is good stuff in those webpages.
Merry Christmas and Happy Holidays to all of my great friends on and off-line.
Bob Freedland
Posted by bobsadviceforstocks at 11:00 PM CST
|
Post Comment |
Permalink
Updated: Monday, 24 December 2007 4:31 PM CST
IHS Inc (IHS) "Weekend Trading Portfolio Analysis"

Hello Friends! Thanks so much for stopping by and visiting my blog, Stock Picks Bob's Advice! As always, please remember that I am an amateur investor, so please remember to consult with your professional investment advisers prior to making any investment decisions based on information on this website.
As part of my continued effort at transparency on this website, I have been reviewing my actual holdings in my Trading Account approximately every three weekends. Currently with 13 positions, this will take me about 39 weeks to complete the cycle. Three weeks ago I reviewed Harris Corporation. Going alphabetically (by symbol) brings me up to IHS Corp (IHS). Let's take a closer look at this stock and see whether it still deserves a spot on my blog and in my own investment portfolio.
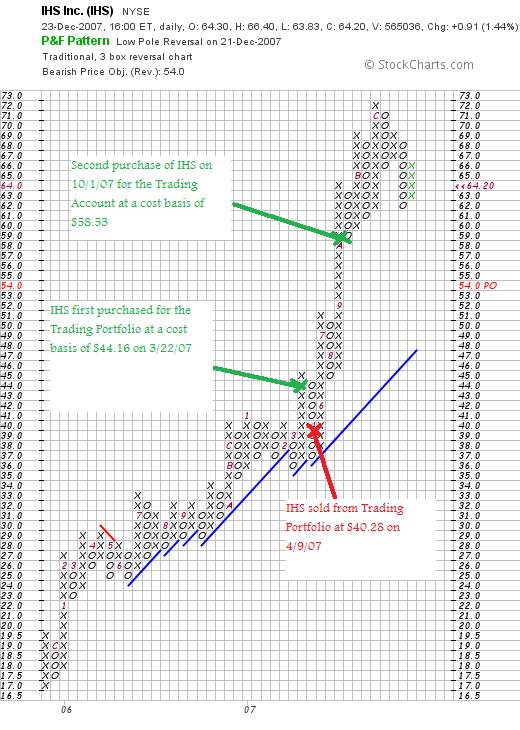
 Currently I own 140 shares of IHS which closed at $64.20 on December 21, 2007. These shares were acquired 10/1/07 with a cost basis of $58.53, giving me an unrealized gain of $5.67 or 9.7% since purchase. This is actually the second time that I have owned IHS. I purchased shares 3/22/07, only to see them decline to a sale point 4/9/07 at which time those shares were sold resulting in a $(465.98) loss in a couple of weeks time.
I am occasionally asked about whether I will 'revisit' a stock after having solid it at a loss. I think that IHS demonstrates that I do keep these stocks on my investing 'horizon' even if they are sold on what I would call a 'technical' basis. I first discussed IHS on this blog on March 24, 2007, when the stock was trading at $42.10.
What exactly does this company do?
According to the Yahoo "Profile" on IHS, the company
"...provides technical information, decision-support tools, and related services to customers in the energy, defense, aerospace, construction, electronics, and automotive industries worldwide. It operates in two segments: Energy and Engineering. The Energy segment develops and delivers oil and gas industry data on exploration, development, production, and transportation activities to energy producers and oil companies. It also provides decision-support tools and operational, research, and strategic advisory services to these customers, as well as to utilities and transportation, petrochemical, coal, and power companies. The Engineering segment provides solutions, such as technical specifications and standards, regulations, parts data, design guides, and other information to customers in its targeted industries. This segment serves defense, aerospace, construction, energy, electronics, and automotive industries. The company' customers range includes governments, multinational corporations, smaller companies, and technical professionals."
How did they do in the latest quarter?
On September 20, 2007, IHS reported 3rd quarter 2007 results. Revenue for the quarter ended August 31, 2007, came in at $183.4 million, up 31% over the 3rd quarter 2006 results of $139.9 million. Net income increased similarly to $21.7 million from $16.1 million and earnings grew 25% to $.35/share from $.28/diluted share last year.
How about longer-term results?
Examining the Morningstar.com "5-Yr Restated" financials on IHS, we can see the steady revenue growth from $339 million in 2002 to $551 million in 2006 and $639 million in the TTM. Earnings have been a bit more erratic with results climbing to $1.11/share in 2004 before dipping to $.75/share in 2005, but resuming the climb to $.99/share in 2006 and $1.22/share in the TTM. No dividends are paid. Outstanding shares are stable with 69 million in 2003 increasing only slightly to 71 million in the TTM.
Free cash flow is positive and growing with $63 million in 2004 and $105 million in 2006 and $101 million in the TTM.
The balance sheet is just adequate with $132 million in cash and $221 million in other current assets compared to the current liabilities of $350.9 million. This works out to a current ratio of 1.01. I would prefer to see companies with more current assets and ratios of at least 1.25. There are $86.2 million in long-term liabilities as well.
What about some valuation numbers?
Looking at Yahoo "Key Statistics" on IHS, we can see that this company is a mid cap stock with a market capitalization of $4.02 billion. The trailing p/e is rich at 52.28 with a forward p/e of 33.61 (fye 30-Nov-08). According to Yahoo, the p/e is not justified in terms of anticipated growth as the PEG ratio (5 yr expected) comes in a bit rich at 1.90.
This richness in valuation is reflected as well, using Fidelity information, by the Price/Sales ratio which is 5.99 is well above the industry average of 2.40. In terms of profitability, as measured by the Return on Equity (TTM) statistic, we find that IHS does a little better with a statistic of 11.38 vs. the industry average of 8.73%.
Yahoo reports 62.65 million shares outstanding with 58.13 million shares that float. There are 2.02 million shares out short as of 11/9/07. This is moderately significant as it totals 7 trading days of volume (the short ratio) to cover. No stock dividends are reported on Yahoo and no cash dividends have been paid.
What does the chart look like?
Examining the "point & figure" chart from StockCharts.com on IHS, we can see that this stock has steadily appreciated from November, 2005, when the stock was trading at $17 to a peak of $72/share in December, 2006. The stock has pulled back somewhat but overall the sharp and steady ascent appears intact.
When would I sell these shares?
With a cost basis of $58.53, and not having sold any shares of this lot yet, I would sell all my shares should the stock decline to an 8% loss which works out to .92 x $58.53 = $53.85. On the upside, my plan is to sell 1/7th of my shares or 20 shares at the 30% appreciation target. This works out to 1.3 x $58.53 = $76.09.
Summary: What do I think about IHS?
I like IHS and continue to own the stock. That being said, I have concerned about the p/e in the 50's, a PEG over 1.5, and a price/sales ratio double the stock in its industry. I do not see any analysts on this stock and don't know whether the latest quarter was above or below 'street' expectations. The graph shows upward price momentum but appears to be a bit over-extended. In addition, the balance sheet shows relatively heavy current debt loads with a current ratio barely over 1.0.
Thus,
IHS (IHS) IS RATED A HOLD
Thanks again for stopping by and visiting. If you have any comments or questions, please feel free to leave them on the blog or email me at bobsadviceforstocks@lycos.com. If you get a chance, be sure and visit my Covestor Page, my SocialPicks Page, and my Podcast Website.
Have a great shortened week and wishing all of my friends a very Merry Christmas and a wonderful New Year!
Bob
"Looking Back One Year" A review of stock picks from the week of June 19, 2006
Hello Friends! Thanks so much for stopping by and visiting my blog, Stock Picks Bob's Advice! As always, please remember that I am an amateur investor, so please remember to consult with your professional investment advisers prior to making any investment decisions based on information on this website.
It is the weekend. And almost Christmas. We have lots of snow outside and I am sure some travelers are having a bit of trouble getting where they need to get. As for me, I am staying put for the duration. But I do have a bit of time to take a look at the week of June 16, 2006, when actually I only picked a single stock for this blog.
These weekend reviews assume a buy and hold approach to investing. That means it assumes that an investor purchases the stock and holds it for the long-term regardless of the price changes. In reality, I advocate and practice a much more disciplined approach (except when I buy a stock for what I call a 'trade'). That means buying stocks based on investment signals and selling them either on declines or appreciation when they reach their appropriate targeted prices. But for the ease of analysis, I utilize this buy and hold approach each weekend to evaluate stock picks. The difference in these strategies would certainly affect stock portfolio performance.
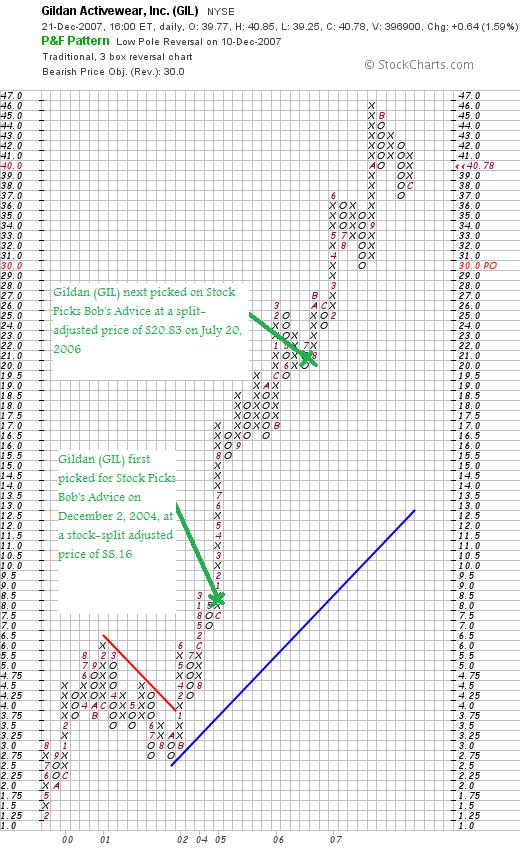
 On July 20, 2006, I posted Gildan (GIL) on Stock Picks Bob's Advice when the stock was trading at $41.65. Adjusted for a 2:1 stock split May 29, 2007, this works out to a price of $20.83.
My 2006 post was actually the second time I have looked at Gilda--I first 'picked' Gildan for the blog on December 2, 2004, when the stock was trading at $32.65, adjusted for a 2:1 stock split June 1, 2005, and the 2:1 stock split on May 29, 2007, this works out to an effective 'pick price' of $32.65 x 1/2 x 1/2 = $8.16.
Gildan (GIL) closed at $40.78 on December 21, 2007, for an appreciation of $19.95 or 95.8% since posting last year. Looking at that 2004 pick, the appreciation to date is $32.62 or 399.8% since posting. I do not currently own any shares or options on this stock.
Let's take a closer look at this stock and see if it still deserves a spot on this blog!
What exactly does this company do?
According to the Yahoo "Profile" on Gildan (GIL), the company
 "...engages in the manufacture and sale of activewear for the wholesale imprinted sportswear markets in the United States, Canada, and Europe. The company also sells socks, and men's and boys' underwear, as well as frequently replenished and non-fashion apparel. It primarily offers activewear, including t-shirts, fleece, and sport shirts under the Gildan brand name to wholesale distributors as undecorated, which are subsequently decorated by screen printers with designs and logos."
How did they do in the latest quarter?
On December 6, 2007, Gildan (GIL) announced 4th quarter 2007 results. For the quarter ended December 30, 2007, sales came in at $254.9 million (U.S.), up 8.4% from $235.2 million in the same quarter last year. Adjusted net earnings came in at $45.8 million up 24.5% from $36.8 million or $.38/diluted share, up 26.7% from $.30/diluted share last year.
The company matched estimates of analysts. The company announced guidance below current estimates for the 1st quarter and year 2008. They predicted earnings of $.21/share in the first year (analysts were looking for $.24/share) and full 2008 fiscal year results of $1.85/share (analysts predict profits of $1.93 for the year). Thus, even with the strong quarterly report, the announcement lowered expectations for 2008. As you know, I prefer to see a company announce strong earnings that beat expectations and then raise guidance.
What about longer-term results?
Reviewing the Morningstar.com "5-Yr Restated" financials page on GIL, we can see that the company continues to report steady revenue growth, steady earnings growth, no dividend, stable outstanding shares, positive and growing free cash flow, and a solid balance sheet.
What about some valuation numbers?
Checking the Yahoo "Key Statistics" on GIL, we see that the company is a mid cap stock with a market capitalization of $4.91 billion. The trailing p/e is moderately high at 38.11, but the forward p/e (fye 30-Sep-09) is 17.28, and estimates for growth continue strong enough for a PEG (5 yr expected) to be calculated at 0.65.
According to the Fidelity.com eresearch website, valuation is a bit rich as measure by the Price/Sales ratio (TTM) which for GIL comes in at 5.09, with an industry average of 3.25. Also, measuring profitability by the Return on Equity (TTM), according to Fidelity, the company comes in a tad shy of the average at 21.66%, with an industry average reported to be 22.15%.
Finishing up with Yahoo, there are 120.43 million shares outstanding with 109.21 million that float. As of 11/9/07, there were 2.61 million shares out short, representing 4.7 trading days of volume (the short ratio). This is a bit heavy of a short interest (at least according to my own '3 day rule'). If he company should repor posiive results this may result in a bit of a squeeze on the shorts.
No dividends are paid and as already noted the last stock split was a 2:1 stock split May 29, 2007.
What does the chart look like?
Looking at the "Point & Figure" chart on Gildan from StockCharts.com, we can see a phenomenally strong chart, which after a slight dip to $2.75/share in September, 2001, the stock has been 'on a tear' moving sharply higher well above support levels without any recent correction.
Summary: What do I think?
First of all this has been an absolutely terrific stock pick for this blog. And unfortunately you will not find it in my trading portfolio today. This only stock pick for the week showed a 95.8% appreciation. Not too shabby at all.
Let's review some of the findings on this blog. First of all, the company reported a terrific quarter. However, they cut guidance slightly on the quarter and the year upcoming. The Morningstar.com report is solid. Valuation-wise, the p/e is a bit rich but the PEG is reported under 1.0. The price/sales is also a bit rich and profitability is just under average for its industry. Finally, the chart is solid with a very strong upward pattern going all the way back to late 2001. However, the stock price does appear to be a tad overextended.
I really like this company. It deserves a spot in the blog. But with the above cautions noted,
GILDAN (GIL) IS RATED A HOLD
Thanks so much for stopping by and visiting! If you have any comments or questions, please feel free to leave them on the blog or email me at bobsadviceforstocks@lycos.com.
Feel free to visit my related websites, including my Covestor Page where my actual trading portfolio is tracked independently of my reporting, my SocialPicks page where my stock picks are reviewed and monitored, my Podcast Website, where I have been recording a few 'radio shows' (in a very amateur fashion) and discussing some of the various stock picks from my blog.
If you are interested in a possibly higher risk venture, I have been investing some funds over at Prosper.com where person-to-person lending in a sort of Dutch Auction, eBay style consortium fashion occurs. That is, you can invest money, usually small amounts, and become part of a larger group of lenders who lend 36 month unsecured loans to individuals with Prosper.com serving as a intermediary. Please be very careful if you participate, do your homework, be aware of the risks, consider sticking with conservative, higher-rated individuals, and good-luck. But it is a fascinating venture and I am intrigued. (Full Disclosure: if you sign up with Prosper.com through these links, we will both earn $25 if you place a loan).
Have a wonderful Christmas and a very happy and healthy New Year! Let's hope 2008 brings us peace, good health, and profits :).
Bob
Newer | Latest | Older


