CLICK HERE FOR MY PODCAST ON INTERACTIVE INTELLIGENCE
Hello Friends! Thanks so much for stopping by and visiting my blog, Stock Picks Bob's Advice. As always, please remember that I am an amateur investor, so please remember to consult with your professional investment advisors prior to making any investment decisions based on information on this website.
 I want to talk about a stock this afternoon that may deserve our attention, Interactive Intelligence (ININ). I don't have any shares nor do I have any options on this stock. As a change from my prior recent posts, I want to try to make posting a bit simpler for me. Less photos, just the scoop :). Let me know what you think.
Looking through the list of top % gainers on the NASDAQ today, I came across Interactive Intelligence (ININ), which as I write is trading at $14.27, up $1.54 or 12.10% on the day. I do not own any shares or options on this stock. But let me try to go through the numbers with you and explain why I like the company.
According to the Yahoo "Profile" on ININ, the company
"...provides business communications software solutions for contact center automation, enterprise Internet protocol telephony, unified communications, and self-service automation."I didn't see any news to explain today's move to the upside.
Going through some of the things I like to review on a company, ININ reported 1st quarter results on April 25, 2006, for the quarter ended March 31, 2006. Revenue came in at $17.9 million, up 23% from $14.6 million in the same quarter last year. Net income worked out to $1.0 million or $.06/share, compared to net income of $25,000 and earnings of $0.00/share in the first quarter of 2005.
Longer-term? Reviewing the Morningstar.com "5-Yr Restated" financials on Interactive, we can see that except for a slight dip in revenue from $47.9 million in 2001 to $47.8 million in 2002, revenue has grown steadily to $62.9 million in 2005 and $66.3 million in the trailing twelve months (TTM).
Earnings show steady improvement with a loss of $(.73)/share in 2001, improving to a profit in 2004 at $.06/share, increasing to $.13/share in 2005 and $.19/share in the TTM. Meanwhile, the number of shares outstanding has stayed relatively constant with 15 million shares in 2001, increasing to 16 million in 2005.
Free cash flow has also been on the upswing with $(3) million in 2003, improving to $3 million in 2005 and $5 million in the TTM.
Balance-sheet? The company has $18.9 million in cahs and $19.1 million in other current assets. This is balanced against a $32.4 million in current liabilities yielding a current ratio of 1.17. This is below what I have learned is "healthy" for a current ratio which should be at least 1.5. However, the company has $-0- long-term liabilities per Yahoo. So this doesn't look too bad at all.
Valuation? Reviewing Yahoo "Key Statistics" on ININ, we find that this company has a market cap of $232.4 million. The trailing p/e is rich at 77.32, with a forward p/e of 36.28 (fye 31-Dec-07). The PEG ratio, which is reasonable between 1 and 1.5 imho, is also richly valued at 2.22.
Checking the Fidelity.com eresearch website, we can see that ININ has a Price/Sales ratio of 3.3. This is relatively rich in the "Business Software and Services" industrial group. Other stocks in the group are led by BEA Systems (BEAS) with a ratio of 4.2, First Data (FDC) also at 3.3, Automatic Data Processing (ADP at 3, Business Objects (BOBJ) at 2.4, and Fiserv (FISV) at 2.
If we review profitability, we find that Interactive (ININ) is actually the most profitable in the group with a ROE of 41.7%. This followed by FISV at 19.7%, FDC at 19%, ADP at 18.9%, BEAS at 13.2% and BOBJ at 5.8%.
Finishing up with Yahoo, we find that there are only 16.41 million shares outstanding with 7.90 million that float. In addition, as of 6/12/06, there were only 14,630 shares out short representing 0.2% of the float and 0.2 trading days of volume. No dividend is paid and no stock split is reported on Yahoo.
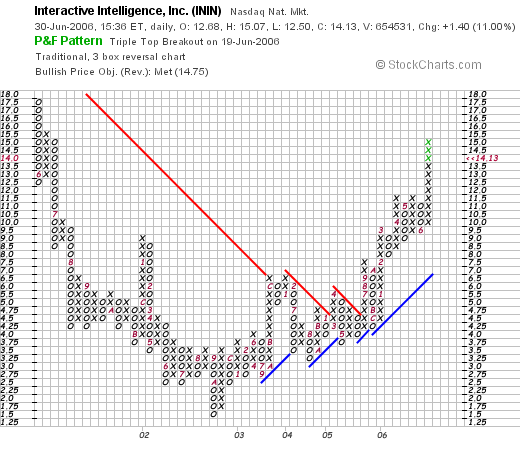
What about a chart?

Here we see an interesting chart with a decline from $17.50 starting in May, 2001, to a low of $1.50 in October, 2002. After breaking through resitance at $4.50 in June, 2005, the stock has once again started moving strongly higher to its current level of $14.13. The chart looks encouraging.
Summary. What do I think? Well it is an interesting, albeit small company. The latest quarter was quite strong, and the Morningstar.com report shows a gradually improving picture with revenue and earnings growing, free cash turning positive and a reasonably strong balance sheeet. Valuation-wise, the p/e is rich, the PEG is over 2.2 and the Price/sales is near the top of its group. Profitability, however, exceeds the other companies in the same group. And with the company as small as it is, certainly a premium in valuation is warranted imho.
Thanks again for stopping by! If you have any comments or questions, please feel free to leave them on the blog or email me at bobsadviceforstocks@lycos.com. Please also be sure and visit my Stock Picks Bob's Advice Podcast Site.
Bob
Updated: Friday, 30 June 2006 8:20 PM CDT


