Stock Picks Bob's Advice
Thursday, 8 February 2007
Alcon (ACL)
Hello Friends! Thanks so much for stopping by and visiting my blog, Stock Picks Bob's Advice! As always, please remember that I am an amateur investor, so please remember to consult with your professional investment advisors prior to making any investment decisions based on information on this website.
 I was looking through the list of top % gainers on the NYSE this evening and came across Alcon, ACL, which closed at $129.77, up $9.02 or 7.47% on the day. I do not own any shares of Alcon, but my son does own 5 shares in an account that I monitor. I believe this company deserves a spot on my blog so let me go over a few of the points that I think justifies its inclusion here.
What exactly does this company do?
According to the Yahoo "Profile" on Alcon, the company
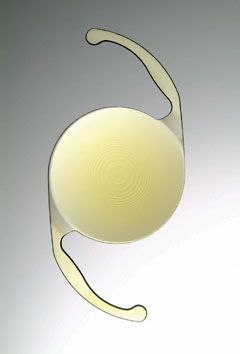 "...engages in the development, manufacture, and marketing of pharmaceuticals, surgical equipment and devices, and consumer eye care products to treat diseases and disorders of the eye. Its pharmaceutical products include a line of products to treat glaucoma; anti-infectives, anti-inflammatories, and combination therapies to treat bacterial, viral, and fungal infections of the eye, as well as to control ocular inflammation; products for the treatment of ocular allergies; and generic ophthalmic products and otic pharmaceuticals."
How did they do in the latest quarter?
Yesterday, after the close of trading, the company announced 4th quarter 2006 results. It was this announcement of strong earnings that drove the stock higher today. Sales for the quarter ended December 31, 2006, climbed 16.1% to $1.22 billion, from $1.05 billion in the same quarter in 2005. Even accounting for the positive effects of currency exchange rates, sales grew a strong 13.5%. Net earnings for the quarter came in at $354.7 million or $1.16/diluted share up from $60.7 million or $.19/diluted share last year. (Adjusting for one time items, net earnings in the 4th quarter 2005 would have been $257.9 million or $.83/diluted share, with a resultant 39.8% increase in earnings/share with the adjusted figure!)
The company beat expectations of $1.03/share according to Thomson Financial, on revenue of $1.2 billion. The company also raised guidance for the upcoming year with 2007 per-share earnings of $5.10 to $5.20 on revenue of $5.45 billion expected. Analysts had been expecting earnings of $4.93/share on revenue of $5.34 billion. This was a very strong quarterly report for Alcon!
What about longer-term financial results?
Reviewing the Morningstar.com "5-Yr Restated" financials, we can see the steady increase in revenue from $2.7 billion in 2001 to $4.37 billion in 2005. With the latest quarter, 2006 revenues came in at $4.90 billion.
Earnings were reported at $1.92/share in 2003 with $2.98/share reported in 2005. With the latest quarter, earnings for 2006 totaled $4.37/share.
The company paid $.36/share in dividends in 2004, increased it to $.99/share in 2005, and $1.36/share in 2006.
The number of shares outstanding has been very stable with 309 million in 2003 decreasing to 306 million by 2005. The company is reducing this number further with 302.29 million shares reported on Yahoo.
Free cash flow increased from $758 million in 2003 to $1.07 billion in 2005.
The balance sheet on Morningstar.com shows $1.8 billion in cash, $1.4 billion in other current assets, easily covering the $2.3 billion in current liabilities as well as the $394 million in long-term liabilities combined. The current ratio works out to a 'healthy' 1.43.
How about some valuation numbers on Alcon?
Reviewing Yahoo "Key Statistics" on ACL, we find that this is a large cap stock with a market capitalization of $39.23 billion. The trailing p/e is a bit rich at 38.20 with a forward p/e of 26.32. Yahoo doesn't list a PEG ratio.
According to the Fidelity.com eresearch website, the 5 Year PEG is estimated at 1.57, below the industry average of 1.94. IMHO, PEG's between 1.0 and 1.5 are reasonably valued, and a PEG of 1.57 is acceptable.
Fidelity also shows Alcon with a Price/Sales (TTM) of 7.50, well below the industry average of 21.26, again suggesting reasonable valuation. The company is also quite profitable with a Return on Equity (ROE) (TTM) of 47.94 per Fidelity, compared to an 'industry average' of 34.10%. Again suggesting that the company is more profitable than average as well as being relatively 'cheaper' than average compared to similar companies.
Finishing up with Yahoo, we can see that while there are 302.29 million shares outstanding only 75.18 million float. Of these, 1.89 million are out short as of 1/9/07, representing 4 trading days of volume (the short ratio). With today's sharp rise on an otherwise down day in the market, this bit of a significant short interest may well have been 'squeezed' as short-sellers were likely scrambling to cover their bets by buying shares to close out their positions. Now that is just speculation on my part, but a sharp rise after posting good news may well be evidence of a squeeze.
As noted, the company is paying a forward dividend of $1.36 yielding 1.10%. No stock splits are reported on Yahoo.
What does the chart look like?
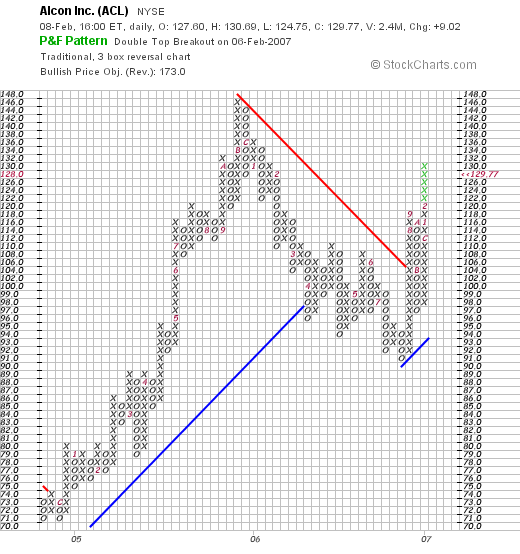
Looking at the "Point & Figure" chart on Alcon from StockCharts.com, we can see how the stock which was trading between $63 and $85 during much of 2004, broke out strongly higher in 2005 to a high of $146 in October, 2005. The stock traded lower throughout much of 2006, hitting a low of $91 in July, 2006, only to turn higher once more, breaking through resistance at $116, and now pushing towards the $130 level. Overall, the stock looks strong to me without being overextended.
Summary: What do I think about this stock?
Taking into consideration my son's small investment in this stock, I have a small bias towards the stock. However, seriously, the stock traded nicely today in an otherwise weak market. The latest quarterly report did everything an investor could wish in a report: they reported increased revenue and earnings, beat expectations on both, and raised guidance on both! Longer-term, they have been reporting strong results for the past 3-4 years, pay a dividend and have been increasing the dividend, reporting increasing free cash flow, and they are even retiring shares enhancing shareholder equity. Finally the balance sheet is strong.
Value-wise, the p/e is a bit rich but with a PEG just over 1.5, it isn't really that bad. The Price/Sales is lower than the average for the industry, while their profitability as measured by ROE is higher. In conclusion, even the chart looks promising as the stock moves towards historic highs.
I like this stock! Only wish it was a bit cheaper. But then again, it isn't the price/share that counts, it is the quality underlying that stock certificate and Alcon fits the bill!
Thanks so much for stopping by and visiting! If you have any comments or questions, please feel free to leave them on the blog or email me at bobsadviceforstocks@lycos.com. If you get a chance, be sure and visit my Stock Picks Podcast Website where you can download mp3's of me discussing many of the same stocks I write about here on the blog!
Bob
Posted by bobsadviceforstocks at 9:10 PM CST
|
Post Comment |
Permalink
Updated: Thursday, 8 February 2007 9:11 PM CST
Tuesday, 6 February 2007
Chase Corporation (CCF)
Hello Friends! Thanks so much for stopping by and visiting my blog, Stock Picks Bob's Advice! As always, please remember that I am an amateur investor, so please remember to consult with your professional investment advisors prior to making any investment decisions based on information on this website.
 I was looking through the lists of top % gainers and came across a name on the AMEX gainers list that made the list a couple of days ago as well--Chase Corporation (CCF). Chase closed today at $33.49, up $1.24 or 3.84% on the day. I do not own any shares or options on this stock.
I believe this company deserves a spot on the blog for numerous reasons. Let's take a closer look at some of the supporting information for this stock and I believe I can convince you as well!
What exactly does this company do?
According to the Yahoo "Profile" on Chase (CCF), the company
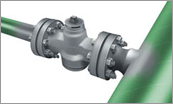 "...a manufacturing company, provides various products and services to the specialty chemical, converting, and electronic manufacturing industries worldwide."
How did they do in the latest quarter?
On January 12, 2007, Chase announced 1st quarter 2007 results. For the quarter ended November 30, 2006, revenue grew 26% to $31.2 million from $24.9 million in the same period last year. Net income was up approximately 150% to $2.55 million, from $1.02 million the prior year same period. Diluted earnings per share increased 138% to $.62/share from $.26/share in the prior year.
What about longer-term financial results?
Examining the Morningstar.com "5-Yr Restated" financials on Chase, we can see the pretty picture of steady revenue growth from $69.3 million in 2002 to $108.4 million in 2006. We know this growth has continued into the first quarter of 2007 as well! Earnings have been increasing, although a bit less steadily, from $1.08/share in 2002 to $1.53/share in 2006. The company also pays a dividend which did dip from $.36/share in 2002 to $.27/share in 2003, but has been increased to $.35/share in 2006. During this same time, the number of shares outstanding has been kept steady at 4 million.
Free cash flow has been increasing from $2 million in 2004 to $9 million in 2006. The balance sheet appears solid with $2.4 million in cash and $33.3 million in other current assets. This total of current assets of $35.7 million is enough to pay the $17.2 million in current liabilities and the $15.5 million in long-term liabilities combined! When compared against the $17.2 million in current liabilities, the current ratio works out to a healthy 2.08.
What about some valuation numbers?
Reviewing the Yahoo "Key Statistics" on CCF, we find that this is indeed a small, small cap stock with a market capitalization of only $133.42 million. The trailing p/e is a reasonable (imho) 17.62. There apparently aren't any analysts predicting earnings, so there aren't any forward p/e's or PEG ratios to discuss.
According to the Fidelity.com eresearch website, Chase has a Price/Sales (TTM) of 1.10 compared to an industry average of 10.09. The company is reported to have a return on equity (ROE) (TTM) of 17.32%, comparable to the 18.54% industry average.
Finishing up with Yahoo, we can see that there are actually only 3.98 million shares outstanding and of those 2.33 million that float. As of 12/12/06, there were 5,690 shares out short representing 0.2% of the float or 1.9 trading days of volume. The short-sellers don't appear to be much of a factor in this stock at least as of the latest reported information.
As I noted above, the company has been paying a small dividend that it has recently been increasing with a forward annual dividend rate of $.40/share, yielding 1.30% going forward. No stock splits are reported on Yahoo.
What about a chart?
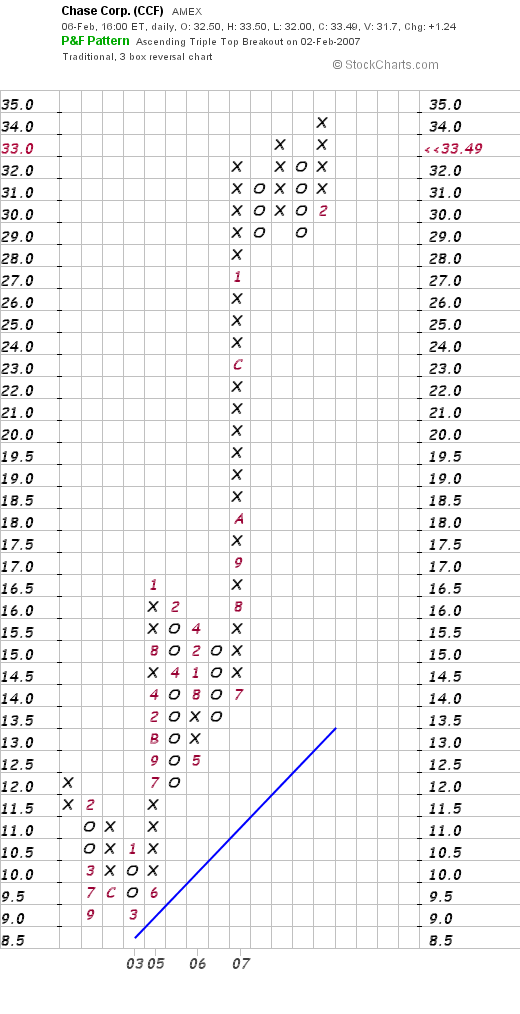
Checking the "Point & Figure" chart on Chase Corp. (CCF), we can see a very strong graph indeed, as the stock, which droped from $12 in January, 2002, to a low of $9.00 in January, 2003, has subsequently taken off 'like a rocket' to its current level, just under the high, at around $33.49.
Summary: What do I think?
Well, as you know, I wouldn't be writing up this stock unless I liked it! However, reviewing some of the above, the company is moving strongly higher the past few days, the last quarter was spectacular with growth in revenue and earnings. With the earnings increasing by about 150% over last year's results! And the p/e of the stock is in the teens. On top of this, the company has been reporting solid revenue growth the past five years at least, earnings have been growing nicely the last 3-4 years, and they even pay a dividend which they have been boosting.
Free cash has been increasing, the balance sheet is solid, and valuation-wise, besides the low p/e, the Price/Sales is dirt cheap and the ROE is reasonable. To top it off the chart is incredibly strong. The only thing that always bothers me is the low # of shares. But when the news is good, that often can mean a stock that moves higher quickly. But on bad news....well watch out below!
Anyhow, I have to run off to my stock club. I might just present this one for their review if I get a chance. In any case, I have presented it to all of you!
Thanks again for visiting! If you have any comments or questions, please feel free to leave them on the blog or email me at bobsadviceforstocks@lycos.com. If you do write, please give me a first name and a location. Makes it all more interesting! If you get a chance, stop by my Stock Picks Podcast website, where you can download some mp3's and listen to me discuss some of the many stocks I write about here on the blog! Have a great Tuesday everyone! And if you are in the midwest or anywhere feeling the cold wave, well stay warm!
Bob
Posted by bobsadviceforstocks at 5:40 PM CST
|
Post Comment |
Permalink
Updated: Tuesday, 6 February 2007 5:44 PM CST
Monday, 5 February 2007
Sauer-Danfoss (SHS) "Revisiting a Stock Pick"
CLICK HERE TO LISTEN TO MY PODCAST ON SAUER-DANFOSS (SHS)
Hello Friends! Thanks so much for stopping by and visiting my blog, Stock Picks Bob's Advice! As always, please remember that I am an amateur investor, so please remember to consult with your professional investment advisors prior to making any investment decisions based on information on this website.
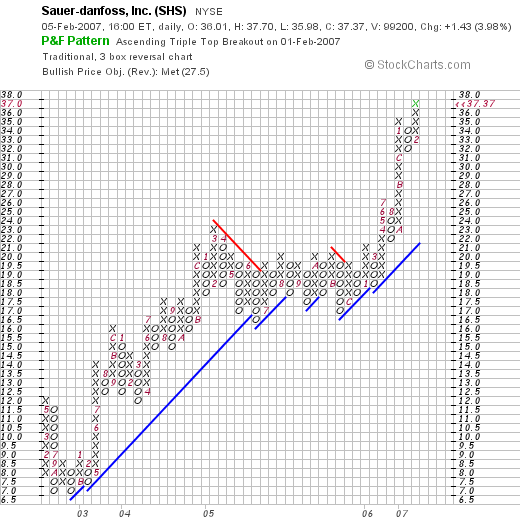
 I write a lot about my "vocabulary" of stocks. What I mean by this word vocabulary is one investment among many that more or less fit my investing strategy. Sauer Danfoss (SHS) is a great company that I first wrote up on September 30, 2004, when it was trading at $17.08/share. SHS made the list of top % gainers on the NYSE today, closing at $37.37, up $1.43 or 3.98% on the day. This represents a gain of 118.8% since posting on the blog. I still believe the company deserves a spot here and I shall review a few of the things that makes me so impressed with this particular company. I do not own any shares or options on this stock.
What exactly does this company do?
According to the Yahoo "Profile" on Sauer-Danfoss, the company
 "...and its subsidiaries engage in the development, manufacture, and marketing of engineered hydraulic and electronic systems, and components for the distribution and control of power in mobile equipment principally in the America, Europe, and the Asia-Pacific regions. It operates in three segments: Propel, Work Function, and Controls."
How did they do in the latest quarter?
On November 1, 2006, SHS reported 3rd quarter 2006 results. Net sales for the quarter ended September 30, 2006, climbed 12% to $381.9 million, from $342.0 million during the same period last year. (Excluding the effect of currency exchange rates on the results, sales still climbed 9% year-over-year). Net income increased 65% to $7.1 million or $.15/share, from $4.3 million or $.09/share the prior year.
What about longer-term results?
Reviewing the Morningstar.com "5-Yr Restated" financials on Sauer-Danfoss, we can see the steady revenue growth from $855 million in 2001 to $1.55 billion in 2005 and $1.68 billion in the trailing twelve months (TTM).
Except for a slight dip from 2002's $.29/share to $.24/share in 2003, earnings have subsequently steadily increased to $.81/share in 2005 and $1.24/share in the TTM.
The company pays a dividend which while stable aqt $.28/share between 2001 and 2003, increased to $.34/share in 2004, $.48/share in 2005 and $.56/share in 2006. Meanwhile, shares outstanding have been absolutely solid with 48 million in 2001, and 48 million in the TTM.
Free cash flow, while a bit erratic, appears to be increasing recently. $36 million in 2003 reported increasing to $46 million in 2004, dipping to $21 million in 2005, then increasing to $73 million in the TTM.
The balance sheet appears solid with $24.9 million in cash and $555.3 million in other current assets. This total of $580.2 million in current assets, easily covers the $366.5 million in current liabilities, yielding a 'current ratio' of 1.58. In addition, Morningstar reports an additional $398.1 million in long-term liabilities.
What about some valuation numbers?
Checking the Yahoo "Key Statistics" on Sauer-Danfoss, we find that this is a mid cap stock with a market capitalizatio of $1.78 billion. The trailing p/e is a bit rich at 30.02, however the forward p/e (fye 31-Dec-07) is a bit nicer at 25.77 estimated. However, the PEG is also a bit rich estimated (5 yr expected) at 2.00.
Using the Fidelity.com eresearch website for information, we find that the Price/Sales (TTM) is quite reasonable at 1.02 with an industry average of 8.84 reported. Also, the return on equity (ROE) (TTM) is at 12.72%, with an industry average of (63.11)% reported by Fidelity. Again, relative to sales as well as relative to the profitability, SHS appears to be priced reasonably.
Finishing up with Yahoo, we can see that there are 47.75 million shares outstanding with only 10.63 million that float. As of 1/9/07, there were 492,040 shares out short, representing 6.8 trading days of volume or 1% of the float. This is significant in light of the average trading volume the past 10 days of 108,886. Any time the short ratio (the number of days the short interest would take to be 'covered') exceeds 3, that is significant imho.
Finally, the company pays a 'forward' dividend of $.64/share yielding 1.9%. No stock splits are reported.
What does the chart look like?
If we examine a "Point & Figure" chart on Sauer-Danfoss from StockCharts.com, we can see a very strong picture of price appreciation. After dropping from $12.00/share to a low of $7.00 in October, 2002, the stock has been on a tear. It spent much of its time in 2005 consolidating between $23 and $16, but then in March, 2006, the stock broke out once again to the upside and is charging higher as I write :). The stock is a tad over-extended at this point, but it is a very strong chart imho.
Summary: What do I think about this stock?
In three words, "I like it!" Let's review a few of the things about this that I have already discussed that makes me 'pick' a stock like Sauer-Danfoss for this blog. First of all, this is a stock that I wrote up more than two years ago and which has more than doubled since that time! I do not own any shares or options unfortunately. The latest quarter was great with solid growth in revenue and earnings. The only note on that report was a bit of caution regarding the slight slowing of the growth in the backlog. Otherwise, everything else looked solid.
Longer-term, the company has steadily grown the revenue, almost perfectly grown earnings, has started growing its dividend, and has kept the number of shares outstanding steady. They are growing the free cash flow and the balance sheet appears solid.
Valuation-wise, the p/e is a tad rich, the PEG is at 2.0 which is a bit higher than I like (1.0 to 1.5 is perfect). However, the Price/Sales was quite cheap for its group, and the profitability, as measured by ROE was higher than other stocks in its group as well. Finally there are a significant number of shares out short, waiting to be 'squeezed' so to speak, and the chart looks strong to me!
This is avery interesting company that meets many of the criteria that I look for in a stock! I liked it two years ago, it doubled in price, and I still like it today!
Thanks so much for stopping by and visiting. If you have any comments or questions, please feel free to leave them on the blog or email me at bobsadviceforstocks@lycos.com. If you get a chance, stop by and visit my Stock Picks Podcast website, where I discuss many of the same stocks that I write about here on the Stock Picks blog!
Bob
Posted by bobsadviceforstocks at 9:53 PM CST
|
Post Comment |
Permalink
Updated: Monday, 5 February 2007 11:22 PM CST
Sunday, 4 February 2007
AMN Healthcare Services (AHS) "Long-Term Review #4"

Hello Friends! Thanks so much for stopping by and visiting my blog, Stock Picks Bob's Advice! As always, please remember that I am an amateur investor, so please remember to consult with your professional investment advisors prior to making any investment decisions based on information on this website.
I try to do several things at the same time on this blog: review stocks of interest, share with a trading portfolio, and discuss portfolio management strategies that I actually employ. Additionally, to determine if the picks I discuss are any good, I have been trying to review these selections and find out how they would have turned out if I had indeed purchased shares. I do occasionally purchase shares in the stocks I discuss and I try to let you know when and if I own shares when I discuss equities. However, most stocks I discuss I do not have any shares in them, I just feel they are worth attention and become my "vocabulary" of investing. In the last few months, I have started going back to the beginning of this website, which had its birth back in May, 2003, almost four years ago! I am trying to write these stocks up in order, reviewing any "pick" that is still traded.
On January 28, 2007, I reviewed HealthExtras (HLEX) my 'pick #3' on this blog. Today, let's take a look at AMN Healthcare Services (AHS), my 'pick #4' which was posted on May 15, 2003, on Stock Picks Bob's Advice!
I wrote:
"Thursday, 15 May 2003
May 15, 2003 AMN Healthcare Services (AHS)
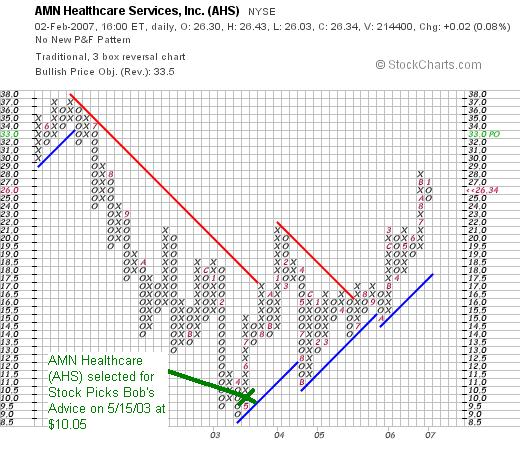
Scanning through the NYSE best advancers, AHS shows up. Stock is at $10.05 up $.53 for a 5.7% gain or thereabouts. Last quarter just reported is a little confusing--reported on April 29th, showing a 15% increase in revenue with a 21% increase in earnings per share. The company which apparently does 'locums' healthcare people has had a fairly meteoric growth in revenue from $68.8 million in 1997 to 87.7 million in 1998, 146.5 million in 1999, and 230.8 million in 2000, 517.8 million in 2001 and 663.8 million for the trailing 12 months....at least on Morningstar. With the last quarter at 199 million....extrapolating gets about 800 million for next 12 months. However, short term, same day they also reported they expect to miss Wall Street's estimates for the coming quarter. Cash flow wise they are still burning some cash...at least as of 2002 Morningstar website....may actually be cash flow positive at this time based on trends. Anyhow, that 's a provocative pick for this site....I don't own any. Actually hit an 8% stop today on my portfolio with ITIC....a title insurance company...that has low daily volume and thus liquidity. Something probably to avoid to escape the subsequent volatility that comes with very few shares traded daily. Good luck! Bob"
AHS closed at $26.34 on February 2, 2007, for a gain of $16.29 or 162.1% since posting!
Let's take a closer look at this company and see how it is doing today!
 What exactly does this company do?
According to the Yahoo "Profile" on AMN Healthcare (AHS), the company
"...engages in the recruitment and placement of physicians, nurses, and allied health professionals on a temporary or permanent basis at acute-care hospitals and other healthcare facilities in the United States and internationally."
How did they do in the latest quarter?
On November 1, 2006, AHS reported 3rd quarter 2006 results. Revenue came in at $282.7 million, a 69% increase from the $166.9 million in revenue reported in the same quarter last year. Net income climbed 38.3% to $9.4 million from $6.8 million last year. This represented a 27.3% increase on a per diluted share basis from $.22/share last year to $.28/share this year. In the same report the company raised guidance for full year revenue and diluted eps from prior guidance given in August, 2006. New guidance was fully year 2006 revenue from $1.07 billion to $1.08 billion, and full year diluted eps to range from $.94 to $.96/share.
How about longer-term results?
Reviewing the Morningstar.com "5-Yr Restated" financials on AHS, we find that revenue has been erratic with $518 million in 2001 increasing to $776 million in 2002, before dropping to $629 million in 2004. Since 2004, revenue has again been on the rise increasing to $706 million in 2005 and $1.02 billion in the Trailing Twelve Months (TTM).
Earnings also dipped from $1.12 in 2002 to a low of $.55/share in 2004, before rebounding to $.69/share in 2005 and $.94/share in the TTM.
The company has reduced its shares outstanding overall with 43 million in 2002, dropping to 29 million in 2005 before rebounding slightly to 34 million shares in the TTM.
Free cash flow numbers are not reported on Morningstar.
The balance sheet looks solid with $3.5 million in cash and $217.7 million in other current assets reported on Morningstar.com. This total of $221.2 million can easily cover the $110.2 million in current liabilities yielding a current ratio of 2.01. In addition, the company has another $272 million in long-term liabilities.
How about some valuation numbers on this stock?
Looking at the Yahoo "Key Statistics" on AMH Healthcare (AHS), we can see that this is a small cap stock with a market capitalization of $896.2 million. (The definition of small cap, mid cap, and large cap varies by the source. In this glossary, the definition for a small cap stock is between $250 million to $1 billion.) The trailing p/e is a moderate 28.11 with a forward p/e (fye 31-Dec-07) estimated at 22.13. The PEG (5 yr expected) is a reasonable 1.43.
According to the Fidelity.com eresearch website, the Price/Sales is reasonable for AHS at 0.83, with an industry average of 1.07. The Return on Equity (ROE TTM) is a reasonable 15.34%, with an industry average of 15.61%. Thus the company, by this profitability measurement, is about as profitable as similar companies in the same industry as measured by the ROE.
Finishing up with Yahoo, we find that there are 34.03 million shares outstanding with 33.57 million that float. As of 1/9/07, it is reported that there are 1.85 million shares out short representing 5.5% of the float or 5.9 trading days of volume. This is almost twice my '3 day rule' for short interest and may well represent a potential 'short squeeze' if the company, which is expected to report earnings any day, comes in with a strong report.
No cash dividend is paid and no stock split is reported on Yahoo.
What does the chart look like?
If we examine a "Point & Figure" chart on AHS from StockCharts.com, we can see how the 'turn-around' in 2004, as noted by the Morningstar.com report, is seen in the chart as well. The stock price had been declining from a high of $37 in June, 2002, to a low of $9.00 in April, 2003, a month before being 'picked' on the blog. The stock subsequently has moved steadily higher, and is now just a few points under its recent high of $28. The stock has a way to go before reaching its prior high on this chart back at the $37 level.
Summary: What do I think about this stock?
This stock actually turned out to be a terrific stock that I "picked" on the blog, when technically, it was just turning itself out from a prolonged downward price correction. If I were using the charts, well, I probably would never have posted this one. Recent earnings have been very strong and the company has raised guidance. Valuation appears reasonable with a p/e in the 20's and a PEG under 1.5. The Morningstar.com page is missing the free cash flow, which is unfortunate, but otherwise the results look nice and the balance sheet looks solid. The chart even looks nice with the stock clearly moving higher breaking the trend from the last several years. If I were buying stock, and this one was on the top % list, I might well pick this stock once again!
Thanks again for visiting! I hope you all have a great week trading coming up. And be sure to leave a comment on the blog or email me at bobsadviceforstocks@lycos.com if you have any comments or questions. You are welcome to come and visit my Stock Picks Podcast website as well where I discuss some of the many stocks I write about here on the blog!
Bob
"Looking Back One Year" A review of stock picks from the week of September 26, 2005

Hello Friends! Thanks so much for stopping by and visiting my blog, Stock Picks Bob's Advice! As always, please remember that I am an amateur investor, so please remember to consult with your professional investment advisors prior to making any investment decisions based on information on this website.
One of the things I try to do on weekends is to review past stock selections to see how they would have turned out if I had purchased stock in these companies. This review assumes a "buy and hold" strategy. In practice, I advocate and employ a disciplined portfolio strategy that sells stocks quickly and completely on price declines and slowly and partially as the stock appreciates. This difference in strategy would certainly affect investment performance.
Let's take a look at the three stocks I discussed during the week of September 26, 2005.
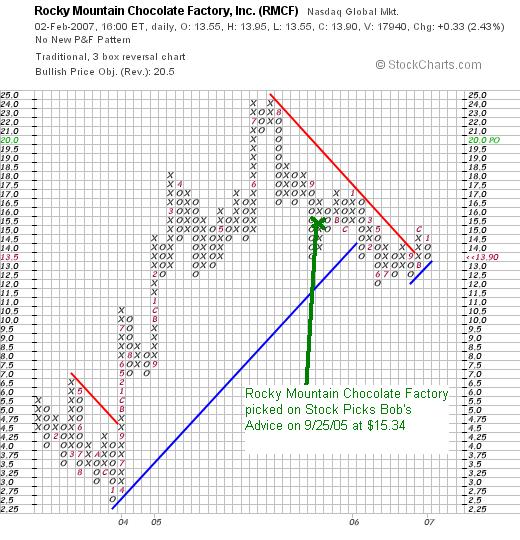
 On September 26, 2005, I posted Rocky Mountain Chocolate Factory (RMCF) on Stock Picks Bob's Advice when the stock was trading at $15.34. RMCF closed at $13.90 on February 2, 2007, for a net loss of $(1.44) or (9.4)%.
 On January 4, 2007, RMCF reported 3rd quarter 2007 results. For the quarter ended November 30, 2006, revenues climbed 13.7% to $9.1 million compared to $8.0 million in the same quarter the prior year. Net earnings climbed 19.4% to $1.3 million, compared to the $1.1 million in the same period last year. Diluted eps climbed 23.5% to $.21/share from $.17/share in the prior year.

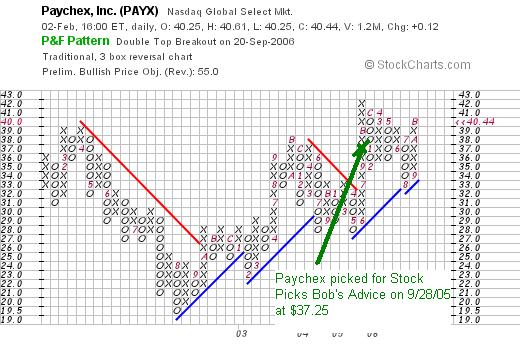
On September 28, 2005, I posted Paychex (PAYX) on Stock Picks Bob's Advice when it was trading at $37.25. Paychex closed at $40.44 on February 2, 2007, for a gain of $3.19 or 8.6% since posting.
On December 20, 2006, Paychex announced 2nd quarter 2007 results. For the quarter ended November 30, 2006, the total revenue came in at $454.9 million, a 14% increase over the $399.8 million reported in the same period last year. Net income came in at $132.7 million or $.35/diluted share, up 18% over the net income of $112.6 million or $.30/diluted share last year. The company beat expectations on earnings which had been estimated to come in at $.34/share, but missed slightly on revenue which had been estimated by analysts at $456 million.
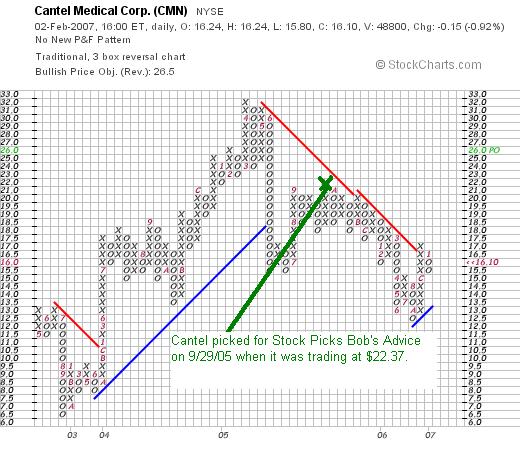
 Finally, on September 29, 2005, I posted Cantel Medical (CMN) on Stock Picks Bob's Advice when it was trading at $22.37. Cantel closed at $16.10 on February 2, 2007, for a loss of $(6.27) or (28)% since posting.
 On December 7, 2006, Cantel reported earnings for the quarter ended October 31, 2006. Sales came in at $50.5 million, up 6% from the sales of $47.8 million reported in the same quarter in 2005. Net income was $1.7 million or $.11/diluted share, down from $2.2 million or $.13/diluted share the previous year. The company missed expectations of $.12/share on earnings, but beat sales consensus of $48.3 million.
Reviewing the chart shows the already evident technical weakness. Certainly, I should avoid "picking stocks" that show this type of weakness regardless of their fundamentals in the future if at all possible.
So how did I do with these three stocks from that week in September, 2005? In a word, mediocre. The three stocks had an average loss of (9.6)%. Clearly, there is nothing magical about what I write. The stocks I cover have the potential of losses so this speaks well against blindly following these "picks" yet the potential of limiting losers and keeping winners is still the redeeming element.
Thanks again for visiting! If you have any comments or questions, please feel free to leave them on the blog or email me at bobsadviceforstocks@lycos.com. If you get a chance, be sure and visit my Stock Picks Podcast Site. It is certainly time for a podcast, now if I can only find the time :).
Bob
Posted by bobsadviceforstocks at 6:20 PM CST
|
Post Comment |
Permalink
Updated: Sunday, 4 February 2007 6:21 PM CST
Friday, 2 February 2007
Cerner Corp. (CERN)
Hello Friends! Thanks so much for stopping by and visiting my blog, Stock Picks Bob's Advice! As always, please remember to consult with your professional investment advisors prior to making any investment decision based on information on this website.
 Earlier today I replaced my holding of Concur Technologies (CNQR) with a purchase of 120 shares of Cerner (CERN). Cerner closed today at $50.61, up $4.81 or 10.5% on the day. (I actually purchased shares at $49.67, shortfly before the close of trading. I believe that this stock 'fits the bill' better than the Concur shares and promised you I would review this company and share with you my thinking.
What exactly does this company do?
According to the Yahoo "Profile" on Cerner, the company
"...supplies healthcare information technology solutions worldwide. It designs, develops, markets, installs, hosts, and supports software information technology and content solutions for healthcare organizations and consumers. The company implements and supports software solutions and hardware that provide healthcare providers with secure access to clinical, administrative, and financial data in real time."
How did they do in the latest quarter?
Yesterday, on February 1, 2007, after the close of trading, Cerner announced 2006 4th quarter results. It was this announcement that actually drove the stock higher today! Fourth quarter 2006 revenues climbed 17% to $380.8 million from $325.8 million in the year-ago same quarter. Net earnings, on a GAAP basis, were $39.1 million with diluted eps coming in at $.48/share. In the prior year, net earnings were $27.4 million, and diluted eps were $.34.
The company beat expectations: analysts were expecting earnings of $.41/share on revenue of $363.9 million. In addition, the company raised guidance for the 1st quarter 2007 to earnings of $.34 to $.35/share, on sales of $365 to $375 million. Analysts are looking earnings of $.35/share on sales of $359.3 million.
What about longer-term financial results?
Examining the Morningstar.com "5-Yr Restated" financials, we can see that revenue has been steadily increasing from $561 million in 2001 to $1.2 billion in 2005 and $1.3 billion in the trailing twelve months (TTM). Earnings have been a bit more erratic early on with a loss of $(.61)/share in 2001 to a gain of $.65, then a dip to $.59/share in 2003. Since then earnings have been on the rise with $.86/share reported in 2004, $1.10/share in 2005 and $1.22/share in the TTM. The company has grown its outstanding shares very slowly, with 69 million in 2001 increasing five years later to 78 million, a just under a 15% increase while revenues have increased more than 100% and earnings have crown similarly by almost 100% since 2002.
Free cash flow has been positive and basically growing with $51 million in 2003, $112 million in 2004, $128 million in 2005 and $126 million in the TTM.
The balance sheet also appears solid, with $276.7 in cash and $407.0 million in other current assets. This total of $683.7 million, when compared to the current liabilities of $264.1 million, yields a current ratio of 2.59. Generally current ratios of 1.25 or higher are considered healthy.
How about some valuation numbers?
Reviewing the Yahoo "Key Statistics" on Cerner, we can see that this is a mid cap stock with a market capitalization of $3.95 Billion. The trailing p/e is a bit rich at 41.69, but with earnings growing rapidly, the forward p/e (fye 31-Dec-07) is estimated at a more reasonable, but not cheap, 29.95. Thus the 5-yr expected PEG ratio is a nice 1.36.
According to the Fidelity.com eresearch website, the Price/Sales (TTM) ratio works out to a reasonable 2.59, with the 'Industry Average' being 5.13. Cerner is also more profitable than the average company in its industrial group with a Return on Equity (TTM) calculated at 12.88 with an industry average listed at (77.54)%. So in addition to being reasonably priced relative to the sales, the company apparently is more profitable than other companies in the same industrial group!
Finishing up with Yahoo, we find that there are 78.14 million shares outstanding with 64.58 million that float. As of 1/9/07, there were 10.57 million shares out short representing 16.30% of the float (!) and the short ratio is an impressive 27.1. That means, considering 5 trading days/week, that it would take over 5 weeks of average trading volume just for the short-sellers to cover their shorts. I suspect very strongly that we are witnessing a 'short squeeze' on this stock that may well continue into next week or longer (?).
No cash dividends are reported and the stock split 2:1 last year on January 10, 2006.
What does the chart look like?
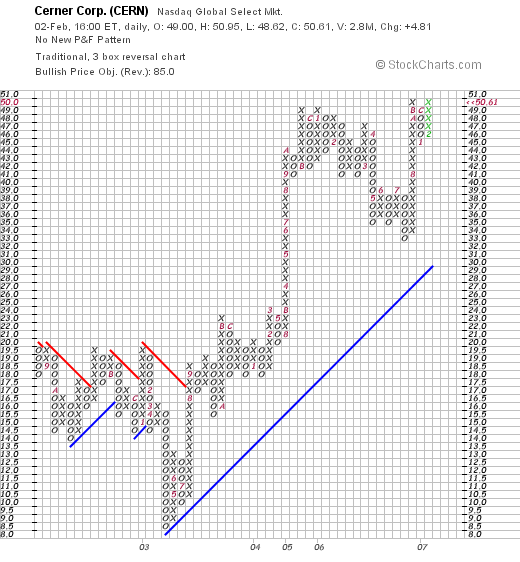
If we review a "Point & Figure" chart on Cerner from StockCharts.com, we can see that as we reported earlier, the period between 2002 and 2003 was a bit erratic (as was the earnings), with the stock dropping from $19.50 in August, 2002, to a low of $8.50 in April, 2003. Since that time, the stock has fairly steadily moved ahead and actually appears only now to be once again breaking into new high territory. The chart looks encouraging to me!
Summary: What do I think about Cerner?
First of all, let me qualify this entire entry and remind everyone that I have purchased shares of Cerner and this stock is part of my trading portfolio now. That being said, the reason why I bought shares is first of all, the stock is showing good daily momentum today, making the top % gainers list. The latest quarter was solid, with strong revenue and earnings growth that both exceeded expectations. In addition, the company raised guidance for the upcoming quarter.
The Morningstar.com report is solid with steady revenue and earnings growth the past few years, steady shares outstanding, nice free cash flow which is basically increasing, and a solid balance sheet. Valuewise, the p/e is indeed a bit rich, but with earnings growing strongly, the PEG is under 1.5, the Price/Sales is cheap for its group, and the ROE is higher than the average company in its group as well. Finally, there is a TON of shares out short that need to be purchased. It will literally take weeks for the short-sellers to cover their bets against the company without a large increase in average daily volume. Finally, the chart looks strong. There is little not to like about this stock! And that's why I made the switch!
Thanks again for dropping by! If you have any comments or questions, please feel free to leave them on the blog or email me at bobsadviceforstocks@lycos.com. If you get a chance, drop by my Stock Picks Podcast Website, where you can download mp3's of me discussing manyt of the stocks I write about here on the blog.
Have a great weekend!
Bob
Cerner Corp. (CERN) "Trading Transparency"
Hello Friends! Thanks so much for stopping by and visiting my blog, Stock Picks Bob's Advice! As always, please remember that I am an amateur investor, so please remember to consult with your professional investment advisors prior to making any investment decisions based on information on this website.
Earlier today I 'undid' my purchase of Concur Technologies (CNQR). The stock was actually higher from where I had purchased it yesterday but it simply did not follow my own peculiar trading rules for a stock. I gave it some thought; considered just hanging in there with the purchase, but decided against it, and sold my shares. Since this was neither a sale on 'good news' or a sale on 'bad news', but rather a purchase and sale on a 'dumb mistake', I decided to go ahead and replace this stock with another stock, which hopefully would meet my investment rules.
This afternoon I purchased 120 shares of Cerner Corp. (CERN) at a price of $49.67. Cerner was on the top % list and had a great day, closing at $50.61, up $4.81, or 10.50% on the day. I had thought I had reviewed this stock already, but I cannot find it on the blog (lol) (I had to Google my own blog...do you ever have that problem?), and promise to attempt to get it reviewed if not shortly then sometime this weekend.
Thanks so much for stopping by and visiting! Have a great weekend everyone!
Bob
Concur Technologies (CNQR) "Trading Transparency"
Just a short note. A few moments ago I decided to pull the plug on my CNQR stock. I bought this yesterday quite frankly without conscientiously doing my homework and when yesterday evening I went through the numbers, it just didn't add up. I don't like how the company is to be making less money this year than last, how they missed expectations on the earnings side, and even though I bought it (and publicly at that!), and even though the stock is up fractionally today, it just isn't my investment style.
So out it went. I sold my 240 shares of CNQR at a price of $17.82, with a net of $4,277.19. I purchased these yesterday at a price of $17.40, and a cost of $4,185.89, so I did make almost $100, but that is not the point. It wasn't my strategy, I didn't think before I bought it....and out it went!
However, I shall be on the look-out this afternoon for a stock that does fit instead of CNQR. I just feel better this way rather than leaving it in my portfolio when I bought it for the wrong reasons.
Relieved,
Bob
Thursday, 1 February 2007
Concur Technologies (CNQR)
Hello Friends! Thanks so much for stopping by and visiting my blog, Stock Picks Bob's Advice. As always, please remember that I am an amateur investor, so please remember to consult with your professional investment advisors prior to making any investment decisions based on information on this website.
 This afternoon, after selling a 1/6th of my holding in Precision Castparts (PCP), I had the opportunity of buying another position. As I like to do, I went to the top % gainers list to see if there were any stocks there that met my criteria for investing. There I found Concur Technologies (CNQR) which closed at $17.42, up $2.37 or 15.75% on the day. I purchased 240 shares of CNQR at a price of $17.40, shortly before the close of trading.
As I promised earlier today, let's take a look at this company and I think I can show you why it belongs on this blog and why I chose to take a position in this stock!
What exactly does this company do?
According to the Yahoo "Profile" on Concur, the company
"...provides business services and software solutions that automate corporate travel and expense management processes in the United States. Its flagship services include Concur Expense, an expense reporting solution that provides the process and information for management to reduce manual processing, improve internal controls, increase business policy compliance, speed up reimbursement, and increase expense report accuracy; and Cliqbook Travel, which enables customers to provide online corporate travel booking capabilities to its employees and enables customers to search for travel data from multiple sources, as well as delivers online booking, reporting, and agency support."
How did they do in the latest quarter?
Yesterday, after the close of trading, Concur (CNQR) announced first quarter 2007 results for the quarter ended December 31, 2006. Total revenue for the quarter climbed 52% from last year's results to $29.2 million from $19.3 million last year. This was also a sequential increase of 6% from the previous quarter. Net income was $1.0 million, or $.02/share, compared to net income of $.6 million or $.02/diluted share in the year ago quarter. This year's quarter included a provision for income taxes of $1.4 million, compared to no provision for taxes in the prior year. However, in general I prefer to see increasing earnings regardless of the reason, and might not have purchased this stock if I was more critical at the time of my purchase!
The company beat expectations for revenue, with analysts expecting revenue of $27.5 million and missed estimates for earnings with the $.02 reported, when analysts were expecting $.05/share. In the same article the company is reported to guide analysts to $29.5 million in the upcoming quarter and $.02/share in earnings. Total 2007 results is expected to be revenue of $121 to $125 million and earnings of $.10/share. Again, looking closely, this stock is not a perfect match for my strategy of increasing revenue and earnings.
What about longer-term results?
Checking the Morningstar.com "5-Yr Restated" financials on CNQR, we can see that revenue has steadily increased from $45 million in 2002 to $97 million in 2006. Earnings, which were at a loss of $(.46)/share in 2002, turned profitable at $.03/share in 2003 and have steadily increased since them to $.87/share in 2006.
The company has also increased the number of shares outstanding from 27 million in 2002 to 36 million in the TTM, while revenue was up 100%, shares outstanding increased by only 33%.
Free cash flow has been erratic but positive recently at $1 million, up from a $(3) million in 2005.
The balance sheet is adequate with $16.3 million in cash and $32.7 million in other current assets. This easily covers the $39.4 million in current liabilities which works out to a current ratio of 1.24. In addition, the company has $24.6 million in long-term liabilities.
How about some valuation numbers on this stock?
Checking Yahoo "Key Statistics" on CNQR, we can see that this is a small cap stock with a market capitalization of $545.97 million. The trailing p/e is a reasonable 19.98, with a forward p/e of 42.49.
Using the Fidelity.com eresearch website for more information, we find that the Price/Sales (TTM) works out to a modest 5.47 compared to the industry average of 5.74. This company reported a Return on Equity (TTM) of 40.22% compared to an industry average of 21.27%.
Finishing up with Yahoo, we find that there are 36.21 million shares outstanding and 32.47 million that float. Currently there are 5.12 million shares out short as of 1/9/07. Currently there are 5.12 million shares out short which is 14.70% of the float or 10.4 trading days of volume. Today's sharp move higher on relatively unimpressive earnings, suggests the possibility that the 10.4 trading days of volume (the short interest), might well be at work with a 'squeeze' of the short sellers.
No dividend and no stock split is reported on Yahoo.
What does the chart look like?
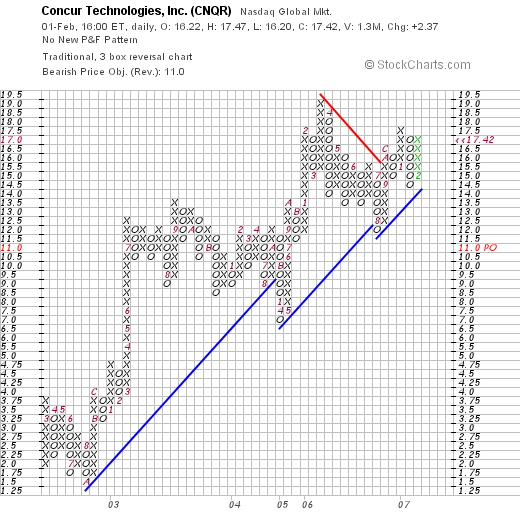
Looking at the "Point & Figure" chart on Concur from StockCharts.com we can see a fairly strong price performance from a low of $1.50 in September, 2002, to a high of $19.00 in March, 2006. Since then the stock pulled back to $12 only to resume its upward march.
Summary: What do I think?
To tell you the truth (lol), I think if I had looked at this one closely, I might have passed on this purchase. I don't like flat earnings, I don't like that the next 12 months will have earnings under the prior year's results. Otherwise the numbers are supportive of the purchase. I shall have to watch this one relatively closely and sell it if the price performance is under question. Otherwise the chart appears strong.
Thanks so much for stopping by! If you have any comments or questions, please feel free to leave a comment on the blog or email me at bobsadviceforstocks@lycos.com.
Bob
Concur Technologies (CNQR) "Trading Transparency"
Hello Friends! Thanks so much for stopping by and visiting my blog, Stock Picks Bob's Advice! As always, please remember that I am an amateur investor, so please remember to consult with your professional investment advisors prior to making any investment decisions based on information on this website.
A few moments ago, I spent my nickel :(. With the 'permission slip' to buy a new position with the Precision Castparts, I set out to find a stock that met my criteria on the top % gainers list. I came across a new name, Concur Technologies (CNQR) that fits the bill, and I purchased 240 shares at $17.40.
As I write, CNQR is trading at $17.40, up $2.35 or 15.61% on the day. When I get a chance, I shall write up an entry on this stock and 'make sure' that this stock fits my needs. But I have already purchased shares so.....anyhow, will get to it at a later time. Meanwhile, I shall need to settle down a bit. Haven't had this busy a couple of days for awhile!
Thanks again for stopping by! If you have any comments or questions, please feel free to write them on the blog or email me at bobsadviceforstocks@lycos.com.
Bob
Newer | Latest | Older


