Stock Picks Bob's Advice
Sunday, 25 November 2007
"Looking Back One Year" A review of stock picks from the week of May 22, 2006

Hello Friends! Thanks so much for stopping by and visiting my blog, Stock Picks Bob's Advice! As always, please remember that I am an amateur investor, so please remember to consult with your professional investment advisers prior to making any investment decisions based on information on this website.
The weekend is almost over and I haven't written up my review. Let's take a look at the stocks I posted on this blog during the week of May 22, 2006. Each weekend I try to move ahead a week on this review which is now more like a year-and-a-half out, instead of a year. Last week I reviewed the picks from May 15, 2006.
These reviews assume a buy-and-hold approach to investing with equal dollar sized purchases of each of the stocks reviewed. In reality, I advocate and follow a fairly disciplined buying and selling strategy with my holdings including quick sales on stock declines and partial sales on stock appreciation. This difference in strategy would certainly affect portfolio performance but for the ease of this review, I assume a simple purchase of each stock discussed and an analysis is based on this assumption.
 On May 25, 2006, I posted Toro (TTC) as a 'revisit' on Stock Picks Bob's Advice when the stock was trading at $47.89/share. Toro closed at $53.02 on November 23, 2007, for a gain of $5.13 or 10.7% since posting.
On August 23, 2007, Toro (TTC) reported 3rd quarter 2007 results. The company reported revenue of $478.7  million, up slightly from revenue of $477.9 million in the same quarter the prior year. Net earnings came in at $42.5 million or $1.02/diluted share, up from $40.3 million or $.91/diluted share the prior year.
The Morningstar.com "5-Yr Restated" financials page is intact, with steady revenue growth, earnings growth, dividend growth and free cash flow growth. The outstanding shares have been modestly declining and the balance sheet is solid.
TORO (TTC) IS RATED A BUY
Let's take a look at the 'point & figure' chart from StockCharts.com:
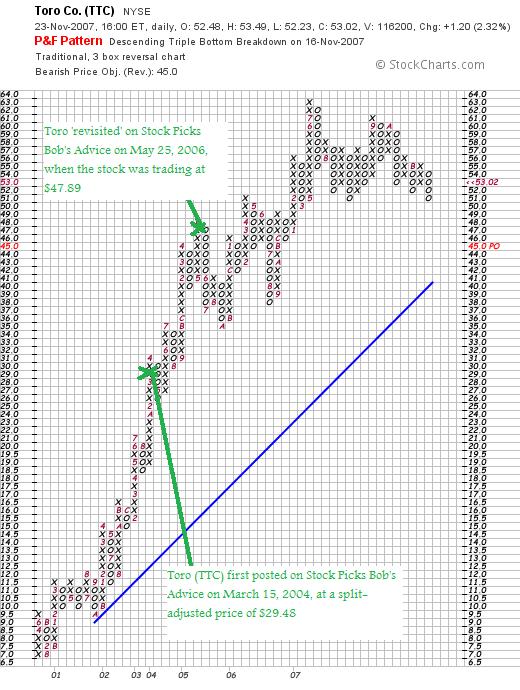
We can see that while the stock price momentum has recently been under pressure, the upward move of this stock is still intact.
 On May 26, 2006, I posted Buffalo Wild Wings (BWLD) on Stock Picks Bob's Advice when the stock was trading at $39.42. On June 18, 2007, BWLD had a 2:1 stock split, making my effective 'pick price' actually $19.71. BWLD closed at $27.23 on November 23, 2007, for a gain of $7.52 or 38.2% since posting.
On October 30, 2007, Buffalo Wild Wings announced 3rd quarter 2007 results. Total revenue climbed 20.5% to $82.4 million up from $68.3 million. Same store sales increased 8.3% at company owned restaurants and 5.9% at franchised restaurants. Earnings per share for the quarter came in at $.24/share, up from $.20/share the prior year.
Unfortunately, the company missed expectations on earnings which per Thomson Financial had been at $.26/share. However, revenue beat expectations of $81.4 million.
On a positive note, the Morningstar.com "5-Yr Restated" financials page appears intact. The company shows steady revenue growth, earnings growth, and relatively stable outstanding shares since 2004. (up sharply from 5 million to 16 million shares between 2002 and 2004.) Free cash flow is positive and growing and the balance sheet is solid.
BUFFALO WILD WINGS (BWLD) IS RATED A BUY
Let's take a closer look at the 'point & figure' chart on BWLD from StockCharts.com:
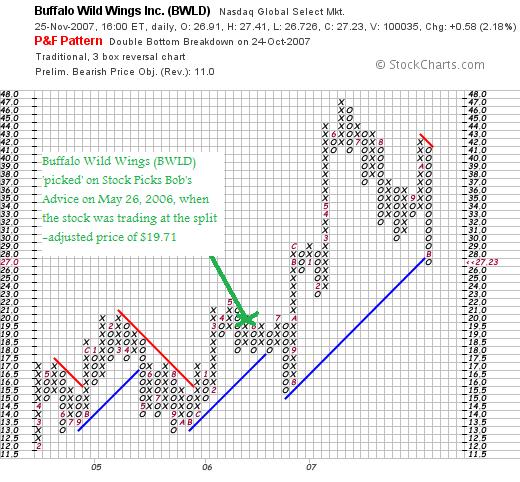
We can see in the above chart how the recent correction in the market has been bringing the price of BWLD down. I suspect the latest quarterly report when the company came in a couple of pennies light on estimates of earnings is making a difference in the price movement.
So how did I do with these two stocks? Really not bad. In fact, they both appreciated in price and the average of these two stocks was a gain of 24.5%.
Thanks again for visiting! If you have any comments or questions, please feel free to leave them on the blog or email me at bobsadviceforstocks@lycos.com. If you get a chance, be sure and visit my Stock Picks Podcast Website. Also check out my Covestor Page where Covestor has been analyzing my actual trading portfolio. And my SocialPicks page where all of my many picks from the first of the year have been evaluated.
Have a great week trading and stay well!
Bob
Saturday, 24 November 2007
Bidz.com (BIDZ)
Hello Friends! Thanks so much for stopping by and visiting my blog, Stock Picks Bob's Advice! As always, please remember that I am an amateur investor, so please remember to consult with your professional investment advisers prior to making any investment decisions based on information on this website.
 I was getting to do the weekend review and I realized I hadn't really picked any stocks this week for the blog :(. So since the market had climbed nicely, I figured there 'must be a pony in there somewhere' and set out to look.
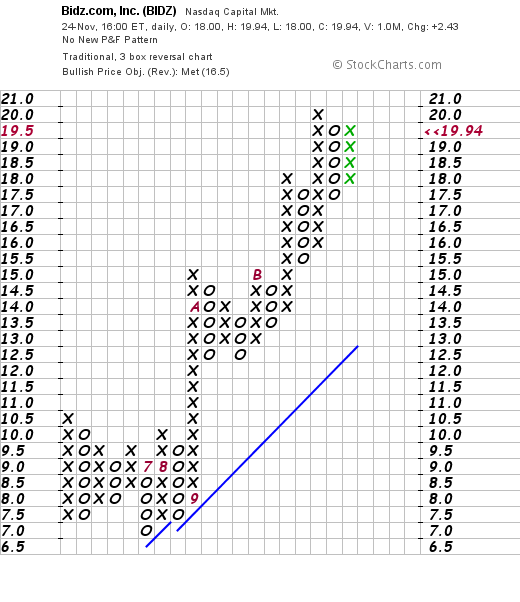
Looking through the list of top % gainers on the NASDAQ I came across BIDZ.com (BIDZ), a jewelry auction website that made the list and appears to deserve a place on this blog. BIDZ closed at $19.94, up $2.43 or 13.88% on the day!
BIDZ.COM (BIDZ) IS RATED A BUY
Let's take a look at this stock and I will explain why I chose this stock from all of the others moving higher yesterday. I do not own any shares nor do I have any options on this stock. And I still am leery of 'dot.com' stocks!
What exactly does this company do?
 According to the Yahoo "Profile" on BIDZ, the company
"...operates as an online retailer of jewelry primarily in the United States and internationally. The company operates a Web Site, BIDZ.com, for the purpose of selling merchandise, utilizing an online sales auction platform. Its product inventory includes gold, platinum, and silver jewelry set with diamonds, rubies, emeralds, sapphires, and other precious and semi-precious stones; and watches. Its products also include rings, necklaces, earrings, and bracelets."
How did they do in the latest quarter?
On November 12, 2007, BIDZ announced 3rd quarter 2007 results for the quarter ended September 30, 2007. Revenue came in at $40.1 million, up 48% over last year's $27.1 million. Net income for the period came in at $3.6 million or $.14/diluted share, up sharply from the $997,000 or $.04/diluted share reported the prior year.
The company easily beat expectations for the quarter which had been for $.11/share according to Reuters Estimates. In addition. the company raised guidance for the full year 2007 to revenue of $180 to $182 million. Analysts, per Reuters, had been expecting full year revenue of $170 to $180 million.
What about longer-term results?
Looking at the Morningstar.com "5-Yr Restated" financials on BIDZ, we find that revenue has steadily increased from $35 million in 2002 to $132 million in 2006 and $162 million in the trailing twelve months (TTM).
Earnings have also steadily improved from a loss of $(.40)/share in 2002 to break-even in 2004 to $.10/share in 2005 and $.40/share in the TTM.
Free cash flow has been a little less exciting with $-0- reported in 2004 improving to $1 million in 2006 and $0 million in the TTM. I, of course, would like to see a little positive free cash flow, but at least the company is not burning up its cash like some small companies and the old dot.com stocks.
Looking at the balance sheet, we see a satisfactory picture (imho), with $1 million in cash and $50 million in other current assets, balanced against current liabilities of $32.8 million. There are not long-term liabilities reported on Morningstar.com. This yields a satisfactory current ratio of 1.55.
What about some valuation numbers?
Looking at Yahoo "Key Statistics" on BIDZ, we can see that this is a small cap stock with a market cap of $475.45 million. The trailing p/e is a bit rich at 45.32, with a forward p/e a bit better at 39.88. However, the earnings are growing so quickly that the PEG (5 yr expected) works out to a downright cheap figure of 0.67. (I figure on a PEG of 1.0 to 1.5 being reasonable.)
Utilizing the Fidelity.com eresearch website, we find that the Price/Sales (TTM) ratio works out to 2.89, compared to the industry average of 11.80. In terms of profitability, the Return on Equity (TTM) also looks terrific at 85.81%, compared to an industry average of 16.72%.
Returning to Yahoo, we can see that there are 23.84 million shares outstanding but only 10.96 million that float. As of 10/26/07, there were 912,120 shares out short, resulting in a short ratio of 5.6 I generally use an arbitrary '3 day rule' for the short ratio in determining significance. With this significantly over 3, the stock looks vulnerable to a short squeeze. For me, without any negative news, this may well be a bullish sign.
No cash dividend is paid and no stock splits are reported on Yahoo.
What does the chart look like?
Looking at the "point and figure" chart on BIDZ from StockCharts.com, we can see that while the stock was consolidating between $10.50 and $7.00 between June and July of this year, the stock broke out to the upside in September climbing to $15, pulling back and climbing again higher to $20. The stock is nearing this high and appears to be poised to move higher. The chart looks strong to me.
Summary: What do I think?
Needless to say, I like this stock! Let me review some of the things that piqued my interest (how do you like THAT word!) The stock moved nicely higher yesterday, the latest quarter was strong and the company beat expectations and raised guidance. The longer-term fundamentals look great with steadily improving revenue and earnings while the outstanding shares have remained very stable. Free cash flow could be better but isn't negative, and the balance sheet is solid.
Valuation-wise, the p/e is certainly a bit rich but the PEG is under 1.0, the Price/Sales is lower than the industrial group, and the Return on Equity is higher than its peers.
Finally, there are lots of shares out short, and the chart looks strong. As a final note, I feel some loyalty to the stock as I grew up near Culver City where this company is headquartered in California. I know that's a silly reason, but I like to share with you all of my thinking. And no, I don't know anyone in the management or who owns shares.

A picture of Culver City.
Thanks so much for visiting! If you have any comments or questions, please feel free to leave them on the blog or email me at bobsadviceforstocks@lycos.com. If you get a chance, be sure and visit my Stock Picks Podcast website where you can hear me discuss a few of the stocks on the blog and perhaps listen to me read a poem :). Hey it's my podcast, and I get to do what I like :). I promise not to pull of any heads of syrofoam animals or throw any chairs like my favorite investor/entertainer Jim Cramer!
Also, be sure and visit my Stock Picks Covestor Page where my actual trading portfolio is monitored and evaluated. While you are at it stop by and visit my SocialPicks Page where all of my stock picks are discussed.
Finally, if you are interested in a different kind of investment, one that is not without significant rich, but potentially showing nice returns, consider visiting Prosper.com where you can participate in person-to-person loans in an eBay fashion bidding process where you anonymously enter small portions of a larger loan as a bid and become part of a loaning consortium. I now have about 19 loans outstanding. So far everyone is current and I am earning an average of approximately 15% on my loans. Now of course, there is tremendous risk in these unsecured loans, so do you homework before investing in Prosper. If you sign up before the end of the year and make a loan, you will be credited with $25 (and I will also receive credit for sending you over!)
Have a great weekend everyone! Please feel free to comment here on the blog or email me at bobsadviceforstocks@lycos.com.
Bob
A Reader Writes "Have you ever considered scaling into your positions...?"
Hello Friends! Thanks so much for stopping by and visiting my blog, Stock Picks Bob's Advice! As always, please remember that I am an amateur investor, so please remember to consult with your professional investment advisers prior to making any investment decisions based on information on this website.
What a volatile week! Thank goodness trading was closed on Thursday for Thanksgiving. And I am already having buyer's remorse for buying the big chunk (for me) of Graham (GHM). Not that I don't think it is a fabulous stock--it is just that I did break all of my rules, investing when my system was telling me to pull back into equities, and then buying a larger position than usual. I guess I shall just employ my 8% limit and selling strategy on that position as well.
 Anyhow, I had a nice letter from Gleb today who is a fellow covestor participant. Gleb wondered about my buying strategy. (After my impulse buy on Graham I wonder if I am qualified to give an opinion at all :(). Gleb wrote a nice letter:
Hi Bob,
I have been reading your blog for some time now and have a new question for you. At times like these in the stock market, have you ever considered scaling into your positions instead of buying all of the shares at once (ie. buying 1/2 of your position and then adding the other half if the price of the stock drops 8%). This way even if the stock falls 8%, you don't have a 8% loss on your whole position after averaging in the new purchase and then being able to give the stock some more leeway to turn around.
I utilized this technique on BTJ and it proved to be effective for me there.
Please let me know if you have any thoughts on this.
Best regards,
Gleb from Brooklyn, NY (pinkfl0ydg on Covestor)
First of all, thank you for writing. As you know, I do have a rather unstaged purchase approach to investing and a staged selling. You might be onto something about staging a buy. Buy buying on weakness?
Let's think about that stock that is declining in price and you chose to buy some shares like Bolt (BTJ). I do like the idea of buying a 1/2 position. But then the stock plunges in price and you decide that you should add after it declines 8%. Instead of turning around, the stock keeps dropping. You would have to have another sale point....perhaps at a 16% loss. In that case instead of losing 8% after a large initial purchase, you have lost approximately 12%....4% on the first purchase (1/2 of your total dropped 8%) and then another 8% (the entire position drops 8%). So this doesn't really solve the problem of volatility.
Let me try another approach. Let's say since we are thinking of incremental purchases that we purchase 1/2 of our desired position. For instance if we were thinking of a $6,000 purchase, we purchase $3,000 of the desired stock. Now, instead of buying more on a decline, we simply give the stock greater room to play....after all it is only a 1/2 position. So instead of selling at 8% loss, we give it all the way to a 16% decline before unloading our position. Essentially, we would have the same 8% loss as before.
Now, instead of buying on weakness, we wait until the stock has appreciated 8% to buy the other half. After we have purchased the second half, we still sell the stock if it declines to an 8% loss (instead of 16%), but insuring that the stock would need to demonstrate some strength until we commit our entire funds as planned to that position. I like this approach better.
I don't like buying stocks on weakness. I would rather buy a smaller position, give it more room to trade and then if it starts moving higher, we would employ a well known strategy of
averaging up in investing.
Gleb, thanks so much for being a loyal reader and writer. Please feel free to comment in the comments section (you and all of my readers), or feel free to drop me another line at bobsadviceforstocks@lycos.com. If you get a chance, be sure and visit my
Stock Picks Podcast Website, my
Covestor Page where Covestor reviews my actual trading account and you can view other investor's actual portfolios and their performance, and my
SocialPicks page where SocialPicks reviews my stock picking from the blog!
Have a great weekend!
Bob
P.S. If any of you are interested in participating in Covestor, please leave me a comment on the blog or email me and I can give you a formal invitation to participate. I have four invitations remaining. You might not need it, but if you do, please feel to let me know!
Friday, 23 November 2007
Graham (GHM) "Trading Transparency"
CLICK HERE FOR MY PODCAST ON GRAHAM
Hello Friends! Thanks so much for stopping by and visiting my blog, Stock Picks Bob's Advice! As always, please remember that I am an amateur investor, so please remember to consult with your professional investment advisers prior to making any investment decisions based on information on this website.
I just spent I don't know how much ink writing about trading discipline and there I go again. Buying a stock without a "permission slip". But I would like to start thinking about a 'hybrid' trading system. That is, utilizing a basic portfolio management system and also investing occasionally in single issues with larger positions taken without regards to the 'rules'. I am probably going to regret this diversion, but I am still learning, and I hope you are learning as well with me.
Last month I wrote about Graham Corporation (10/27/07), a stock that Doug S. brought to my attention, thinking correctly that it was 'my kind of stock'. I will refer you back to last month's entry for details about the company.
In a nutshell,
The stock made the top % gainers list today, trading at $61.60, up $2.85 or 4.85% on the day as I write.
Latest quarterly report was very strong.
The company announced a 5:4 stock split and raised its dividend.
The Morningstar.com "5-Yr Restated" financials looks solid.
And the 'point & figure' chart from StockCharts.com appears to show continued positive momentum.
With all of that in mind, I broke my trading rules (once again) and purchased 400 shares at $62.4399. Wish me luck.
I am concerned about the general direction of the market. The sub-prime mess, the near-$100/barrel oil price, the weak dollar, and the imploding housing market.
So once again, throwing caution to the wind, I jumped in on Graham (GHM). It's a great stock. But can it hold up in a correction? Time will tell.
If you have any comments or questions, please feel free to leave them on the blog or email me at bobsadviceforstocks@lycos.com. If you get a chance, feel free to visit my podcast site where I discuss many of the same stocks I write about on the blog, my Covestor Page where Covestor tracks my actual trading account, and my SocialPicks page, where for the last year, SocialPicks has been tracking all of my stock picks.
Bob
Wednesday, 21 November 2007
A Reader Writes "What are the most important things you think a new trader should look at?"
Hello Friends! Thanks so much for stopping by and visiting my blog, Stock Picks Bob's Advice! As always, please remember that I am an amateur investor, so please remember to consult with your professional investment advisers prior to making any investment decisions based on information on this website.
Happy Thanksgiving!
(Turkey from the MIT website)
I hope that you all have a chance to spend some time with family and friends, enjoy the Thanksgiving holiday, and share your expressions of appreciation with each other.
I am personally thankful of all of you who visit, write, and make blogging here on this website as enjoyable experience as it is for me!
Speaking of receiving email, I had a good email a short while back about investing that I kept meaning to respond to and tonight I guess is as good a time as any to comment.
Terry wrote me about investing in general and in particular, the SIRI and XMSR merger.
He wrote:
Hey Bob,
I just Ran into your site searching and wanted to ask you a question. I am new to Trading and have been studying real hard and as of yet. Haven't bought a thing but hope to trade in the near future.
I wanted to ask you. How do you do in trading ?
What is the most important things you think a new trader should look at in a company before buying their stock.
One of my big problems as of now is I don't know how people figure out all of these percents of companies income's. Like this one about the 14%. I'm not a real smart guy but I do have common sense and can do this over time. How did this guy figure the 14%.
When the merger agreement was signed (Feb 23rd) SIRI traded at $3.74 and XM traded at $15.10. The agreement stated that each XM share will be exchanged for 4.6 SIRI shares.
At the time of the announcement that meant that SIRI would pay $17.204 per XM share (4.6 x 3.74) which is a premium of about 14% ( $2.1 premium per share).
Hope you don't mind me asking and good luck to you in your Trading. Future Trader. Terry
Terry, first of all thanks so much for writing and visiting. I am sorry it took so long to get back to you. I have been thinking about some of the questions you wrote and would like to respond to the best of my ability. As I have written numerous times on my blog, I am also an amateur investor. I have just been buying and selling and holding stock for a good bit longer than you. You are welcome to my experience and perspective.
Let me try to get through your comments and questions in order.
You first write:
"How do you do in trading?"
I am doing just fine thank you :). Seriously, you can follow my actual trades and my trading account by visiting my
Covestor page. Covestor is a website that monitors my actual trades and my account without my active participation. So they are about as unbiased a source as I could possibly imagine. If you look through the Covestor page, you will see that there are many other investors that are doing better than I am doing, but I am still ahead of the market for the period which Covestor has been following me (since June 12, 2007).
For 2007, my trading account which currently has a value of $54,535.50 as of today's close (including the sharp drop in stocks today). I have a net unrealized gain in the account currently of $21,014.62. (that means my stocks that I own but haven't sold are currently selling for $21,014.62 more than my purchase price overall.) As of this morning, I had a net realized gain of $30,458.17. However, I did take a small loss in BMC this morning that should drop that just under $30,000. That means that if you add up all of the gains and all of the losses in my trading account, for 2007 I have realized, which means taken actual trading gains nearly $30,000.
So this year has been kind to me. I am doing just fine thank you.
Your next question:
"What is the most important things you think a new trader should look at in a company before buying their stock."
This is what this blog is about. I am continually examining the criteria that I believe to be critical in selecting a stock. I can only share with you what I personally like to do at this time. Not what is the right answer. There are many different approaches to investing. There is what I would call the "technicical" approach that involves looking at stock charts to determine appropriate investment timing, there is the "value" approach which I would include the 'Warren Buffett' investors who like to buy a stock as cheap as possible. Then there are the "momentum" investors who look for stocks that are moving higher and trying to ride the trend.
For me, each of these approaches is attractive and reasonable. I have chosen what I would describe as an 'eclectic' approach to investing. I like to draw from each of these analyses to decide about which stock might be the right one for me.
I first look towards momentum, choosing to pick a stock that is moving higher on the day that I buy it. I next start doing a fundamental analysis, identifying the results of the latest quarter and the Morningstar.com "5-Yr Restated" financials on the stock. Finally, I like to look at the 'point & figure' chart. It is my way of looking to see that the stock price is basically appreciating.
There isn't anything magical about what I do. Nor do I have any secret approaches that require you to send money to me to get the information. I just like to write about stocks and share what I know for every investor, new and experienced, to consider.
Most of what I do in picking stocks is looking for stocks that have certain 'profiles'. I know what the stock should look like. And if the shoe fits....well then I write it up. I really would suggest that you go through the blog, read as many of the entries as possible, and see if you can see and understand what I am doing. You might not and probably should not agree with my approach, but you are welcome to utilize any of my thinking as you develop your own strategy for investing.
My 'profile' of a stock that is 'investable' includes a consistency in revenue growth, earnings growth, and free cash flow growth. Outstanding shares should be stable and if possible they should be paying a dividend and increasing it as well. The latest quarter should show positive revenue and earnings growth and hopefully they beat expectations and raised guidance. You will hear these themes repeated over-and-over if you read my entries. Finally, I would rather buy a stock with reasonable valuation, that is a p/e that isn't too high, a PEG between 1.0 and 1.5 or lower, a Price/Sales ratio that is less than the average in the industry and possible a significant number of shares out short that may end up being "squeezed". The chart should show a stock that is steadily appreciating.
You will note that this discussion doesn't include the what of the company. If there is a company that indeed I recognize their product (like Garmin (GRMN) that I recently wrote-up), then that is all the more powerful a story. That is the 'Peter Lynch' portion of the investing story.
Beyond that, I find it critical to have a portfolio management system in place. By that, I mean a system of knowing when and what to buy and when and what to sell and how much. For me, I aggressively sell on declines and sell portions of my holdings on appreciation. You can do whatever you like, but I find this helpful in managing my portfolio.
We all need 'signals' to let us know when to be buying new positions and committing new funds to the market. Some people just wait for the right stock and then buy when the 'price is right'. For me, I have built in a system of shifting into and out of equities using my own portfolio as the indicator. Simply put, when a stock of mine is sold on bad news (like my BMC I sold today), I use this as a signal that 'something is rotten' in the market (as indeed it is), and 'sit on my hands'. That is I shift from equity exposure into cash for that position. I do not reinvest my funds into a new position unless I have a signal to buy a new stock (which for me is a partial sale of one of my existing holdings at an appreciation target)---or if I am at my minimum of 5 positions and one of those is sold, then I am 'directed' to replace that position with an appropriate stock when that opportunity arises.
It is with this method that I try to respond to the market in as automatic a fashion as possible. It is logical. I just don't know if it really will work.
I am not sure about your question about the SIRI and XM merger. It seems like your calculation answered your question. If you wanted, you could buy XM stock and do what is called 'arbitrage' which is to speculate on the final closure of the stock at the arrangement described and collect the difference between the proposed merger deal and the current market price, which I guess as you write is 14%. I haven't done the calculation. And frankly, neither of these two stocks attracts me much because they just don't meet what I call my idiosyncratic method :).
Now you might ask why everyone in the whole world doesn't just jump in and buy XM if they are going to make an 'easy 14%'. But it really isn't that simple, is it? There is the risk that the deal goes bust. There are real anti-trust concerns about the only two satellite providers merging. After all, two companies were specifically created to allow for some competition. We really are in a relatively lax regulatory environment, so the merger may well move ahead. And you might just make some money if you play the merger.
But I am not into arbitrage situations. I like to invest in the highest 'quality' companies available. These are the ones that I write about. I am not particularly clever or imaginative. I am just trying to make a little money over the long haul. And I am very happy to share with you and all of my readers my thoughts, whatever they may be worth.
I hope this answers you questions. If not, please feel to write me again, comment on the blog, or drop me a line at bobsadviceforstocks@lycos.com. You all are welcome to visit my
Covestor page, where my trading account is analyzed, my
SocialPicks Page where my many picks are reviewed by SocialPicks another website, and my
Podcast Page, if you would like to hear me talk about a few of the many stocks I blog about on the website.
Meanwhile, I wish all of you a wonderful and Happy Thanksgiving holiday. Tell the ones you love how much you love them. Be thankful that you live in a world that allows you to celebrate freely and work hard to protect that freedom for you and your children.
Bob
BMC Software (BMC) "Trading Transparency"
Hello Friends! Thanks so much for stopping by and visiting my blog, Stock Picks Bob's Advice! As always, please remember that I am an amagteur investor, so please remember to consult with your professional investment advisers prior to making any investment decisions based on information on this website.
That bear market is gnawing at my portfolio! (Or is it a bear yet? Supposed to be a 10% correction---it ought to be close). My recent purchase of BMC Software (BMC) was undone this morning as the stock hit an (8)% loss and I sold my 210 shares at $31.61. These shares were just purchased on 11/7/07 at a cost basis per share of $34.43. Thus, my loss was $(2.82)/share or (8.2)% since purchase.
Since I don't know of any fundamental difference between when I purchased the stock and now, except that the market is weak and most stocks are down, even though I have now sold my own shares,
BMC SOFTWARE (BMC) IS RATED A HOLD
Regarding what I do with the proceeds, since this is a sale on 'bad news', that is a decline in stock price, I 'sit on my hands' with the proceeds. That is, I am shifting from equity towards cash as I would want my portfolio do do in a weak market. But I don't really need to think about it. I just need to pay attention and listen to what my own shares are telling me to do!
Thus, I am now down to 13 positions (from a maximum of 20 and above the minimum of 5) and shall be waiting for some 'good news' to add a postion.
Thanks so much for stopping by and visiting. Please feel free to leave any comments you might have, otherwise you can certainly email me at bobsadviceforstocks@lycos.com with your comments or questions. I read all of my emails but don't have time to answer all of them.
Bob
Saturday, 17 November 2007
"Looking Back One Year" A review of stock picks from the week of May 15, 2006
Hello Friends! Thanks so much for stopping by and visiting my blog, Stock Picks Bob's Advice! As always, please remember that I am an amateur investor, so please remember to consult with your professional investment advisers prior to making any investment decisions based on information on this website.
I missed the review last weekend. That's how my 'looking back a year' looks more and more like a year-and-a-half! In any case, I shall try to get this review posted this evening. I just have two stocks to review so it shouldn't be too bad :).
These reviews that I do are my way of examining the stocks that I posted about a year previously in some sort of methodical fashion. It helps me identify those things that are working in my process, and those that aren't. It will also give you a chance to see how this blog is doing in picking stocks. Credibility. That's what I really seek here. I hope that I shall be successful in my stock picking, but more important, is an honest appraisal of this entire process.
Anyhow, my reviews are based on a 'buy and hold' approach which isn't my own trading philosophy or the philosophy of this blog. I assume this buy and hold at this time for the ease of the review. In practice I employ and advocate a disciplined strategy of portfolio management that I have described multiple places on this blog. I try to sell my declining stocks quickly and completely and sell my gaining stocks slowly and partially. This difference in strategy would certainly affect the overall performance of any investment. Please take this into consideration when reading these write-ups.
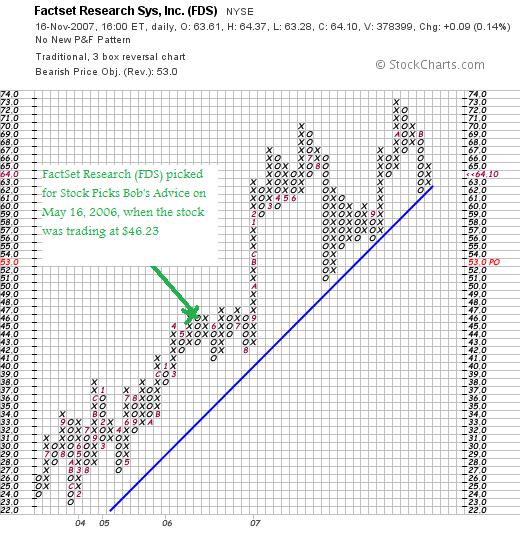
 On May 16, 2006 I posted FactSet Research (FDS) on Stock Picks Bob's Advice when the stock was trading at $46.23. FDS closed at $64.10 on November 16, 2007, for a gain of $17.87 or 38.7%.
On September 25, 2007, FDS reported 4th quarter 2007 results. Revenues climbed 23.1% to $129.5 million from $105.2 million the prior year same period. Net income rose 31% to $30.7 million from $23.4 million the prior year. On a diluted earnings per share basis this worked out to $.60/share this year compared to $.46/share last year a 30.4% increase.
The company beat expectations which according to Thomson Financial were $.56/share on revenue of $128.7 million.
Taking a look at the 'point & figure' chart on FDS from StockCharts.com, we can see that the stock has appreciated nicely since it was picked on this blog and the upward move of this stock appears intact.
Reviewing the Morningstar.com "5-Yr Restated" financials page, we can see that the steady revenue growth, earnings growth, dividend growth, and stable outstanding shares is intact. Free cash flow is growing nicely and the balance sheet appears solid.
With all of these findings,
FACTSET RESEARCH (FDS) IS RATED A BUY
 On May 20, 2006 I posted Eagle Materials (EXP) on Stock Picks Bob's Advice when the stock was trading at $52.21. EXP closed at $36.99 on November 16, 2007, for an effective loss of $(15.22) or (29.2)% since posting.
 On October 22, 2007, Eagle Materials (EXP) reported 2nd quarter 2008 results. Revenue for the quarter ended September 30, 2007, came in at $210.5 millon, down 18% from the same quarter last year. Net earnings came in at $34.8 million, down 47% for the same period. On a per share basis, this worked out to $.73/share this year, down 44% from the $1.32/share reported last year.
The company beat expectations for earnings but missed expectations on revenue with Reuters Estimates being for $.72/share in earnings on $213.11 million in revenue.
If we review the 'point and figure' chart on Eagle Materials from StockCharts.com, we can see that the stock has continued to decline from the date of our stock pick and does not show any good evidence of technical strength, instead moving lower under the 'support line'.
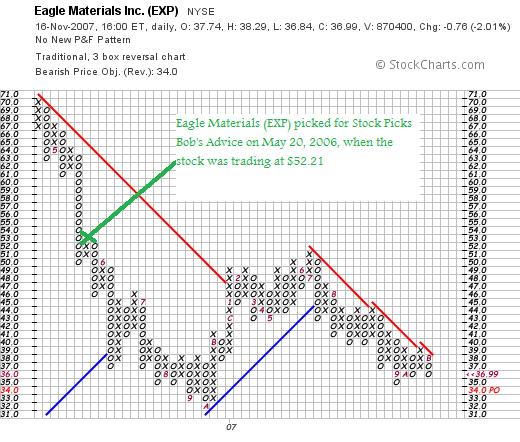
Reviewing the Morningstar.com "5-Yr Restated" financials on EXP, we can see that with the recent results, the trailing twelve months shows decreased in revenue, earnings, and free cash flow. The company has maintained and raised its dividend expressing optimism over its own prospects, and the balance sheet while adequate shows a current ratio of just a bit over 1.2 with significant long-term liabilities present.
With the weak earnings report and the associated weak price chart,
EAGLE MATERIALS (EXP) IS RATED A SELL
So how did I do with these two stock picks from that week about a year and a half ago? Well, I had one gainer and one loser. The average of these two stocks works out to a gain of 4.75%.
Thanks again for dropping by and visiting! If you have any comments or questions, please feel free to leave them on the blog or email me at bobsadviceforstocks@lycos.com. If you get a chance, be sure and visit my Stock Picks Podcast website, where many of my stock picks are discussed. In addition, stop by my Covestor web page where my actual trading portfolio is reviewed, and my SocialPicks page where all of my stock picks from the past year have been reviewed.
Have a great Sunday everyone! And wishing you a wonderful Thanksgiving week!
Bob
Garmin (GRMN) "Revisiting a Stock Pick"
CLICK HERE FOR MY PODCAST ON GARMIN (GRMN)
Hello Friends! Thanks so much for stopping by and visiting my blog, Stock Picks Bob's Advice! As always, please remember that I am an amateur investor, so please remember to consult with your professional investment advisers prior to making any investment decisions based on information on this website.

It is Saturday, and I wanted to see if I could get this one posted before the weekend is over!
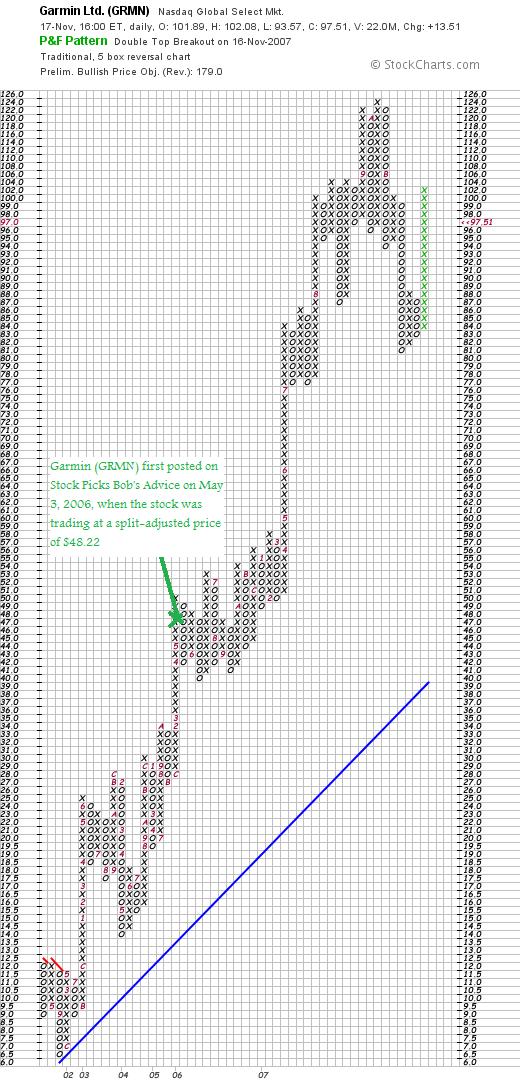
The market rebounded yesterday and I saw an old favorite of mine, Garmin (GRMN) make the list of top % gainers on the NASDAQ. I say 'old favorite' because I first posted about Garmin (GRMN) on May 3, 2006, when the stock was trading at $48.22, adjusted for a 2:1 stock split on August 16, 2006. Garmin closed at $97.51, up $13.51 on November 16, 2007, for a gain of 16.08% on the day! I do not own any shares nor do I have any options on this stock. (At Friday's closing price, this represents an appreciation of $49.29 or 102.2% since my stock pick!)
Let me try to briefly review this stock and point out why I believe this stock deserves a spot on my blog and why
GARMIN (GRMN) IS RATED A BUY
What exactly does this company do?
 According to the Yahoo "Profile" on Garmin, the company
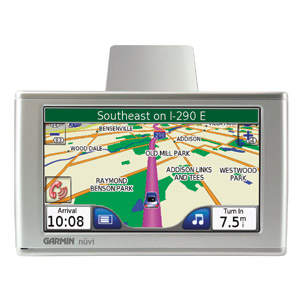
"...and its subsidiaries engages in the design, manufacture, and marketing of navigation, communications, and information devices that are enabled by global positioning system (GPS) technology worldwide. It operates in four segments: Automotive/Mobile, Outdoor/Fitness, Marine, and Aviation."
Is there any news to explain the large move?
I haven't been following this stock closely, but two factors have been suppressing the stock price. The company had been involved in an attempt to acquire TeleAtlas and also the company had been under pressure as much of its mapping information has been coming from Navteq (NVT), which since it is being acquired by Nokia (NOK), there had been concerns about the company's access to this critical information. However, as reported:
"Navigation device maker Garmin is walking away from a costly bidding war with rival TomTom over Tele Atlas, a supplier of mapping data. Instead, Garmin (GRMN) worked out an agreement to get that valuable data from another source.
Garmin, based in the Kansas City suburb of Olathe, Kan., will extend through 2015 an existing contract to buy mapping from Navteq (NVT), the Chicago-based company that is being acquired by Finnish mobile-phone giant Nokia (NOK). Garmin also secured an option to renew the agreement for an additional four years. The companies also said they would explore "expanded points of cooperation" to improve mapping data quality. Financial terms of the deal were not disclosed.
The move brings an end to a dramatic takeover tussle that has shaken the navigation business to its core and fueled surges in the stock prices of takeover targets Navteq and Netherlands-based Tele Atlas. Though it has lost the bidding battle over Tele Atlas, Garmin sure looked like a winner to investors. It already buys about 98% of its mapping data from Navteq, so the extension of the current agreement lets it proceed without missing an operational beat. Garmin's plan for acquiring Tele Atlas included a transition period that would have lasted as long as two years."
How did they do in the latest quarter?
On October 31, 2007, Garmin reported 3rd quarter 2007 results. Total revenue came in at $729 million, up 79% from $408 million in the third quarter of 2006. Net income (GAAP) came in at $193.5 million, up sharply from $123.0 million in the same quarter last year. Diluted earnings per share climbed 57% to $.88/share from $.56/share last year.
The company beat estimates on earnings which had been expected to come in at $.82/share, and instead came in at $.88/share. The company also raised 2007 guidance to $3.40/share from prior forecast of $3.15/share. Also it raised revenue guidance for 2007 to more than $2.9 billion from prior guidance of 'at least $2.8 billion'.
How about longer-term results?
Reviewing the Morningstar.com "5-Yr Restated" financials on GRMN, we can see a phenomenal picture of rapid and steady revenue growth from $465 million in 2002 to $1.77 billion in 2006 and $2.25 billion in the trailing twelve months (TTM). Earnings during this period have also grown rapidly from $.70/share in 2002 to $2.40/share in 2006 and $3.00 in the TTM. The company initiated dividends at $.30/share in 2004, raised them to $.50/share in 2006 and up to $1.30/share in the TTM. Meanwhile, shares outstanding have been very stable at 216 million in 2005, 217 million in 2006 and a drop to 216 million in the TTM.
Free cash flow has been positive and growing rapidly with $131 million in 2004 increasing to $269 million in 2006 and up to $473 million in the TTM.
The balance sheet is gorgeous with $668 million in cash which alone could pay off all of the current liabilities of $428.2 million and the smallish $91.5 million in long-term liabilities combined. Calculating the current ratio, we have a total of $1,689 million in total current assets compared to current liabilities of $428.2 million, yielding a current ratio of 3.94.
What about some valuation numbers?
Reviewing Yahoo "Key Statistics" on Garmin (GRMN), we can see that this is a large cap stock with a market capitalization of $21.15 billion. The trailing p/e is a moderate 29.37 with a forward p/e (fye 30-Dec-08) estimated at 22.57. The PEG ratio is a very reasonable 1.15.
In terms of valuation, the company is richly priced, with a Price/Sales (TTM) ratio of 8.20 compared to an industry average of 1.62, according to the Fidelity.com eresearch website. However, the Fidelity website also reports that the company is extremely profitable relative to its peers with a Return on Equity (TTM) of 40.65% compared to the industry average of 12.27%.
Returning to Yahoo, we can see that there are 216.88 million shares outstanding with 102.91 million that float. As of 10/26/07, there were 5.80 million shares out short, but owing to the large daily volume, this works out to only a 1.2 day 'short ratio'.
As noted above, the company is paying a dividend, which per Yahoo works out to $.75/share yielding .9%. The last stock split was a 2:1 split, as I mentioned above, on August 16, 2006.
What about the chart?
Looking at the StockCharts.com 'point & figure' chart on Garmin, we can see that the stock has moved sharply higher this past year with an increase from $44 in December, 2006, to a recent high of $124 in October, 2007. With concerns about the Navteq purchase by Nokia, and the recent acquisition attempt by the company, the stock price dropped to as low as $81 in November, 2007. With the removal of the acquisition attempt, and the contractual arrangements to obtain the Navteq data, the stock moved sharply higher yesterday, and is close to clearing the recent 'resistance line'. I am comfortable with the chart in light of all of the news.
Summary: What do I think about this stock?
I like this stock a lot! I do not own any shares but if I had the opportunity, I would be buying shares. To review, they recently dropped an acquisition attempt which generally helps an acquiring stock which otherwise might have its stock depressed in price. In addition, concerns about one of their suppliers being acquired (Navteq) is now resolved for the immediate future. They reported a terrific earnings report which beat estimates and they raised guidance. Their long-term report is impeccable with steady revenue and earnings growth, an increasing dividend, and a stable outstanding shares count.
Free cash flow is solid and growing and the balance sheet is very solid.
Valuation-wise, the p/e isn't bad in light of the fast growth reported resulting in a PEG ratio just over 1. Price/sales works out rich but the Return on Equity is impressive.
I guess I just like this stock!
Anyhow, that's a wrap for this week! Thanks so much for visiting! If you have any comments or questions, please feel free to leave them on the blog or email me at bobsadviceforstocks@lycos.com. I cannot always answer all of the email I get, but I do read all of my mail and try to get around to commenting on all of the correspondence I receive!
If you get a chance, be sure and visit my podcast website. I shall try to post a new podcast this weekend if I get a chance :). Also, be sure and visit my Covestor page where my actual trading portfolio is analyzed and compared to other investors. In addition, my SocialPicks page reviews all of my 'stock picks' and keeps track of their performance.
Thanks again for visiting! Be sure and have a wonderful weekend.
Bob
Posted by bobsadviceforstocks at 5:32 PM CST
|
Post Comment |
Permalink
Updated: Sunday, 18 November 2007 9:58 PM CST
Tuesday, 13 November 2007
Fossil (FOSL) "Revisiting a Stock Pick"
Hello Friends! Thanks so much for stopping by and visiting my blog, Stock Picks Bob's Advice! As always, please remember that I am an amateur investor, so please remember to consult with your professional investment advisers prior to making any investment decisions based on information on this website.
What a difference a day makes! After four days of a steadily deteriorating Dow, it was nice to see the indices move higher today on what appeared to be a little better earnings than expected from Wal-Mart! Not that I own any shares of Wal-Mart at this time, although my kids each own about 5 shares from their grandparents. I also should have known that once I wrote about 'what to do in a declining market' it would be close to the end of at least that leg of the correction. Let's see what tomorrow brings!
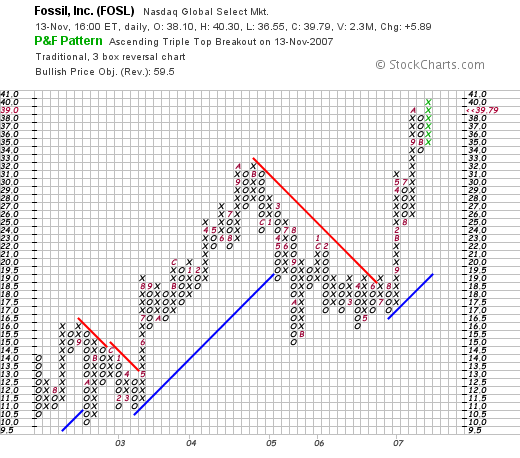
 I had a little time this evening and wanted to see if I could find something to discuss on the blog. Looking through the list of top % gainers on the NASDAQ today, I saw that Fossil (FOSL) had made the list. I do not own any shares of FOSL nor do I have any options on this stock. Fossil closed at $39.79, up $5.89 or 17.37% on the day.
FOSSIL (FOSL) IS RATED A BUY
I call this entry a 'revisit' because Fossil is what I like to call an 'old favorite' of mine on this blog. I first wrote up Fossil on November 11, 2003, about six months after I started writing on this website when the stock was trading at $28.42. The stock split only once since that write-up, splitting 3:2 on April 12, 2004, giving me an effective 'pick price' of only $18.95. With FOSL closing at $39.79, this means a stock price appreciation of $20.84 or 110% since posting.
What exactly does this company do?
 According to the Yahoo "Profile" on Fossil (FOSL), the company
"...engages in the design, development, marketing, and distribution of fashion accessories, including apparel, belts, handbags, jewelry, small leather goods, sunglasses, and watches under proprietary and licensed brand names worldwide. The company offers a line of fashion watches under its proprietary brands, such as FOSSIL, MICHELE, RELIC, and ZODIAC; and pursuant to license agreements, under some prestigious brands, such as ADIDAS, BURBERRY, DIESEL, DKNY, EMPORIO ARMANI, MARC BY MARC JACOBS, and MICHAEL Michael Kors."
How did they do in the latest quarter?
As is often the case on this blog, it was the annoncement of earnings that drove the stock higher in trading today. In fact, the company reported 3rd quarter 2007 results today. Net sales for the quarter came in at $358.6 million, up 19.6% from $299.7 million in the same quarter last year. Net income soared 41.4% to $30.5 million, compared to net income last year of $21.5 million. Diluted eps grew 38.7% to $.43/share from $.31/share last year.
The company beat expectations for both earnings and revenue. Earnings were expected according to analysts polled by Thomson Financial to come in at $.43/share on revenue of $343 million. In addition the company raised guidance for 2007 to $1.67/share--analysts are currently expecting profit of $1.58/share.
How about longer-term results?
Reviewing the Morningstar.com "5-Yr Restated" financials on Fossil, we can see the steady picture of revenue growth from $663 million in 2002 to $1.2 billion in 2006 and $1.3 billion in the TTM. Earnings/share have also steadily improved from $.80/share in 2002 to $1.10/share in 2006 and $1.40/share in the trailing twelve months (TTM). Interestingly, the outstanding shares which were 69 millon in 2002, are actually at 67 million in the latest twelve months.
Adding to this share reduction was the announcement today that the company planned to buy back up to 2 million additional shares.
Free cash flow, which did dip from $53 million to a negative $(19) million between 2004 and 2005, improved to $98 million in 2006 and a stronger $138 million in the TTM.
The balance sheet appears solid with $170 million in cash and $467 million in other current assets. This total of $637 million, when compared to the $204.6 million of current liabilities yields a current ratio of over 3. In addition, the company has a very nominal level of long-term liabilities reported by Morningstar to be at $60.8 million.
What about some valuation numbers?
Reviewing Yahoo "Key Statistics" on Fossil, we find that the company is a mid-cap stock with a market capitalization of $2.71 billion. The trailing p/e is a moderate 28.61 with a forward p/e of 19.99. The PEG is a very reasonable (imho) level of 1.12.
Looking at the Fidelity.com eresearch website, we find that the Price/Sales (TTM) for FOSL comes in at a nice 1.77, compared to the industry average of 2.64. In terms of Return on Equity (TTM), the company doesn't come in quite as nice compared to other companies in the same industry with a figure of 15.78% vs. the industry average of 23.71%.
Finishing up with Yahoo, there are 68.14 million shares outstanding with 41.55 million that float. Currently there are 4.16 million shares out short as of 10/10/07, giving a short ratio of 8.4 trading days of average volume. Using my own idiosyncratic '3 day rule' this does appear to be a significant short interest and may well have contributed to the sharp run-up today in the face of good news that exceeded expectations.
No dividends are reported, and as I noted above, the stock last split 4/12/04 with a 3:2 stock split.
Summary: What do I think?
Well, I liked this stock back in 2003, and I still like it in 2007! I just haven't had the opportunity to buy shares :(. I see so many stocks I like and there are only a few that I can buy.
They reported great earnings, beat expectations, raised guidance, and announced a share buy-back! In addition, they have been steadily growing their company over the past five years while actually decreasing the outstanding shares. The stock chart looks strong, the balance sheet is pristine, and they even have a 'Peter Lynch' appeal, with a product that is well known and visible in malls across the country.
Thanks again for stopping by and visiting my blog! If you have any comments or questions, please feel free to leave them on the blog or email me at bobsadviceforstocks@lycos.com. Be sure to try and visit my podcast site, my Covestor page and my SocialPicks page! Each serve different purposes and you might enjoy listening to me discuss some of these same stocks, reading about how my actual trading account is doing (Covestor) and review an analysis of my stock picks this past year (SocialPicks).
Regards to all of my friends and readers!
Bob
Posted by bobsadviceforstocks at 6:26 PM CST
|
Post Comment |
Permalink
Updated: Tuesday, 13 November 2007 9:46 PM CST
Monday, 12 November 2007
Some Thoughts about Difficult Markets---Revisiting Trading Philosophy
Hello Friends! Thanks so much for stopping by and visiting my blog, Stock Picks Bob's Advice! As always, please remember that I am an amateur investor, so please remember to consult with your professional investment advisers prior to making any investment decisions based on information on this website.
I have missed another 'Weekend Review'. We shall get to it next week. But while looking through my past entries during the week of May 15, 2006, I came across an entry that I wrote back at that time which seemed to be a difficult trading environment. What I wrote then still holds true. Here is that entry:
Wednesday, 17 May 2006
Maintaining Trading Discipline in a Declining Market
One of my greatest challenges as an investor is knowing how to deal with market declines and investment losses. One would like to have something automatic like this
Rube Goldberg machine.
In other words, to have a trading system that will diminish your losses in a bear market and maximize your gains in a bull market.
Too often we find our emotions working against our own best interests. When investments decline we rationalize the losses and defer the realization implicit in a sale of holdings at a price below their cost. This exposes our investments to greater losses and delays the eventual 'day of reckoning'.
In the same fashion, as stocks move higher, our greed overcomes our rational thoughts and we delay realizing some of the gains by selling a portion of the holding, and instead allow our dreams of larger and greater profits override our need to 'lock-in' some gains with a sale.
Within every successful trading system there should be a method of avoiding the problem of compounding one's losses while at the same time encouraging the compounding of gains. In other words, when investments within a portfolio develop losses, they should be sold at a predetermined price point and the proceeds from such sales should not be re-invested; instead, the proceeds should be kept in cash to be re-invested when an appropriate buy signal occurs.
In the same fashion, when stocks are sold on 'good news' events, such as price appreciation, this should also be considered a bullish indicator and the proceeds from such good news sales should be re-invested in a new stock position.
I have expressed this strategy as being hardest on declining stocks that are sold completely and quickly on developing losses, and easiest on gaining stocks which are on the other hand sold slowly and partially as they appreciate in price. This bias will also select for the strongest stocks within your portfolio.
A strategy with pre-determined sale points both on the upside and downside reduces trading stress as one simply needs to review the stock price to determine one's action. It is the requirement for arbitrary decisions that may lead to over-trading as well as under-trading of one's holdings.
No system can respond quickly enough to avoid all losses and lock in all gains. However, having a system that can move one's holdings back and forth from equities to cash and back again, should be helpful in the long-run in building one's assets by maximizing gains and minimizing losses.
Wishing my readers the very best of luck in dealing with the difficult investing environment we are all facing!
Bob
I dont know how the market is going to trade tomorrow. Certainly the Asian markets have been 'taking it on the chin' this evening. But where will the Dow close tomorrow? I simply don't know.
What I do know is that my stocks have predetermined sale points on the upside and the downside. And that I shall stay as much 'put' as possible before implementing any trades. I shall try to let my own portfolio dictate my trading and not my fears or hopes regarding stocks.
Wish me luck! Thanks again for dropping by! Good-luck trading tomorrow!
Bob
Newer | Latest | Older


