Stock Picks Bob's Advice
Saturday, 22 October 2005
"Looking Back One Year" A review of stock picks from the week of August 9, 2004, and August 16, 2004

Hello Friends! Thanks so much for stopping by and visiting my blog,
Stock Picks Bob's Advice. As always, please remember that I am an amateur investor, so please remember to consult with your professional investment advisors prior to making any investment decisions based on information on this website.
Excuse me for not getting a post last weekend but as this picture from the Loyola University Chicago website shows, Chicago is the keeper of the famous Water Tower and Michigan Avenue shopping district. I was there at a meeting, and didn't have a chance to get to a P.C. (Maybe it is time to purchase a laptop?)
One thing I like to do on weekends around here is to look back about a year, moving ahead week by week, and see how my "picks" have turned out. Sometimes I look absolutely brilliant and other times, well...you know. One thing to point out in all of this analysis is that the review assumes a buy and hold strategy and in fact I have implemented a strategy diametrically opposed to that philosophy. When my stocks drop 8% I sell them quickly after an initial purchase; otherwise, I sell them slowly as they appreciate.
By the way, I am reviewing two weeks of picks this evening because, in fact, I didn't pick any stocks at all during the August 9, 2004 week! Thus, even though I missed a week of reviews last weekend, I can easily get back on pace reviewing two weeks work of picks! Thus, the August 16, 2004, week shall be reviewed next :).
 On August 16, 2004, I picked Lowe's (LOW) for Stock Picks Bob's Advice at a price of $49.11. LOW closed at $61.22 on 10/21/05 for a gain of $12.11 or 24.7%.
 On August 15, 2005, Lowe's reported 2nd quarter 2005 results. Sales for the quarter ended July 29, 2005, increased 17.3% to $11.9 billion up from $10.2 billion in the same quarter last year. At least as important, same store sales for the quarter climbed 6.5%. Net earnings came in at $838 million, up 19.7% over the prior year same quarter. Diluted EPS grew 20.7% to $1.05/share up from $.87 last year. This was a strong quarter for LOW.
 On August 19, 2004, I posted PETCO (PETC) on Stock Picks Bob's Advice when it was trading at $32.90. Unfortunately, the stock has not done well the past year and closed on 10/21/05 at $18.51, down $(14.39) or (43.7)%.
 On August 25, 2005, PETCO (PETC) reported 2nd quarter 2005 results. Net sales for the second quarter ended July 30, 2005, came in at $482.7 million, up 10% from the prior year when the company had sales of $438.5 million. Comparable store sales increased 2.5%. Net income for the quarter came in at $18.0 million or $.31/diluted share down from $19.3 million or $.33/diluted share in the same quarter last year.
 Finally, on August 21, 2004, I posted Pixelworks (PXLW) on Stock Picks Bob's Advice when it was trading at $10.96. PXLW closed at $5.44 on 10/21/05 for a loss of $(5.52) or (50.4)%.
On July 27, 2005, PXLW reported 2nd quarter 2005 results. Revenue came in at $41.3 million down from $48.5 million in the same period las year. The company reported a net loss of $(2.3) million or $(.05)/share, down from a profit of $8.9 million or $.12/share.
So how did I do with my stock picks that week in August, 2004? In a word, AWFUL! Of the three stocks, one had a nice gain and two had awful results. The average of these three theoretical investments, utilizing a 'buy and hold' strategy was a loss of (23.4)%. This only goes to show you how I am truly an amateur; while I sometimes seem to work near-miracles in investing, I may also occasionally lose money!
Thanks so much for stopping by! If you have any comments or questions, please feel free to leave them right here on the blog or email me at bobsadviceforstocks@lycos.com.
Bob
Posted by bobsadviceforstocks at 10:06 PM CDT
|
Post Comment |
Permalink
Updated: Saturday, 22 October 2005 10:14 PM CDT
"Weekend Trading Portfolio Analysis" Cytyc (CYTC)

Hello Friends! Thanks so much for stopping by and visiting my blog,
Stock Picks Bob's Advice. As always, please remember that I am an amateur investor, so please remember to consult with your professional investment advisors prior to making any investment decisions based on information on this website.

I must first apologize for missing this post last weekend. I was away from my computer and I am sure I suffered more from separation anxiety than any of my readers :).
With the ongoing correction in the market, I have hit sale points on the downside for additional holdings in my trading account and am now down to 21 positions with my maximum number being 25. As you probably know, when I sell a stock on "bad news", which I consider anything other than selling on a gain, I do not reinvest those funds. Thus, to add a new position, I shall be awaiting for a sale on "good news" which will 'entitle' me to investigate, and purchase another name for the portfolio.

What I have started doing around here, besides just talking about stock market possibilities, is to take the time and share with you each of my holdings, the history of my purchases and sales, and my current 'take' on that stock.
Two weeks ago, I
discussed Cooper (COO) on Stock Picks Bob's Advice. Going alphabetically, I am now up to my Cytyc position (CYTC). According to the
Yahoo "Profile" on Cytyc, this company "...engages in the design, development, manufacture, and marketing of clinical products primarily focused on women's health. Its products cover a range of women's health applications, including cervical cancer screening, breast cancer risk assessment, and treatment of excessive menstrual bleeding."
In my trading account, I purchased 500 shares of Cytyc (CYTC) at a cost basis of $14.86 on 1/29/04. I made my first sale of CYTC on 3/1/04, selling 100 shares, at a price of $18.63 for a gain of $3.77 or 25.4% (a little earlier than my usual first target today of 30%). My second sale of CYTC was a 100 share sale on 4/2/04 at a price of $22.61, for a gain of $7.75/share or 52.2% (again a bit early as I currently wait for a 60% appreciation level to make my second partial sale). My third sale was 75 shares of my remaining 300 shares on 6/2/04 at a price of $22.79, representing a gain of $7.93 or 53.4%. (I actually remember realizing I had sold this stock earlier than I should have :(...shows what happens when you do things manually I guess...normally, my third sale would be at a 90% gain point!). Currently, I have 225 shares remaining of CYTC which closed 10/21/05 at $25.86, representing an unrealized gain of $11.00 or 74%. Since I have made three sales already, my next targeted sale will be at a 120% gain level or to calculate, $14.86 x 2.20 = $32.69. On the downside, even though I made mistakes on my third sale especially, I shall still act as if it were at 90% and thus, on the downside, I anticipate selling the remaining shares at $14.86 x 1.45 = $21.55. (at a 45% gain level).

Well, let's take a quick look at the stock.
On July 27, 2005, Cytyc
reported 2nd quarter 2005 results. Revenues for the quarter climbed 26% to $125.4 million, up from $99.5 million for the same quarter the prior year. Net income grew 28% to $28 million, up from $21.9 million the prior year. On a diluted eps basis, earnings grew 21% from $.23 vs. $.19/share the prior year. These were solid results!
Taking a look at the
Morningstar.com "5-Yr Restated" financials, we can see a beautiful picture of growing revenue from 2000 at $142.1 million, increasing to $452.2 million in the trailing twelve months (TTM).
Earnings have been a tad erratic, increasing from $.32/share in 2000 to $.83/share in the TTM, with small declines in 2001, and 2004.
Free cash flow remains solidly positive with $91 million in 2002 growing to $118 million in the TTM. The balance sheet shows plenty of current assets with $97 million in cash and $100.7 million in other current assets vs. $54.4 million in current liabilities. The excess in current assets is enough to cover about half of the long-term liabilities of $315.4 million.
What about a chart? Taking a look at the
"Point & Figure" chart on CYTC from Stockcharts.com:
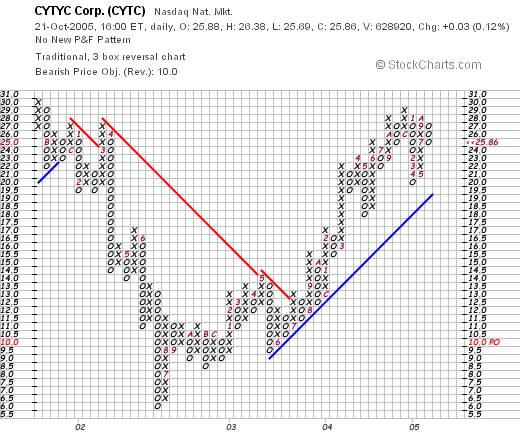
We can see that the stock actually was declining between 2001 when it was trading at $30, and then declining to a bottom of $6 in June, 2002. Since then the stock has been climbing, breaking through resistance in July, 2003, and climbing to its current level at around $25.86 today. The graph looks solid imho, and does not appear to have gotten ahead of itself.
So what do I think? Well, I do own the stock :), and I have done well with it so far. The stock is a very small company, and appears to have plenty of room to grow!
Thanks so much for stopping by! If you have any comments or questions, please feel free to leave them on the blog or email me at bobsadviceforstocks@lycos.com.
Bob
Friday, 21 October 2005
A Reader Writes: "I think I learned the meaning of gapping down."
Hello Friends! Thanks so much for stopping by and visiting my blog,
Stock Picks Bob's Advice. As always, please remember that I am an amateur investor, so please remember to consult with your professional investment advisors prior to making any investment decisions based on information on this website.

My good friend, Bob K., has written in again about his own experience with a stock that makes up much of his retirement assets due to previous employment. Bob wrote:
Hi Bob,
This might not be for your blog as I feel very stupid. I think I learned the meaning of gapping down. I awoke Tuesday morning to find my American Standard lost over $50,000 over night on a 2 cent earnings miss and a down guidance on plumbing which is only 17% of their business. I'm holding on because I don't know what else I'd invest it in anyway and I believe the dead cat will bounce. I think ASD might be a pretty good bargain now. So much for lack of diversity. I knew the company wasn't really in trouble and never imagined such severe punishment. Oh well, thanks for listening.
Bob
First of all, from one Bob to another, you are not stupid. You are the victim of your own retirement plan which loaded you up with the stock of your former employer, American Standard. This points out the need for diversification in one's assets. Personally, in my own trading account, I aim for 25 different positions so that if one implodes and gaps down, the effect isn't as devastating as might be otherwise. I have had my share of implosions, and thus, another reason to try to take profits as a stock appreciates, effectively removing ones cost from an investment.

Otherwise, you may find that your profits, your assets, and your retirement funds have literally gone down the American Standard crapper so to speak. Please excuse my potty humor. Couldn't really help myself!
Let's take a closer look at American Standard (ASD). ASD closed today at $37.74, up $.62 or 1.67% on the day. This was a bit of a rebound from your previously noted decline.
As you reported, on October 18, 2005, the company
reported 3rd quarter 2005 results. Sales climbed 9.5% to $2.62 billion, with earnings per diluted share up 4% to $.74/share. This is at best a bit anemic in terms of growth. But of more concern was the smaller headline on the same report:
- Company reduces full-year earnings estimate from $2.60-$2.75 to $2.54- $2.58, an increase over 2004 of 79-82 percent on a GAAP basis, 13-15 percent on an adjusted basis
. This was a double "hex" on the stock....first they
missed estimates, and second, the company reduced guidance. All of those imaginary computers that I picture analysts using immediately recalculated the appropriate "current value" of the stock, and the stock pulled back rather decisively.
What does the Morningstar.com report look like? Checking the
Morningstar.com "5-Yr Restated" financials, we can see a steady picture of revenue growth from $7.6 billion in 2000 to $9.8 billion in the trailing twelve months.
Earnings have been a little less consistent (a problem we are once again revisiting), with a decrease from $1.45 to $1.35 between 2000 and 2001, then back to $1.83 by 2003, and declining again to $1.42 in 2004 but increasing once again to $1.84 in the TTM. Consistency is a very important factor in assessing valuation. Investors regularly pay a premium for increased certainty of results. And thus, a discount to inconsistent reports.
Free cash flow has been solidly positive with $518 million reported in the TTM. And the balance sheet looks fine with $3.2 billion in current assets combined, compared with $2.4 billion in current liabilities and a larger $3.6 billion in long-term liabilities on the Morningstar page.
What about the chart? Looking at the
ASD "Point & Figure" chart from Stockcharts.com:
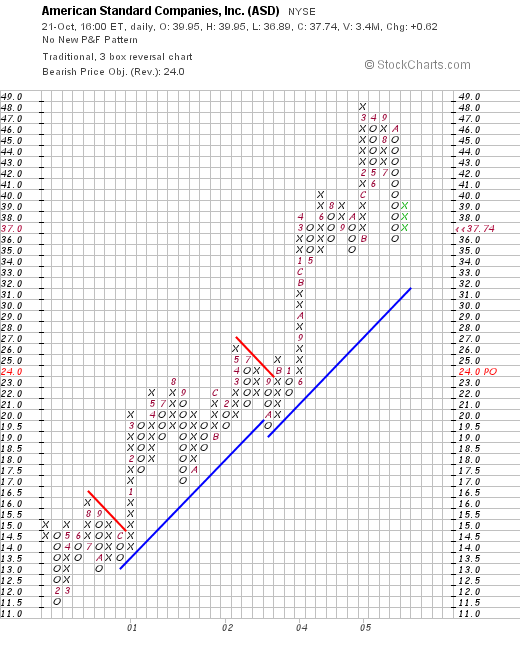
We can see what looks to me like a superb chart with steady appreciation from February, 2000 when the stock was down around $11.50 to the current level of $37.74. The stock does not appear to have broken down, but I would be more concerned if it breached the "support level" of around $33. But then I am, as you know, just an amateur technician!
So what should you do? First of all, in general it is wise to diversify your assets. I do not sell on 8% declines. I sell a stock if it declines to a level that either I have an 8% loss, or it reaches another sell-point. I suspect, since you probably have held ASD for many years, that your cost is much much lower than the current price. Thus, I wouldn't panic. However, regardless of your cost, I would work at moving some of this concentrated holdings out into other positions on your own assessment of timeliness. ASD might be the greatest stock ever in the next twelve months or twelve years, but you are far too nice a friend to concentrate all of your eggs in that one basket!

Thanks so much again for writing. I hope that you don't mind that I took the opportunity of answering you with your question by writing an entry in the blog! I guess that's the risk one takes writing to me these days :).
Regards! If you have any other questions or comments, please feel free to leave them right in the blog or email me at bobsadviceforstocks@lycos.com.
Bob
"Revisiting a Stock Pick" SanDisk (SNDK)
Hello Friends! Thanks so much for stopping by and visiting my blog,
Stock Picks Bob's Advice. As always, please remember that I am an amateur investor, so please remember to consult with your professional investment advisors prior to making any investment decisions based on information on this website.

As you know if you are a regular reader on this blog, I like to identify stocks that show potential to appreciate in price based on momentum and fundamental evaluation. After listing a stock, I try very hard to avoid "revisiting" the same name for at least a year! It is time to take another look at SanDisk (SNDK).
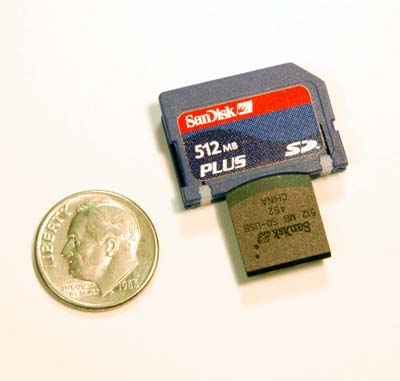
According to the
Yahoo "Profile" on SanDisk, the company "...engages in the design, development, and market of flash storage card products used in various consumer electronics worldwide. Its products include flash cards, Universal Serial Bus, flash drives, and digital audio players."
I first
posted SanDisk (SNDK) on Stock Picks Bob's Advice on July 15, 2004, when the stock was trading at $24.96. Unfortunately, I didn't buy any shares, nor do I own any shares or options at this time. Today, SanDisk made the
list of top % gainers on the NASDAQ, closing at $56.45, up $10.07 or 21.71% on the gain. Today's close is an appreciation of $31.49 or 126% since posting a little over a year ago on this blog!
What drove the stock higher today, was the announcement of
3rd quarter 2005 earnings results. For the quarter ended October 2, 2005, revenues climbed 45% to a record $590 million. Net income was up approximately 100% at $107.5 million, up from $54.1 million in the same quarter last year. Fully diluted EPS came in at $.55, up 90% over the prior year's results. These were great results, and the market reacted as expected pushing the stock price higher.
How about longer-term? Reviewing the
Morningstar.com "5-Yr Restated" financials, we can see that revenue declined from $600 million in 2000 to $400 million in 2001. Since that time, revenue growth has been robust, growing to $1.9 billion in the trailing twelve months (TTM).
Earnings also dipped that same year from $2.06 in 2000 to $(2.19)/share in 2001. However, the next year the company was profitable earning $.25/share in 2002 and has increased earnings dramatically to $1.48/share in the TTM.
Free cash flow has been positive and generally growing from $90 million reported in 2002 to $184 million in the TTM.

Looking at the balance sheet on Morningstar, we find that the company is loaded with cash, with $1.45 billion in cash and $663 million in other current assets. This dwarfs the $461.4 million in current liabilities and the $22.2 million in long-term liabilities reported. This is a very strong balance sheet!
Looking at
Yahoo "Key Statistics" on SNDK, we can see that the company is a large cap stock with a market capitalization of $10.26 billion. The trailing p/e is a bit rich at 38.12, but the forward p/e (fye 02-Jan-07) is much better at 29.10.
Reviewing
Fidelity.com eResearch website, we can see that SanDisk is the most expensive stock in the "Semiconductor-Memory Chips" industrial group. SNDK tops out the list with a price/sales of 4.6, followed by Silicon Image (SIMG) at 3.5, M-Systems Flash Disk Pioneers (FLSH) at 3, Micron Technology (MU) at 1.7, and Lexar (LEXR) at 0.7.
Looking back at Yahoo for additional statistics, we find that there are 181.75 million shares outstanding and currently 11.75 million shares out short. This represents 6.605 of the float or a short interest ratio of only 2.2. This doesn't look like a lot of shares out short (imho) using my own cut-off of 3 days of short interest.
SanDisk does not pay a cash dividend according to Yahoo and the last stock split was a 2:1 split on February 19, 2004.
What about a chart? Looking at the
Stockcharts.com "Point & Figure" chart on SNDK:
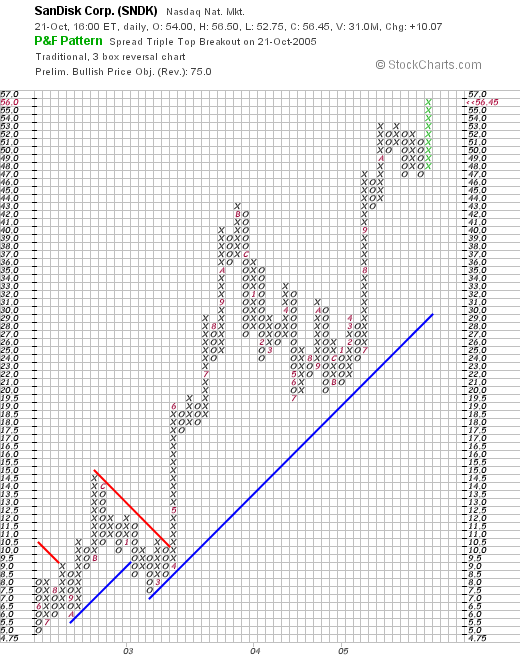
We can see that ever since the stock broke through resistance at about $9.00 in April, 2003, the stock has traded higher, even though it has been a bit erratic. In my humble opinion, the stock chart looks strong.
So what do I think? Well, on the positives, the latest quarter was absolutely superb. The last five years have shown strong growth in revenue and earnings, the free cash flow is positive and the balance sheet is exceptionally strong. In addition the chart looks great!
What do I not like? Well, all things considered, I like a bargain rather than a fully priced stock. This stock sports a p/e in the high 30's, a PEG at 1.52 (with 1.0 being 'fairly' valued) and a Price/Sales at the top of the group. In spite of all that, the latest quarterly report is so spectacular, that I would dare say the company is still a reasonable value!
Thanks again for stopping by! Have a great weekend! If you have any questions or comments, please feel free to post them right here on the blog, or email me at bobsadviceforstocks@lycos.com and I will try to get back to you, either by email or right on the blog itself!
Bob
Thursday, 20 October 2005
Thoughts on Dealing with a Bear Market Correction
There are many theories about how to own stocks, when to buy them and when to sell them. Some people believe they can anticipate a correction and move their assets to cash ahead of time only to find out that they missed the rally that followed. Others believe in 'hanging in there', by riding their investments right up and right back down, believing they will be profitable over the long haul. Others, finding they have gotten their fingers 'burnt', swear off equities and turn to certificates of deposit or bonds. Let me share with you once again my approach. I do not claim this approach will be successful; this is something that I shall share with you as events unfold. However, managing your portfolio means protecting your gains, and avoiding excessive losses, if you are to be profitable over the long run.

Grandad Bluff, Wisconsin
My basic strategy is extremely simple. You are more than welcome to adapt, modify, or copy this strategy as you feel fit. Please remember that I am an amateur investor, so you would be well-advised to consult with your professional investment advisors prior to acting on any ideas I share with you on this website!
Basically, I believe that you should sell your losing stocks quickly, and your gaining stocks slowly. In addition, you should use the internal action of your holdings to dictate your overall shift from equities into cash and back again.
If you have been reading this blog for awhile, you will realize that I do this technique in my own holdings. One of my greatest failures has been to utilize margin debt in this process. It is a bad idea, although it has worked adequately for me, because debt leverages your account on the upside as well as the downside. In addition, like the "house" at a casino, the margin interest continues to rake off portions of my profits with interest expenses.
My current "rules" for investing within my actual trading portfolio are as follows:
1) Sell any new stock investment if and when it hits or passes an 8% loss. Sell the whole thing as soon as possible, even if you have held the stock for as short a period as a day or less!
2) Sell gaining stocks slowly at pre-determined %-appreciation points. Currently I use a 30%, 60%, 90%, 120%, then 180%, 240%, 300%, 360%, and then by 90% at 450%, 540%, 630%....etc. At those points I sell 1/4 of my remaining positions...rounded down to the nearest share.
3) If I sell a stock once at a gain (usually at the 30% gain point), if the stock subsequently declines, move up the selling point from an 8% loss to break-even.
4) If I have sold a stock more than once, allow it to only to retreat to 50% of the highest gain level. That is if I sold a portion at 60%, then sell all remaining shares at 30% gain point; if I sold a portion at 180% gain, allow it to retreat to a 90% gain before selling all remaining shares. Thus, allowing the best performing stocks the greatest leeway in your portfolio....allowing them to "bounce back" when the market climb resumes.
5) I do sell stocks if I truly believe something fundamentally "bad" has happened to the company. Not something like a downgrade from a brokerage house, but something more threatening like an SEC investigation, or a massive recall or slowdown in sales. I reserve the right to bail on any of my stocks, but rarely utilize this option.
6) As I have pointed out elsewhere, I like to use my own holdings as a signal to either buy or move into cash on selling. That is, when starting a portfolio, consider an eventual target # of stocks to own. I currently use 25 stocks as a maximum. You might wish to use 20 or 24. If you use 24, start a portfolio in "neutral". For me, that would be 12 positions representing 50% of the cash, and the rest kept literally in a cash money market fund. Allow yourself to drop down to 1/2 of the # of original stocks...in this case 6 issues. This is your baseline, keeping you always at least 25% invested. If those are sold on bad news, you should (imho) replace them with other solid stocks found in the same manner that I do with all of my picks. Otherwise, to increase the # of positions, requires a "signal" from your own holdings; a sale of a portion of your own stock holding at a gain point. That is if you own company "xyz", and the stock hits a first sale point at a 30% gain, this would "entitle" you to add a new position...having sold some shares on "good news". Good news, for me, is selling a portion of a stock at a gain point, indicating the health of the portfolio, and by extrapolation, the health of the market. If you sell something on "bad news", as I refer to it, either at an 8% loss after a first purchase, or at a 50% retracement of a gain, or simply on fundamentally bad news, then I would suggest "sitting on your hands", leaving that money in cash (or worse as I have done, paying down margin that I shouldn't really have), and not adding a new position. Don't compound your losses in a declining market by replacing a stock that you have sold immediately with another stock without having an appropriate buy 'signal'.
Will this work? I don't know. That is what I am trying to do with my own portfolio. I am afraid that my margin does not allow me to react fast enough. However, for the first time in my investment experience, I don't face each day with the puzzle of determining what I should do. My own stocks let me know by either reaching sale points on the downside or by signalling me to be more bullish by reaching sale points on the upside. It makes sense to me!
I hope this discussion is helpful to you! I spend lots of time talking about appropriate "picks". These stocks should only be considered (first of all after your have discussed them with a professional) but besides that, I really would want you to be "sitting on your hands" and not buying anything unless you have the appropriate buy signals from the market or from your own portfolio!
If you have any questions or comments, please feel free to email me at bobsadviceforstocks@lycos.com or just plain leave a comment right on the blog!
Bob
"Trading Transparency" GI and MNT
Hello Friends! Thanks so much for stopping by and visiting my blog,
Stock Picks Bob's Advice. As always, please remember that I am an amateur investor, so please remember to consult with your professional investment advisors prior to making any investment decisions based on information on this website.
As you know, I have a selling 'discipline' as well as a purchasing strategy to deal with my stock holdings. A few moments ago, I sold both my position in Giant Industries (GI): selling 160 shares (my entire holding) at $48.7701. These shares had passed my 8% loss limit, as they were purchased just last month on 9/1/05 at $53.22.
I also have a strategy to sell stocks after a couple of sales at gains, if they reach the 50% of the highest gain target. My Mentor (MNT) stock was initially acquired on 2/3/05 with a cost basis of $34.37. I have sold this stock
twice already with the last sale at a 60% gain level on 9/7/05. Having now retraced to just under a 30% gain level, I sold my remaining 113 shares a few moments ago at $44.60.
Since I am selling these stocks on "bad news", this is a signal for me to 'sit on my hands' and avoid reinvesting these funds. This is fortunate, as this continues to whittle away at my significant but shrinking margin balance.
Thanks so much for stopping by! If you have any questions or comments, please feel free to leave them on the blog or email me at bobsadviceforstocks@lycos.com.
Bob
Wednesday, 19 October 2005
October 19, 2005 The Cheesecake Factory (CAKE)
Hello Friends! Thanks so much for stopping by and visiting my blog,
Stock Picks Bob's Advice. As always, please remember that I am an amateur investor, so please remember to consult with your professional investment advisors prior to making any investment decisions based on information on this website.

I have a delicious stock pick for you :). The Cheesecake Factory (CAKE). Looking through the list of
top % gainers on the NASDAQ today, I came across The Cheesecake Factory (CAKE), which closed at $34.88, up $3.89 on the day or 12.55%. I do not own any shares or options on this stock although I must confess I have eaten there once or twics :).
According to the
Yahoo "Profile" on CAKE, the company "...operates upscale, full-service, and casual dining restaurants in the United States. The company operates its restaurants under The Cheesecake Factory and Grand Lux Cafe trademarks."
What drove the stock higher today, was an earnings report released yesterday after the close of the market. The
3rd quarter 2005 results released on October 18, 2005, reported on results for the quarter ended September 27, 2005.
During the quarter revenues increased 18% to $292.8 million. Net income jumped 43% to $21.9 million and diluted net income per share climbed 42% to $.27/share. However, same store sales, which in my humble opinion are quite significant for future company growth, came in at an anemic increase of 0.9% at The Cheesecake Factory and a more healthy 3.8% at the Grand Lux Cafe. Behind the nice move today were
upgrades by both Piper Jaffrey and Bear Stearns who raised their assessment of the stock to "Outperform".

Looking longer-term at the
"5-Yr Restated" financials from Morningstar.com, we can note the steady revenue growth from $.4 billion in 2000 to $1.1 billion in the trailing twelve months (TTM).
During this same time period, earnings have also been consistently rising from $.44/share in 2000 to the $.94/share in the TTM.
Free cash flow, while a bit erratic, has once again turned positive after a negative dip to $(12) million in 2004, but $14 million in the TTM.
The balance sheet is satisfactory with cash of $78.1 million and other current assets of $68.6 million; enough to cover the $114.5 million in current liabilities and start to pay down the $110.5 million in long-term liabilities.

Taking a look at
Yahoo "Key Statistics" on CAKE, we find that this is a mid cap stock on the larger side of things with a market capitalization of $2.73 billion. The trailing p/e is a bit rich at 37.30, the forward p/e is better at 26.63, and the PEG isn't too bad at 1.31.
Using the
Fidelity.com eresearch website, we can see that CAKE is in the "Restaurants" industrial group. Within this group, at least by the Price/Sales ratio evaluation, this stock looks pricey.
Leading the group in terms of Price/Sales ratio, The Cheesecake Factory (CAKE) sits at the top with a Price/Sales ratio of 2.3. Trailing this, Yum! Brands (YUM) is at 1.6, Applebee's (APPB) at 1.5, Wendy's(WEN) 1.4, Brinker International (EAT) at 0.9, and Darden (DRI) also at 0.9.
Looking once again at Yahoo, we can find that there are 78.37 million shares outstanding. Currently 5.24 million of the float is out short, representing 7.10% of the float or 7.7 trading days. Anything over 3.0 days needs to be taken seriously. The last stock split was 12/9/04, when CAKE underwent a 3:2 split.
What about the chart? Taking a look at the
Stockcharts.com "Point & Figure" chart on CAKE, we can see that the stock was moving fairly horizontally between late 2000 and into late 2001. After bottoming at $13.50, the stock broke through resistance in late 2001, when the price surpassed $17, only to keep climbing to the current $35 level.
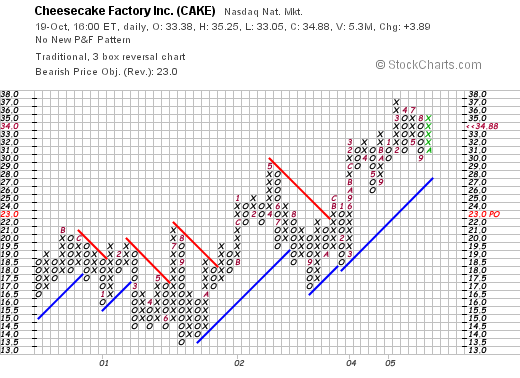
Overall, the price chart doesn't look that bad nor does the price appear over-extended.
So what do I think? Well first of all I like their food. That is about as far as a Peter Lynch as I can stretch myself :). The latest quarter was fairly solid although I have some concerns about the paltry less than 1% same store sales gain for the flagship The Cheesecake Factory" stores. In addition, the P/E is over 30, the PEG is over 1.25, and the Price/Sales places this stock at the top of its peer group of restaurant companies. This does not mean that the stock will not move higher from here. It is what they call "priced for perfection" and any disappointment may well drive marginal investors from this stock.
Thanks again for stopping by! If you have any questions or comments, please feel free to leave them on the blog or email me at bobsadviceforstocks@lycos.com.
Bob
Tuesday, 18 October 2005
"Revisiting a Stock Pick" Pharmaceutical Product Development (PPDI)
Hello Friends! Thanks so much for stopping by and visiting my blog,
Stock Picks Bob's Advice. As always, please remember that I am an amateur investor, so please remember to consult with your professional investment advisors prior to making any investment decisions based on information on this website.

I was looking through the
list of top % gainers on the NASDAQ today and came across Pharmaceutical Product Development (PPDI) which as I write, is trading at $62.26, up $6.01 or 10.68% on the day, in an otherwise down market. I do not own any shares or options on this stock but
have owned shares in the past.

PPDI is an old favorite of mine on this blog. I first
posted PPDI on Stock Picks Bob's Advice on October 16, 2003, almost exactly two years ago (!) when the stock was trading at $29.16. Thus, I have a gain on the stock pick of $33.10 or 114% (!) since that selection. Now, if I had only hung on to my shares :(.
According to the
Yahoo "Profile" on PPDI, the company "...and its subsidiaries provide drug discovery and development services, and products primarily in the United States and Europe."
What drove the stock higher today, in a negative trading environment, was the release yesterday, after the close, of the
3rd quarter 2005 earnings results. For the quarter ended September 30, 2005, net revenue came in at $273.3 million, a 26.6% increase over the prior year's revenue figure of $215.8 million. Net income increased sharply to $38.4 million, from $25.0 million the prior year, an increase of over 50%, and diluted net income pere share came in at $.66, 50% increase over the $.44 reported last year during the same period. These great results were enough to propel the stock higher in trading today!

Looking longer-term at the
Morningstar.com "5-Yr Restated" financials, we can see a beautiful picture of steady revenue growth with $372.7 million in revenue reported in 2000 and $934.6 million reported in the trailing twelve months (TTM).
Earnings have been a bit erratic per Morningstar, increasing from $.64/share in 2000 to $.94/share, then declining to $.72/share in 2002. However, since that time, earnings have grown steadily with $1.92/share reported in the TTM.
Free cash flow has also been a tad inconsistent with a drop from $71 million in 2002 to a negative $(18) million in 2003. However, the company has reported $94 million in free cash flow in the TTM.
The balance sheet, likewise is solid with $288.1 million in cash and $314.9 million in other current assets reported against $315.8 million in current liabilities and only $33.4 million in long-term liabilities.

Looking at
Yahoo "Key Statistics" on PPDI for some valuation numbers, we find that this is a large cap stock with a market capitalization of $3.59 billion. The trailing p/e is a bit rich at 32.55, with a better forward p/e of 24.46. The PEG isn't too bad at 1.26 (5 yr expected).
Looking at the price/sales ratio as an effort to determine relative valuation to other similar companies, I have started routinely using the
Fidelity.com eresearch website. Here we can see that PPDI is rather reasonably priced relative to other companies in the "Medical Labs and Research" industrial group. Topping off this list in terms of richness in valuation relative to the price/sales ratio is OSI Pharmaceuticals (OSIP) with a price/sales ratio of 16.7. This is followed by Array Biopharma (ARRY) at 5.4, Pharmaceutical Product Development (PPDI) at 3.5, Laboratory Corp. (LH) at 2.2, and Quest (DGX) at 1.9.
Referring back to Yahoo, we see that there are 57.61 million shares outstanding with only 755,390 shares out short as of 9/12/05. This is only 1.50% of the float or a short ratio of 3. This doesn't look like much of an issue on this stock.
The company does pay a small dividend of $.05/share yielding 0.10%. The last stock split was a 2:1 split on 5/14/01.
How does the chart look? If we review a
"Point & Figure" chart on PPDI from Stockcharts.com:
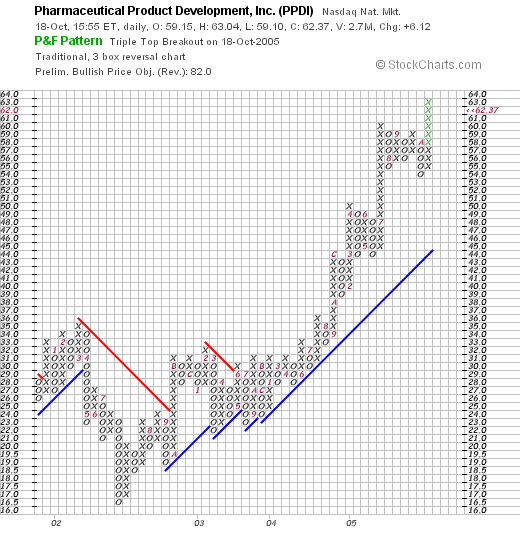
We can see that the stock was trading sideways between late 2001 and mid 2002. This would correlate with the earnings/revenue "hiccup" noted above. Since mid-October, 2002, the stock broke through resistance at the $24 level and has been trading higher since. The chart looks strong to me.
So what do I think? Well, let's review. First of all, the report yesterday was absolutely outstanding. Great revenue growth with great earnings reported. Looking at Morningstar.com, we saw the superby revenue/earnings picture, the solid free cash flow performance, and the nice balance sheet. The company even pays a dividend.
Valuation-wise, the p/e isn't really cheap, but with a PEG of about 1.25, it isn't that bad either especially with the recent strong earnings report. Price/sales-wise, the company is priced midway among its peers. In addition, the chart looks great. There really isn't that much not to like!
Anyhow, that's my take! I hope you enjoyed that review and it helped you take a look at the stock and others like it as well. If you have any questions or comments, please feel free to leave them right here on the blog or email me at bobsadviceforstocks@lycos.com.
Bob
October 18, 2005 Graco (GGG)
Hello Friends! Thanks so much for stopping by and visiting my blog,
Stock Picks Bob's Advice. As always, please remember that I am an amateur investor so please remember to consult with your professional investment advisors prior to making any investment decisions based on information on this website.

First of all, I would like to apologize to any of my readers that were looking for my posts the last few days. I was away from my computer, and I am sure I missed posting at least as much as some of you may have missed reading what I had to write :). Anyhow, I am back at work so let's see what we have here today.

Looking through the
list of top % gainers on the NYSE today, I came across Graco, Inc. (GGG), near the top, trading at $35.89, up $2.61 or 7.84% on the day as I write. I do not own any shares nor do I have any options on this stock.
According to the
Yahoo "Profile" on GGG, the company "...supplies various systems and equipment for the management of fluids in industrial, commerical, and vehicle lubrication applications."
On July 25, 2004, the company reported
2nd quarter 2005 results. Net sales for the quarter ended July 1, 2005, grew 24% from year-earlier figures to $198.2 million. Net earnings of $35.6 million were up 19% from the prior year. Diluted net earnings per share came in at $.51, a 19% increase over the $.43 reported the previous year.
Looking a bit longer-term at the
Morningstar.com "5-Yr Restated" financials, we can see that except for a dip from 2000 to 2001, revenues have grown steadily from $494.4 million in 2000 to $679.1 million in revenue in the trailing twelve months (TTM).
Earnings have also grown nicely, again except for a dip between 2000 when the company earned $1.01/share, dropping to $.92/share in 2001, earnings subsequently increased steadily to $1.70/share in the TTM.
Free cash flow has been solidly positive, increasing from $83 million in 2002 to $100 million in the TTM.
The balance sheet as presented on Morningstar also looks strong with $7.1 million in cash and $209.1 million in other current assets, more than enough to cover both the $139.1 million in current liabilities and the $43.6 million in long-term liabilities and still have about $30 million left-over.
In general, I like to use the
Ameritrade definition of Market Capitalization when discussing stocks:
Small-cap -- less than $500 million Mid-cap -- between $500 million and $3 billion Large-cap -- over $3 billion
Thus, looking at the
Yahoo "Key Statistics" on GGG, we can see that GGG is still considered a "mid-cap" with a market capitalization of $2.45 billion.

Other parameters on the Yahoo page reveal that Graco has a trailing p/e of 21.03, and a forward p/e of 16.83 (fye 31-Dec-06). Even with these moderate p/e's, growth is still expected to be relatively modest as the PEG (5 yr expected) still comes in at a bit of a rich level of 1.49.
What about the Price/Sales ratio? As Paul Sturm from Smart Money has
written, the Price/Sales ratio can provide you a sense of relative valuation of a stock compared to similar companies in its general "industrial group.". In particular, using the
Fidelity.com eresearch site, we can see that Graco (GGG) sits at the top of its group "Diversified Machinery" in terms of valuation with a Price/Sales ratio of 3.4. Graco is followed by Roper (ROP) at 2.6, Illinois Tool Works (ITW) at 1.9, and Ingersoll Rand (IR) and Pentair (PNR) at 1.3, and Eaton (ETN) at the bottom of the pack with a Price/Sales of 0.9. Thus, GGG is certainly not a screaming bargain by this parameter.
Looking back at Yahoo for some additional statistics, we find that the company has 68.70 million shares outstanding. As of 9/12/05 there were 1.51 million shares out short representing 2.20% of the float or 9.1 trading days of volume. This is a fairly significant chunk of shares out short (imho), as I use a 3 day short ratio as a cut-off. Thus, we could have some short-sellers feeling a "squeeze" and pushing the stock higher today.
The company does pay a small dividend of $.52/share yielding 1.56%. Yahoo reports that the company last split its shares on 5/31/04 with a 3:2 split.
And what does the chart look like? Taking a look at the
Graco "Point & Figure" chart from Stockcharts.com:
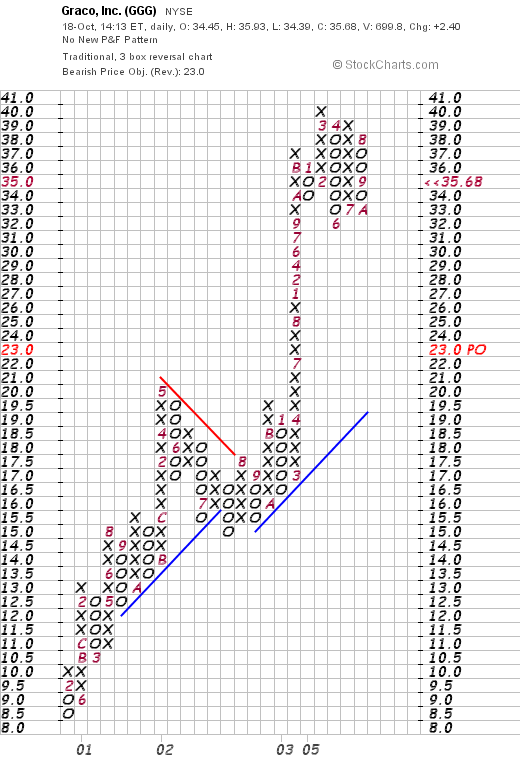
We can see that this stock has been a very strong performer for as long as this chart records, which is at least since February, 2001. With little interruption, the stock has been steadily moving higher.
So what do I think? Well, the latest quarter looks strong, the past five years the company has done well fundamentally with strong revenue and earnings growth, the company has solid free cash flow and a strong balance sheet. Technically, imho, the chart looks strong as well.
On the downside, valuation is a bit rich with a PEG at about 1.5, and the Price/Sales at the top of its group. However, the positives may well outweigh the negatives imho.
Thanks again for stopping by! I am glad to be back from my short hiatus from blogging! I hope you all had a great weekend and we have a reasonably good trading week ahead of us! If you have any questions or comments, please feel free to leave them right on the blog or email me at bobsadviceforstocks@lycos.com.
Bob
Thursday, 13 October 2005
A Reader Writes "What do You Think? (MDT)"
Hello Friends! Thanks so much for stopping by and visiting my blog,
Stock Picks Bob's Advice. As always, please remember that I am an amateur investor, so please remember to consult with your professional investment advisors prior to making any investment decisions based on information on this website.
My mailbox has been 'humming' lately. I love getting mail! Always have, ever since I was a kid. Something exciting about snail mail and even email.
Bob K. wrote in, with questions about Medtronics (MDT). My wife does have a few shares (under 100) in an IRA, otherwise, I don't own any of these shares or have any options on them. I have
posted Medtronics (MDT) on Stock Picks back on November 13, 2003, (even though I wrote November 13, 2002(!)) when it was trading at $46.39. As I write, MDT is trading at $55.00, up $.21 or 0.38% on the day (the market has moved back into the green for now.).
Back to the letter:
Hi Bob,
I was looking at the top gainers for the NYSE today and Medtronics caught my eye. Everything looks good except the earnings decline and heavy insider trading. The earnings decline is with an increase in sales. Looks as though they bought some market share, but their margin can afford it. What do you think?
Thanks,
Bob
PS You asked if your trading transparency is useful. As a novice in this area I appreciate this information immensely. So often personal financial information of this type is a deep dark secret. There are not many ways a beginner can see how a real-world investor manages his portfolio. This is a valuable educational experience for me. Thanks for the insight!
First of all thank you for writing. You make some excellent points about earnings. I do not think that my approach is the only way to invest. It might not even be the best way. It is just something that I have found helpful. But let's take a look at that latest quarterly report on MDT.
Looking through the headlines, I found something very bullish for the stock price of Medtronic (MDT). On October 11, 2005, the company announced that they were
raising guidance for 2006-2008. Whenever a company
raises guidance, it is as if they are raising the "thermostat" on valuation. If you are a 'wonk' (excuse me if I am being offensive), I imagine there are people out there feeding numbers into computer terminals all the time trying to figure out the 'appropriate' price of a stock. And if earnings and revenue expectations are raised, well that means the stock price is relatively undervalued and deserves to be pegged at a higher price.
On August 17, 2005, MDT
announced 1st quarter 2006 results. Revenue grew 15% to $2.7 billion over the prior year. However, as Medtronic reported:
In the quarter, Medtronic recorded pre-tax, IPR&D charges totaling $363.8 million related to the acquisition of Transneuronix, Inc.; a patent cross-licensing agreement with NeuroPace, Inc.; and the purchase of intellectual property from Gary K. Michelson, M.D. and Karlin Technologies, Inc.
It was this expense that knocked the company from a profit to a loss. What to do with this? If you avoid one-time expenses like this, the results look good. I probably will miss stocks by avoiding quarterly reports like this.
But if everything goes well with Medtronic with this acquisition, etc., then I suspect the stock will come in with better reports in the next and ensuing quarters, and I will have other opportunities to purchase shares. (Since I am not looking for a purchase, I wouldn't bother with it anyway). If I
were in the market to make a purchase, I would skip over a stock that has too many footnotes explaining a loss. Even a great company like this!
Anyhow, that's my amateur take on the report! I hope you find this helpful. I sure do appreciate your participation in the blog.
If you have any other questions or comments, please feel free to leave them right on the blog or email me at bobsadviceforstocks@lycos.com.
Bob
Newer | Latest | Older


