Stock Picks Bob's Advice
Saturday, 24 February 2007
Agree Realty (ADC) "Long-Term Review #5"

Hello Friends! Thanks so much for stopping by and visiting my blog, Stock Picks Bob's Advice! As always, please remember that I am an amateur investor, so please remember to consult with your professional investment advisers prior to making any investment decisions based on information on this website.
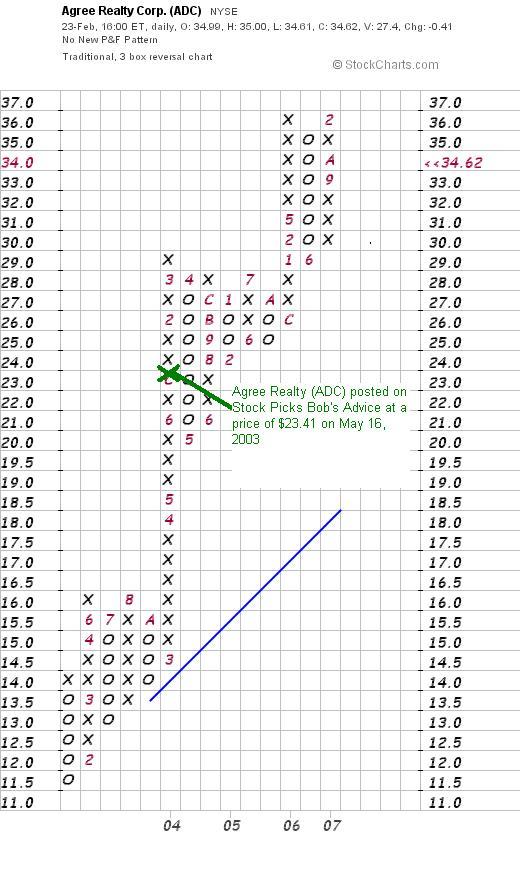
As of today, I now have 1,400 entries in this blog! To say that it is becoming unwieldy would be to underestimate the problem! Recently, to try to add to the value of this website, and to find out how some of the really longer-duration stock picks have turned out, I have been trying to go literally into the earliest posts on stocks, reviewing them in order. About three weeks ago, I reviewed AMN Healthcare (AHS), which was first posted on May 15, 2003. Let's take a look at Agree Realty (ADC) which I posted on Stock Picks Bob's Advice on May 16, 2003. On that date I wrote:
"May 16, 2003 Agree Realty Corporation (ADC)
It is 1:13 Central Time here in Wisconsin and the market is fighting back to even. Unfortunately hit my 8% stop in my own portfolio and went ahead and sold my BBA shares (Bombay). Since I am in margin, went ahead and applied the proceeds to my margin account....will wait for a 40 or 50% gainer to sell a little and add a position.
Interestingly, looking through the biggest percentage gainers, we have come across a REIT. These are the Real Estate Investment Trust type companies that own properties such as apartment buildings and retail/office space. This company reported the first quarter results on April 22nd, with a 15.5% increase in net income and a 13.8% increase in revenues and declared a $.48 dividend as well. The company yields a nice 8.57% (!!) dividend as well. I do not own any shares and do not plan at this time on acquiring any. (you know how the portfolio rules go....around here).
Agree is trading as I write at $23.41/share up $1.00 on the day (a 4.46% rise). Stock by the way has a p/e of 11.04 and a market cap (tiny) of $104.9 million. There are ONLY 4.48 Million shares outstanding and of these only 3.90 Million 'float'..
Looking at Morningstar, we see a nice trend with 19.7 Million in revenue in 1998, 21.9 million in 1999, 23.7 million in 2000, 24.7 million in 2001, and 25.8 million in 2002. Not meteoric, but consistent. Looking at the last quarter revenue of just over 7 million, we can anticipate, if things hold true...a 28 million revenue in 2003. Not too shabby.
I don't like the small float on this one and thus the lack of attention the street pays....but with an 8.5% dividend, when money funds are generating about 0.9%....what the heck! This stock is worth a shot...but hang onto the 8% stop loss if you choose to invest. Good luck! And have a great weekend!
Bob"
Let's take a closer look at this stock pick, again assuming a "buy and hold" approach to this stock and find out how the fundamental information may have changed since that entry almost four years (!) ago.
 First of all, Agree Realty (ADC) closed at $34.62 on February 23, 2007, for an appreciation of $11.21 or 47.9% since posting. I do not, and in fact have never, had any shares of this company, nor do I own any options.
How did they do in the latest quarter?
On October 31, 2006, Agree reported 3rd quarter 2006 results. For the quarter ended September 30, 2006, funds from operations (as the report relates) came in at $4.90 million, vs. funds from operations in the same quarter in 2005 of $4.95 million. Diluted funds per share were $.59 vs. $.59 in the same period last year. Net income was $3.4 million or $.44/diluted share, compared with $3.5 million or $.45/diluted share the prior year. Total revenues did increase 5.4% to $8.1 million, compared with total revenues of $7.7 million in the 3rd quarter of 2005. Thus while revenue did increase modestly year-over-year, earnings were flat to mildly lower this year.
What does the Morningstar.com report look like?
As is the case with REIT's, the Morningstar.com data is incomplete. We do know that revenue has increased steadily from $22 million in 2001 to $32 million in 2005, an approximately 50% increase in revenue. Earnings have increased modestly from $1.83 to $2.14 between 2001 and 2005, but have shown a dip of a penny to $2.13/share in the TTM, likely explained by that $.44/share vs $.45/share the prior year noted in the above discussion on latest earnings. Dividends have been boosted slightly from $1.84/share to $1.96/share from 2001 to 2005. Also of note, is the 60% increase in outstanding shares from 5 million in 2003 to 7 million in 2005 and 8 million in the TTM. Free cash flow and balance-sheet figures aren't reported on Morningstar. (But I believe that this is due to the type of company rather than anything else.....probably why I avoid stocks with gaps like this currently).
What does the chart look like?
If we take a look at a "Point and Figure" Chart on Agree Realty (ADC) from StockCharts.com, we can actually see what appears to be a still-strong picture of a steadily appreciating price performance for this REIT.
Summary: What do I think?
Well this is an interesting stock, but not one that I would be writing up today! I now depend more on Morningstar.com figures and insist on increasing revenue, increasing earnings, and information on the balance sheet and free cash flow. But the stock did do well after posting!
Thanks again for visiting! If you have any comments or questions, please feel free to leave them on the blog, or email me at bobsadviceforstocks@lycos.com. Have a great weekend everyone!
Bob
Posted by bobsadviceforstocks at 3:48 PM CST
|
Post Comment |
Permalink
Updated: Saturday, 24 February 2007 3:49 PM CST
"Looking Back One Year" A review of stock picks from the week of October 10, 2005

Hello Friends! Thanks so much for stopping by and visiting my blog, Stock Picks Bob's Advice! As always, please remember that I am an amateur investor, so please remember to always consult with your professional investment advisers prior to making any investment decisions based on information on this website.
One of the jobs I like to do on weekends is to review past stock picks in as organized a fashion as possible. This "Weekend Review" started a couple of years ago, when I realized I needed to start examining past stock selections to find out how they all turned out. These reviews assume a "buy and hold" strategy. In practice, if you follow this blog on a regular basis, you will know that I employ my own idiosyncratic disciplined portfolio management system in which I sell my losing stocks quickly and completely and sell my gaining stocks slowly and partially at targeted appreciation levels.
But for the sake of this blog and the ease of reviewing past stock picks, I assume a strategy of buying equal $ amounts of each stock 'picked' and I assume I held onto those positions regardless of the price change. The difference between this strategy and what I actually employ and advocate in my blog would certainly affect actual performance.
 During the week of October 10, 2005, I actually only 'picked' one stock for the blog, although I note that I had several discussions with readers about other stocks that week. Johnson Controls (JCI) is a stock that both my wife and my son have shares in, but I do not own any shares in my own "trading portfolio". This is one of my 'great Wisconsin firms' that I have written about on the blog. But of course I am proud of manufacturing companies from my adopted home state.
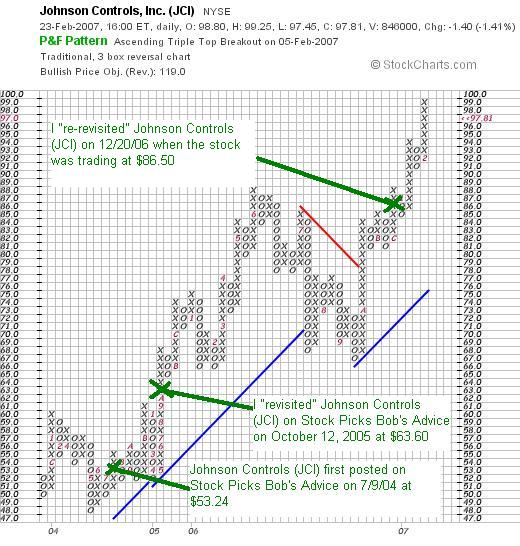
On October 12, 2005, I "revisited" Johnson Controls when the stock was trading at $63.60. I actually first wrote up Johnson Controls (JCI) on July 9, 2004, almost three years ago when the stock was trading at $53.24. Johnson Controls closed at $97.81 on February 23, 2007, for a gain of $34.21 or 53.8% since posting last year. More recently, I "revisited" Johnson Controls on Stock Picks Bob's Advice on December 20, 2006, when the stock was trading at $86.50.
 On January 19, 2007, Johnson Controls (JCI) reported 1st quarter 2007 results. Sales for the quarter ended December 31, 2006, rose 9% to $8.2 billion from $7.5 billion in the prior year. However, net income dipped to $162 million or $.82/diluted share, down from $165 million or $.85/diluted share in the same period the prior year. No matter how much I like JCI, and no matter how well this stock has performed on this blog, the earnings report gets a 'thumbs-down' whenever it shows a decrease in either revenue or earnings on this blog.
So how did I do with this single stock pick from that week in October, 2005? Terrific! It showed an appreciation of 53.8% since posting in October, 2005.
Thanks so much for visiting! If you have any comments or questions, please feel free to leave them on the blog or email me at bobsadviceforstocks@lycos.com. If you get a chance, be sure and drop by and visit my Stock Picks Podcast Website where I discuss some of the stocks I write about here on the blog.
Bob
Posted by bobsadviceforstocks at 11:05 AM CST
|
Post Comment |
Permalink
Updated: Saturday, 24 February 2007 2:21 PM CST
Universal Electronics (UEIC)
Hello Friends! Thanks so much for stopping by and visiting my blog, Stock Picks Bob's Advice! As always, please remember that I am an amateur investor, so please remember to consult with your professional investment advisers prior to making any investment decisions based on information on this website.
 As I promised yesterday, let's take a closer look at Universal Electronics (UEIC) that I added to my own trading portfolio after my partial sale of Bolt (BTJ). UEIC closed at $27.89, up $5.35 or 23.74% on the day. This stock easily made the list of top % gainers on the NASDAQ. As I just indicated, this particular stock is a stock that I now am an owner of, so please take that into consideration as well.
What exactly does this company do?
According to the Yahoo "Profile" on Universal Electronics, the company
 "...provides preprogrammed wireless control products and audio-video accessories for home entertainment systems, as well as software designed to enable consumers to wirelessly connect, control, and interact with a home environment. The company's family of preprogrammed wireless control products includes touch screen remote controls, wireless keyboards, game controllers, antennas, and various audio/video accessories, as well as custom and customizable microcontrollers that include its library of infrared remote (IR) codes, proprietary software, and digital media control software."
How did they do in the latest quarter?
It was the announcement of 4th quarter 2006 earnings and 2007 guidance after the close of trading Thursday that drove the stock higher Friday. Net sales for the quarter came in at $69.7 million, an increase of $20.4 million or 41.4% over sales of $49.3 million in the same period in 2005. Net income for the quarter was $5.4 million or $.37/share, compared to $3.5 million or $.25/diluted share, approximately a 50% increase year over year.
This $.37/share exceeded expectations of $.32/share according to analysts following the stock. The company also raised guidance for 2007 to earnings of $1.13 to $1.23/share. This was ahead of 'Wall Street estimates' of $1.09/share. From my own perspective, the combination of strong revenue increases with earnings growth which exceed expectations and having the company raise guidance in the same announcement is often associated with a price increase in equities.
How about longer-term financial results?
Reviewing the Morningstar.com "5-Yr Restated" financials on UEIC, we can see that except for a dip in revenue between 2001 and 2002 when revenue dropped from $119 million to $104 million, the company has been steadily increasing revenue up to $181 million in 2005 and $202 million in the trailing twelve months (TTM).
Earnings which also dipped from $.78/share in 2001 to $.42/share in 2002, have subsequently steadily increased to $.69/share in 2005 and $.77/share in the TTM. No dividends are paid and the outstanding shares have remained steady at 14 million in 2001 and 14 million in the TTM.
Free cash flow, which dropped from $17 million in 2003 to $1 million in 2004, increased to $11 million in 2005 and $14 million in the TTM.
The balance sheet, as presented on Morningstar, appears very solid with $58.8 million in cash, which alone can easily cover both the $47.0 million in current liabilities and the negligible $100,000 in long-term liabilities. Calculating the current ratio, we get a total of $137.4 million in total current assets which when compared to the $47.0 million in current liabilities yields a current ratio of 2.92. Generally ratios over 1.25 are considered 'healthy'.
How about some valuation numbers?
Checking the Yahoo "Key Statistics" on Universal Electronics, we can see that this is a small cap stock with a market capitalization of only $390.49 million. The trailing p/e is a moderate 34.22, with a forward p/e (fye 31-Dec-07) estimated at 25.82. With the rapid growth, the PEG ratio (5 yr expected) is estimated at 1.24. This is well within my 1.0 to 1.5 range that I view as a reasonable PEG.
According to the Fidelity.com eresearch website, UEIC has a Price/Sales (TTM) ratio of 1.63 with an industry average of 1.22. The company also has a return on equity (TTM) of 11.14% close to the industry average of 11.65%. At least by both of these valuations, we find that the company is selling at a slight premium to its peers in the same industrial group.
Finishing up with Yahoo, we see that there are 14 million shares outstanding with only 13.86 million that float. Of these shares that float, there were 428,400 shares out short as of 1/9/07. This represents 11.4 trading days of volume (short ratio) due to the low average volume of 65,686 shares. This significant short interest may well have 'squeezed' the short-sellers yesterday causing the sharp price increase as short-sellers, I suspect, were scrambling to exit their positions by buying back shares that they had previously sold to close out their speculation on a price drop.
As I noted, no dividends are reported on Yahoo, and the last stock split reported was a 2:1 split in February, 2000.
What does the chart look like?
Taking a look at the "Point and Figure" Chart on Universal Electronics, actually for the first time as I write this up, I am struck by what appears to be a classical William O'Neil "Cup and Handle" configuration.
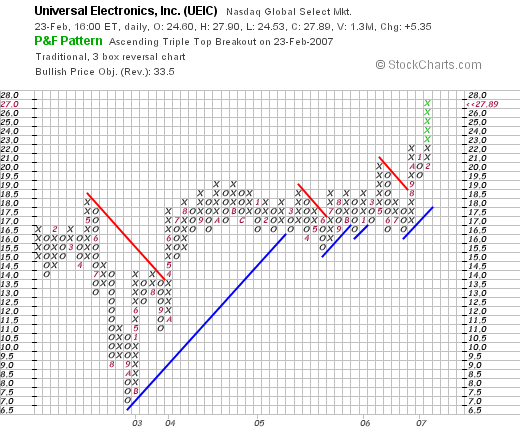
Now I am not a technician, and I don't put a huge amount of weight into stock price patterns, but I remember reading about cups and handles when reading How to Make Money in Stocks...and even this is a Point and Figure Chart, this certainly has that characteristic, of a dip, a long period of consolidation, then a break-out on the upside.
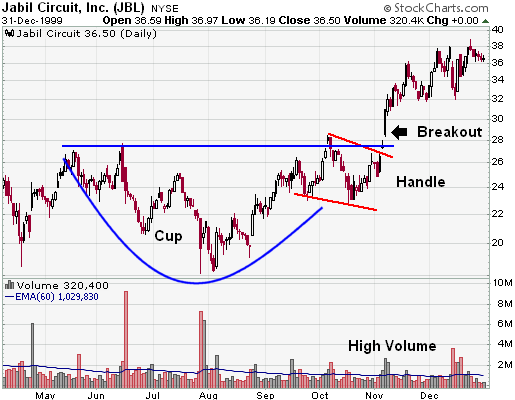
This is an illustration of a Point and Handle from StockCharts.com:
In any case, whether the stock is truly a "cup and handle" or not, the chart appears encouraging because the stock is just now moving higher after a long period of moving sideways. It certainly doesn't appear over-extended.
Summary: What do I think?
To summarize, I liked this stock enough to buy some shares :). The stock moved strongly higher yesterday, likely as shorts were squeezed. They announced great earnings results, exceeded estimates, and raised guidance. The Morningstar.com looks nice with several years of revenue and earnings growth without increasing the stock float. Free cash appears positive and growing, and the balance sheet is solid. Valuation-wise the p/e is a tad rich but the PEG suggests reasonable valuation. The Price/Sales and the ROE are a bit under their peers but with the strong growth, a premium might well be worth it. Finally, the chart looks solid.
I had that nickel in my pocket for about 15 minutes, lol, and I spent it. Now I got myself a remote control stock :). Hope it works out great!
Thanks so much for stopping by and visiting! As always, if you have any comments or questions, please feel free to leave them on the blog or email me at bobsadviceforstocks@lycos.com. If you get a chance, feel free to visit my Stock Picks Podcast Website where I discuss some of the many stocks I write about here on the blog.
Bob
Friday, 23 February 2007
Universal Electronics (UEIC) "Trading Transparency"
Hello Friends! Thanks so much for stopping by and visiting my blog, Stock Picks Bob's Advice! As always, please remember that I am an amateur investor, so please remember to consult with your professional investment advisors prior to making any investment decisions based on information on this website.
Continuing with my practice of 'transparency' I wanted to let you all know that I chose to purchase 180 shares of Universal Electronics (UEIC) a few moments ago in my Trading Account. These shares were bought at a price of $25.18. That nickel didn't last long in my pocket, did it?
I believe it fits my investment criteria, was on the list of top % gainers today, and I had a 'permission slip' to buy something....so there it was!
Anyhow, if you have any comments or questions, please feel free to leave them on the blog. I shall try to write up a more complete evaluation of this particular company later today or this weekend. Please feel free to email me at bobsadviceforstocks@lycos.com for any other comments or questions....leave your name and location with the email so I can respond on the blog if possible!
Bob
Bolt Technology Corp (BTJ) "Trading Transparency"
Hello Friends! Thanks so much for stopping by and visiting my blog, Stock Picks Bob's Advice! As always, please remember that I am an amateur investor, so please remember to consult with your professional investment advisers prior to making any investment decisions based on information on this website.
I am a bit old-fashioned about my sales of stock at targeted appreciation levels. That is, I don't do this automatically. I just check my portfolio and when I see a stock hitting a sale point, I execute the trade. Apparently, Bolt (BTJ), had a big trading day and moved higher, especially later in the day yesterday, hitting my first sale point without me realizing it!
This morning, Bolt was still above my first sale target (which is a 30% appreciation level) and I sold 1/6th of my holding, or 50 shares out of 300 shares, at a price of $23.18. These shares were actually acquired just last month on 1/12/07, at a cost basis of $17.44. So this represented a gain of $5.74/share or 32.9% since my purchase.
When will my next sale be? On the upside, if Bolt hits a 60% appreciation target, or 1.6 x $17.44 = $27.91, then I plan on selling another 1/6th of my remaining shares or 250/6 = 41 shares, at that level. On the downside, after a single sale at the first appreciation target, I plan on allowing Bolt to drift back down to its purchase price, or $17.44/share, prior to unloading all of my remaining shares.
How does this affect my overall portfolio strategy? Since I am at 16 positions, under my maximum of 25 holdings, this sale at a gain gives me a "permission slip" to add a new position. As I like to say, that nickel is already burning a hole in my pocket! So I shall have to examine the list of top % gainers today, and see if anything fits the bill!
Thanks so much for stopping by and visiting! I hope that my commentary is helpful to you! If you have any comments or questions, please feel free to leave them on the blog or email me at bobsadviceforstocks@lycos.com. If you get a chance, be sure and visit my Stock Picks Podcast Website, where you can hear me talk about many of the same stocks and issues I write about on this website!
Bob
Thursday, 22 February 2007
VCA Antech (WOOF) "Revisiting a Stock Pick"
CLICK HERE FOR MY PODCAST ON WOOF!Hello Friends! Thanks so much for stopping by and visiting my blog, Stock Picks Bob's Advice! As always, please remember that I am an amateur investor, so please remember to consult with your professional investment advisers prior to making any investment decisions based on information on this website.
 Earlier today I posted how I had purchased shares of VCA Antech after getting the 'permission slip' to add a new position after selling some of my Morningstar stock at a targeted gain. As promised, let's take another look at WOOF and I will share with you why I believe it deserves a spot on this blog and why I bought shares!
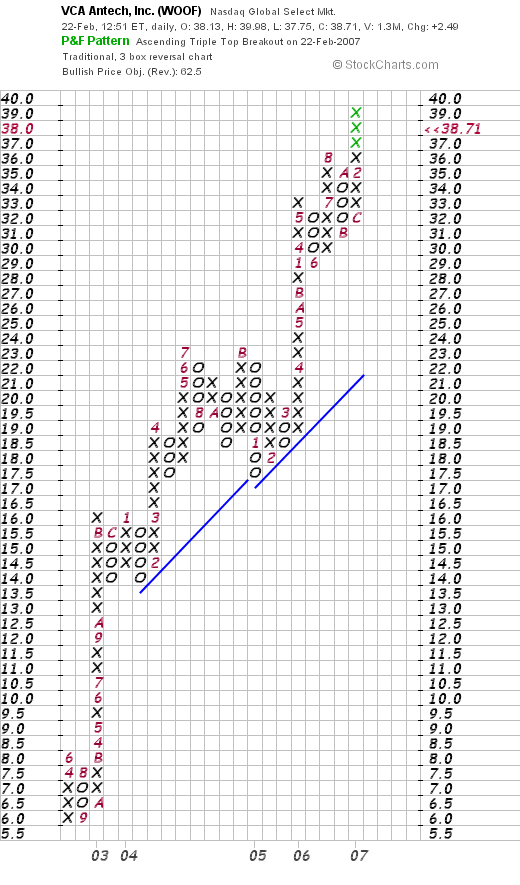
As I noted in my previous post, I first wrote up VCA Antech (WOOF) on Stock Picks Bob's Advice on March 17, 2004, at a price of $34.69. Adjusted for a 2:1 stock split, this pick price is actually $17.35. WOOF is currently trading at $38.89 up $2.67 or 7.37% on the day. This represents an appreciation of $21.54 or 124.1% since my original post!
What exactly does this company do?
 According to the Yahoo "Profile" on VCA Antech (WOOF), the company
"...operates as an animal healthcare services company in the United States. It provides veterinary services and diagnostic testing to support veterinary care; and sells diagnostic imaging equipment, and other medical technology products and related services. The company operates in three segments: Laboratory, Animal Hospital, and Medical Technology."
How did they do in the latest quarter?
It was the announcement of their 4th quarter 2006 results after the close of trading yesterday that drove the stock higher today. For the quarter ended December 31, 2006, revenue climbed 11.7% to $242.4 million. Net earnings increased 13.4% to $19.3 million and diluted earnings per share were up 15% to $.23/share.
The company beat expectations of $.21/share in earnings on revenue of $232.4 million. In another positive part of the report, the company raised guidance for 2007 to earnings of $1.29 to $1.33 per share, up from earlier views of $1.27 to $1.31/share. In addition, they raised guidance on revenue to $1.07 to $1.09 billion, up from $1.05 to $1.08 billion previously estimated.
What about longer-term financial results?
Reviewing the Morningstar.com "5-Yr Restated" financials on VCA Antech, we can see the perfect picture of revenue growth climbing from $435.2 million to $839.7 million in 2005 and $957.9 million in the trailing twelve months (TTM).
Earnings have also increased steadily from $.28/share in 2002 to $.81/share in 2005 and $1.22 in the TTM. The company has been increasing its shares outstanding modestly from 73 million in 2002 to 84 milllion in the TTM. However, during this period, revenue basically doubled and earnings quadrupled. This is an acceptable dilution imho.
Free cash flow has been positive and increasing overall with $61 million in 2003 increasing to $86 million in 2005 and $84 million in the TTM.
The balance sheet is adequate although the company does have a bit of long-term debt. WOOF is reported to have $32.8 million in cash and $104 million in other current assets. This total of $136.8 million, when compared to the $81.9 million in current liabilities yields a current ratio of 1.67. As I just noted, they also show $447.8 million in long-term liabilities that doesn't appear to be a problem for them with their growing free cash flow and nice current ratio.
How about some valuation numbers on this stock?
Checking the Yahoo "Key Statistics" on WOOF, we find that the company is a mid-cap stock with a market capitalization of $3.25 billion. The trailing p/e is a bit rich at 31.90 with a forward p/e of 29.22 (fye 31-Dec-07) estimated. The PEG (5 yr expected) works out to a slightly rich 1.74. (I like PEG's between 1.0 and 1.5 if possible).
According to the Fidelity.com eresearch website, VCA Antech carries a Price/Sales (TTM) ratio of 3.07, compared to an industry average of 1.08. The company, however, is more profitable than average with a return on equity (ROE) (TTM) of 27.07%, compared with an industry average of 20.64%.
Finishing up with Yahoo, WOOF has 83.5 million shares outstanding with 80.78 million that float. As of 1/9/07, there were 1.92 million shares out short representing 2.4% of the float or 5.3 trading days of average volume. We could well be observing a 'short squeeze' today as the stock climbs sharply on the back of good news.
No cash dividend is reported and as I noted above, the company last split is stock as a 2:1 split in August, 2004.
What does the chart look like?
Examining the "Point & Figure" chart on WOOF from StockCharts.com, we can see a very strong price appreciation from $6.00 in March, 2002, to its current high of $38.71. This is a very strong chart with little weakness seen in its price for the last several years.
Summary: What do I think?
Well, as you can tell I liked this stock well enough to buy some shares today! Seriously, the stock is moving strongly higher in a relatively weak trading days likely on the back of good earnings and lots of short-sellers scrambling to cover. The company reported solid earnings and revenue growth, beat expectations, and raised guidance for both! That is about as perfect an earnings report as you could expect!
The Morningstar.com report looks nice with steady and strong revenue and earnings growth, a small increase in the shares outstanding, positive and growing free cash flow, and a solid balance sheet (although long-term debt is a bit significant).
Valuation is indeed a bit rich with a p/e in the 30's and a PEG over 1.5. The Price/Sales figure is also a bit higher than the industry average, but the return on equity suggests the company is also a bit more profitable. Finally, there are lots of short-sellers (more than my '3 day rule'), and the chart looks quite strong. It was enough to get me to buy some shares and that is exactly what I did!
Thanks so much for stopping by and visiting my blog. If you have any comments or questions, please feel free to leave them right on the website or email me at bobsadviceforstocks@lycos.com. If you get a chance, drop by and visit my Stock Picks Podcast Website.
Bob
Posted by bobsadviceforstocks at 12:18 PM CST
|
Post Comment |
Permalink
Updated: Monday, 26 February 2007 9:56 PM CST
VCA Antech (WOOF) "Trading Transparency"
Hello Friends! Thanks so much for stopping by and visiting my blog, Stock Picks Bob's Advice! As always, please remember that I am an amateur investor, so please remember to consult with your professional investment advisers prior to making any investment decisions based on information on this website.
Well that nickel didn't last long in my pocket did it? (some surprise?) Having a 'permission slip' to buy another position, I went right to the top % gainers list today and came across an old favorite of mine, VCA Antech (WOOF) which was on the list of top % gainers on the NASDAQ and is trading at $39.05, up $2.98 or 8.23% on the day as I write.
I say "old favorite" as I first wrote up this stock on March 17, 2004, on Stock Picks Bob's Advice when it was trading at $34.69. WOOF had a 2:1 stock split in August, 2004, making my effective pick price actually $17.35.
Anyhow, seeing an old favorite of mine, a stock that I would say is part of my vocabulary of stocks, I went ahead and purchased 180 shares at a price of $39.15.
I shall try and do an updated write-up on this stock later today :).
Thanks so much for visiting! If you have any comments or questions, please feel free to email me at bobsadviceforstocks@lycos.com or just leave your notes on the blog!
Bob
Morningstar (MORN) "Trading Transparency"
Hello Friends! Thanks so much for stopping by and visiting my blog, Stock Picks Bob's Advice! As always, please remember that I am an amateur investor, so please remember to consult with your professional investment advisers prior to making any investment decisions based on information on this website.
A few moments ago, checking my holdings in my Trading Account, I noticed that Morningstar had hit a 'sale point' and I sold 27 shares, 1/6th of my 167 share holding, at $52.32. These shares had been purchased 11/22/05 at a cost basis of $32.57. Thus, this represented a gain of $19.75 or 60.6% on the original purchase. This was my second sale of Morningstar shares, having sold 33 shares of Morningstar 2/16/06 at a net of $42.94, which was at a gain of $10.37 or 31.8%.
As you may know, my strategy in this account is to sell portions (currently 1/6th of remaining shares) at targeted appreciation points, which I have set at 30, 60, 90, 120, then 180, 240, 300, 360, then 450, etc. This sale also creates a 'buy signal' entitling me, since I am well under my maximum 25 positions (currently holding 15 positions) to add a new position to my holdings. As I like to say, "that nickel is burning a hold in my pocket already!"
When do I plan to sell Morningstar shares next? As I noted above, on the upside, if the stock should appreciate to a 90% appreciation point, then I shall be selling 1/6th of my 140 shares (23 shares), or on the downside, if the stock should retrace 50% of the highest sale point, or back to a 30% appreciation point (1.3 x $32.57 = $42.34) then I plan on selling all remaining shares.
I believe that this pattern of selling gaining stocks slowly and partially and declining stocks quickly and completely will prove to be an effective strategy at creating a winning portfolio. Of course, this is a work in progress, and time will tell if this will be successful!
Thanks again for stopping by and visiting! If you have any comments or questions, please feel free to leave them on the blog or email me at bobsadviceforstocks@lycos.com.
Bob
Posted by bobsadviceforstocks at 10:06 AM CST
|
Post Comment |
Permalink
Updated: Thursday, 22 February 2007 10:09 AM CST
Wednesday, 21 February 2007
Vulcan Materials Company (VMC)
Hello Friends! Thanks so much for stopping by and visiting my blog, Stock Picks Bob's Advice! As always, please remember that I am an amateur investor, so please remember to consult with your professional investment advisors prior to making any investment decisions based on this website.
 As I like to do, I was looking through the list of top % gainers on the NYSE to see if I could get either a new name to discuss, or an old name that had not been discussed for at least a year. (I generally don't like to 'revisit' stocks unless a good 12 months has passed.)
Near the top of the list (following an old favorite of mine, Jack in the Box), I found Vulcan Materials (VMC), which as I write is trading at $121.65, up $10.97 or 9.91% on the day. I do not own any shares of Vulcan nor do I have any options on this stock.
This is actually an interesting stock pick, because Vulcan is in the process of acquiring Florida Rock (FRK), another old favorite of mine here on Stock Picks! In fact, I posted FRK on Stock Picks Bob's Advice on July 20, 2004, when Florida Rock was trading at $42.21/share. FRK split 3:2 on July 5, 2005, making my effective stock pick price actually $28.14. Unfortunately, I don't own any shares of FRK either :(, because with this buy-out from Vulcan, FRK is trading at $68.43 as I write, showing an appreciation of $40.29/share or 143.2% since posting. Oh well, that is water under the bridge, or in this case, concrete under the overpass you could say.
What is interesting, is that usually the acquiring company declines in price with the assumption of debt and the dilution of shares. In this case, the street liked the merger and the stock price of Vulcan and Florida Rock have been climbing.
Let's take a closer look at Vulcan and I will show you why I believe it deserves a place on the blog!
What exactly does this company do?
 Reviewing the Yahoo "Profile" on Vulcan Materials, we find that the company
"...and its subsidiaries engage in the production, distribution, and sale of construction aggregates and other construction materials and related services in the United States and Mexico. Its construction aggregates include crushed stone, sand and gravel, rock asphalt, and recrushed concrete, which are used in highway construction and maintenance, as well as in the production of asphaltic and portland cement concrete mixes, and as railroad track ballast. It also offers other products and services, including asphalt mix and related products, concrete, trucking services, and water transportation services."
How did they do in the latest quarter?
On January 31, 2006, Vulcan announced 4th quarter 2006 results. Net sales climbed 9% to $816.3 million from $754.6 million in the same period last year. Net earnings per share increased 33% to $1.20/share from $.90/share in the 4th quarter of 2005.
The company also raised guidance on 1st quarter 2007, indicating earnings of $.75 to $.95/share for the quarter. Analysts had apparently been expecting $.69/share. The company also raised guidance on earnings for the full year to $5.51 to $5.91/share. Analysts had been expecting $5.40/share in 2007.
Another indicator on the confidence of management regarding company prospects, the company raised its dividend 24.3% to $.46/share from $.37/share.
How about longer-term financial results?
Examining the Morningstar.com "5-Yr Restated" financials on VMC, we see that the company, after a dip in revenue from $2.3 billion in 2001 to $2.2 billion in 2002, turned around and grew revenue strongly and steadily to $2.9 billion in 2005 and $3.3 billion in the trailing twelve months (TTM).
Earnings also dipped from $2.17 to $1.66 between 2001 and 2002, then increased steadily to $3.73/share in 2005 and $4.38/share in the TTM. The company also pays a nice dividend and has been increasing that dividend steadily from $.90/share in 2001 to $1.16/share in 2005 and $1.40/share in the TTM. After maintaining the shares outstanding stable with 101 million in 2001 increasing less than 1% to 102 million in 2005, the company retired shares recently with only 94 million reported in the TTM.
Free cash flow has been positive, although not increasing recently, with $325 million in 2003, dipping to $258 million in 2005 and $199 million in the TTM.
The balance sheet appears solid with $68.7 million in cash and $762.7 million in other current assets. This total of $831.4 million can easily cover the $574.9 million in current liabilities and the current ratio works out to a reasonable 1.45. The company, in addition, has $922.3 million in long-term liabilities per Morningstar.
What about some valuation numbers?
Checking Yahoo "Key Statistics" on Vulcan, we find that this is a large cap stock with a market capitalization of $11.55 Billion. The trailing p/e isn't bad at 26.03 (imho), with a forward p/e estimated (fye 31-Dec-08) of 19.36. The PEG is a bit rich at 2.16.
According to the Fidelity.com eresearch website, the Price/Sales (TTM) is a bit rich at 3.21 with an industry average of 2.18. The company has a Return on Equity (TTM) of 23.67% much higher than the industry average of 14.47%.
Finishing up with Yahoo, we find that there are 94.70 million shares outstanding with 93.94 million that float. Of these, 3.9% of the float is out short representing a short ratio of 8.3 trading days of volume. This exceeds my own particular '3 day rule' for short interest and we may well be seeing a bit of a 'squeeze' of the shorts as the stock price climbs.
The forward dividend is $1.84 yielding a not inconsequential 1.6%. The last stock split was a 3:1 split in March, 1999.
What does the chart look like?
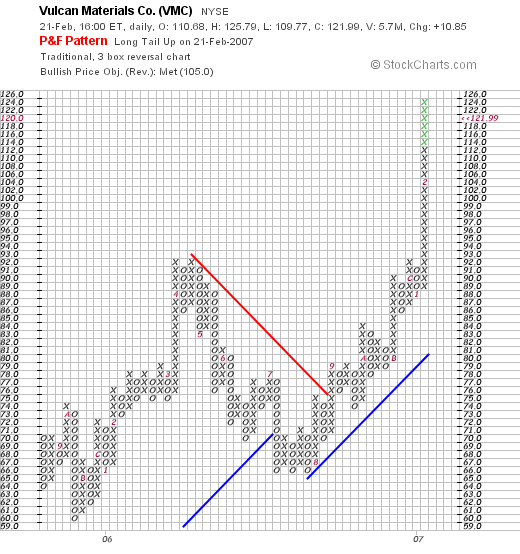
If we look at a "Point & Figure" chart on Vulcan from StockCharts.com, we can see how the stock surged between August, 2005, and April, 2006, from a price of $64 to a high of $91. The stock then sold off to a 'triple bottome' at the $66 level, only to turn higher moving almost vertically between $92 and $123. The stock does appear to be a bit overextended technically.
Summary: What do I think?
Well, in general I like this company. They had a great quarter, beating estimates and raising guidance, their Morningstar.com report looks solid with steady revenue and earnings growth the past several years and they even pay an increasing dividend. They have maintained their outstanding shares and even bought back some recently.
Free cash flow is positive, but decreasing, and the balance sheet appears reasonable.
Valuation-wise the p/e is ok with a PEG over 1.5 suggesting a bit of a rich valuation. The Price/Sales is also a bit higher than average for its industry, although profitability, as measured by the Return on Equity is also higher than average. In addition, there are a bunch of shares out short that may well be scrambling to be 'undone', with the price moving sharply higher today. The chart does look a bit over-extended on an unmaintainable verticle rise, but overall, it appears that this company has been doing things right for quite awhile.
Thanks again for stopping by and visiting! If you have any comments or questions, please feel free to leave them on the blog or email me at bobsadviceforstocks@lycos.com. If you get a chance, drop by and visit my Stock Picks Podcast site!
Bob
Tuesday, 20 February 2007
VASCO Data Security International (VDSI) "Revisiting a Stock Pick"
Hello Friends! Thanks so much for stopping by and visiting my blog, Stock Picks Bob's Advice! As always, please remember that I am an amateur investor, so please remember to consult with your professional investment advisers prior to making any decisions based on information on this website.
If you read the latest two entries, you might think that I don't like any stocks that readers write to me about. That really isn't true. I first became aware of one of my current holdings when a good friend of mine, George K. emailed me about Precision Castparts. The rest, as they say, is history. Last year, on January 31, 2006, Sean G., another reader of this blog, wrote in to ask me about Vasco Data Security (VDSI). I wrote up both of these stocks and I generally did like what I read about. And it was because of my work a year ago, that when the stock came up again today, it made sense to write about it once more.
 Looking through the list of the top % gainers on the NASDAQ today, I saw that VASCO (VDSI) had made the list, closing at $18.45, up $3.32 or 21.94% on the day. A year ago, when I wrote up Vasco on January 31, 2006, the stock was trading at $10.75. Thus, the stock has appreciated 71.6% since the original post a little over a year ago. I do not own any shares, nor do I have any options on this stock.
What exactly does this company do?
According to the Yahoo "Profile" on VASCO, the company
"...through its subsidiaries, engages in the design, development, marketing, and support of open standards-based hardware and software security systems that manage and secure access to information assets worldwide. It offers patented �Strong User Authentication� products for e-business and e-commerce, which enable secure financial transactions to be made over private enterprise networks and public networks, such as the Internet. Its product line includes, Digipass and VACMAN."
How did they do in the latest quarter?
This morning, prior to the opening of trading, VASCO announced 4th quarter 2006 results. For the quarter ended December 31, 2006, revenues increased 44% to $25.2 million from $17.5 million in the same quarter in 2005. Net income for the quarter came in at $5.1 million or $.13/diluted share, up sharply from $3.0 million or $.08/diluted share in the same period last year.
The company beat expectations for earnings; analysts had been expecting $.11/share, and the company came in at $.13. The company did come in a little light on revenue; analysts expected $25.7 million and the company came in at $25.2 million. At the same time, the company forecast an optimistic picture of revenue growth of 35-45%. This was enough to push the stock price sharply higher today.
What about longer-term financial results?
Looking at the Morningstar.com "5-Yr Restated" financials on VDSI, we find that revenue growth, which dipped from $23 million in 2001 to $17 million in 2002, subsequently steadily and strongly increased to $55 million in 2005 and $68 million in the trailing twelve months (TTM). The company reported a loss of $(.06)/share in 2003, turned profitable at $.09/share in 2004, and came in at $.21/share in 2005 and $.28/share in theTTM.
There were 29 million shares in 2003. By the TTM, the number of shares had increased by almost a third to 37 million, however, during this same period of time, revenue was up almost 200% from $23 million in 2003 to $68 million in the TTM. This does not appear to be a significant dilution in company stock.
Free cash flow is positive and growing the past few years. $2 million in 2003 increased to $7 million in 2005 and $11 million in the TTM.
As reported by Morningstar.com, the balance sheet appears solid with $23.5 million in cash, which by itself could easily cover the combined $16.5 million in current liabilities and the $.7 million in long-term liabilities combined. Calculating the current ratio, the company has a total of $40.6 million in current assets, which when compared to the $16.5 million in current liabilities, works out to a 'healthy' 2.46 ratio.
What about some valuation numbers?
Checking the Yahoo "Key Statistics" on VDSI, we find that the market cap is a mid cap $673.59 million. The trailing p/e is a rich 66.61 with a forward p/e (fye 31-Dec-07) estimated at 41.93. The PEG ratio is a bit rich at 1.53. (Generally 1.0 to 1.5 are reasonable PEG's imho).
Reviewing the Fidelity.com eresearch website, we find that VDSI has a Price/Sales ratio (TTM) of 8.04, well ahead of the industry average of 5.55. It should be noted that the company is more profitable than average with a 'return on equity'(TTM) of 35.08%. This is significantly higher than the industry average of 21.12%.
Finishing up on Yahoo, we find that there are 36.51 million shares outstanding with 26.40 million that float. As of 1/9/07, there were 2.62 million shares out short representing 9.8% of the float or 5.5 trading days of volume. With the solid earnings report today, the 'naysayers' might have gotten "squeezed" with the stock price rising as the short-sellers scrambled to pick up shares to cover their already 'pre-sold' stock!
No cash dividend and no stock splits are reported on Yahoo.
What does the chart look like?
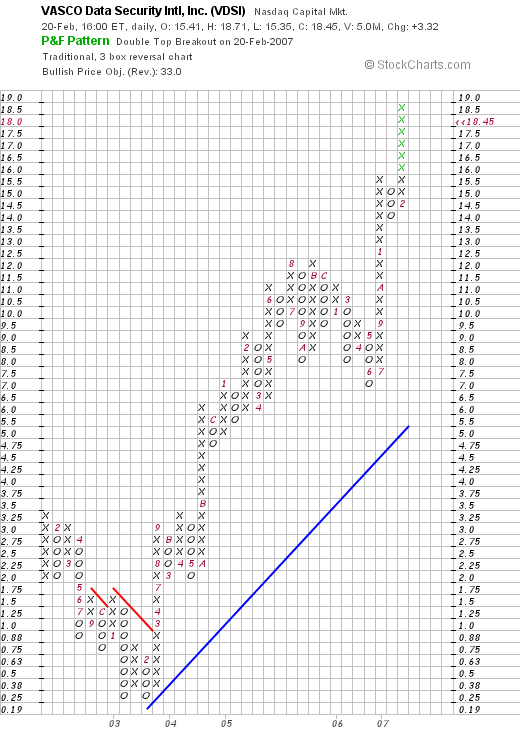
Looking at a "Point & Figure" chart on VDSI from StockCharts.com, we can see that while the stock price was actually declining back through nearly all of 2002 and the first few months of 2003, the stock actually hit a low at $.25/share in 2003, only to climb sharply higher to the current $18.50 level. The chart looks strong to me!
Summary: What do I think about this stock?
Reviewing a few of the points I made above, the company came in today with a strong financial report. They have been growing nicely the past several years with steady revenue, earnings, and free cash flow with a very solid balance sheet. However, the stock price is fairly rich with a p/e in the 60's, a Price/Sales higher than the average company in its industrial group, and a chart that looks strong but perhaps a little overextended short term. This is an interesting stock that is the kind of stock that I would be buying, if I had a 'permission slip' to be out purchasing a new position!
Thanks again for visiting! If you have any comments or questions, please feel free to leave your comments right on the blog or email me at bobsadviceforstocks@lycos.com. If you get a chance, please feel free to visit my Stock Picks Podcast Site, where I discuss many of the same stocks I write about here on the blog.
Bob
Newer | Latest | Older


