


Hello Friends! Thanks so much for stopping by. I got caught by the JUNO sell-off today....sometimes better to avoid those micro-cap stocks that are overly-volatile. (Some day I may learn I hope.) Please remember that I am an AMATEUR investor, so please consult with your professional investment advisors prior to making any decisions based on things you read on this website. Also please do your own investigation of all stocks discussed to verify information posted.
 Florida Rock Industries (FRK) is having a very nice day today trading currently at $42.21, up $2.04 or 5.08% on the day. I do not own any shares nor do I have any options in this stock. According to the Yahoo "Profile" on FRK, they operate "...principally in three business segments: construction aggregates, concrete products and cement and calcium products." I believe this is our first "rock" stock.
  On April 20, 2004, FRK announced their second quarter 2004 results. (I do not have a link for this as it came off of their website). Consolidated total sales for the quarter increased 40% to $228.6 million from $163.6 million the prior year. Net income came in at $24.5 million or $.56/share up from $16.3 million or $.37/diluted share a more than 50% increase. These are very nice results.
 If we look a bit longer-term at "5-Yr Restated" financials on Morningstar.com, we can see that revenue has steadily increased from $597 million in 1999 to $988 million in the trailing twelve months (TTM).
 Earnings per share have shown a nice progression from $1.07/share in 1999 to $2.60/share in the TTM. Also nice, the company DOES pay a small dividend and it has been increasing it from $.16/share to $.61/share in the TTM...and increasing it EACH year since 1999. Free cash flow has also been excellent and INCREASING from $54 million in 2001 to $104 million in the TTM.
Looking at the balance sheet on Morningstar.com, we can see that the company has $42.5 million in cash and $162.7 million in other current assets. This is plenty to cover the $106.5 million in current liabilities and make a big dent in the $190.3 million in long-term liabilities reported.
How about valuation? Looking at "Key Statistics" On Yahoo, we can see that this is a mid-cap stock with a Market Cap of $1.83 Billion. The trailing p/e is nice at 17.89 with a forward (fye 30-Sep-05) of 14.86. Thus the PEG is downright cheap at 0.99 with a Price/Sales of 1.99 which isn't too rich either.
Yahoo reports 43.25 million shares outstanding with 31.30 million of them that float. Of these shares, 1.33 million shares are out SHORT, which is a LOT for this company (as of 6/7/04), and thus, the short ratio is 7.319 trading days. As you know, I like to use 3.0 days to assign any significance to this number. This is a lot of trading days....and with good results, and a bit of an upward move, we might see a bit of a squeeze. I like this figure.
The company, as noted above, pays a $.66/share dividend yielding 1.66% which isn't too bad in today's low money-market rate environment. Yahoo does not report any stock split.
How about technicals? Looking at stockcharts.com, one of my favorite free websites for basic charting, we can see with a Point & Figure chart:
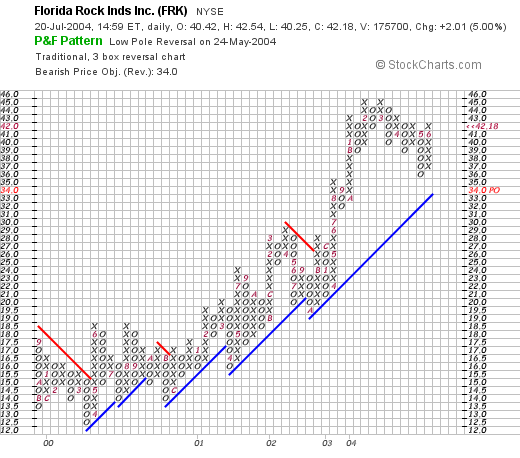
this stock has been trading very nicely above its support levels since it was about $12 in April, 2000. It does not appear over-extended. I don't see much I don't like about this chart imho.
Well what do I think? Well, I am not much into rock stocks :), but this stock looks very nice. We have a GREAT recent earnings report, the past five years shows steady growth in revenues and earnings, the company pays a small and GROWING dividend, the free cash flow is strong and growing, the balance sheet is fine, the valuation looks excellent with a PEG under 1.0, and why we even have a bunch of short-sellers out there WAITING to buy shares! Technically the chart looks just fine. If I wasn't WAITING for a stock to sell at a gain, I might just be nibbling on this cement stock (is that a mixed metaphor or what?)....but you know the same old problem...I don't have any money to buy stock now!
Thanks so much for stopping by. If you have any questions, comments, or words of encouragement, please feel free to email me at bobsadviceforstocks@lycos.com .
Bob