Stock Picks Bob's Advice
Sunday, 16 September 2007
Enzo Biochem (ENZ) "Long-Term Review #12"

Hello Friends! Thanks so much for stopping by and visiting my blog, Stock Picks Bob's Advice! As always please remember that I am an amateur investor so please remember to consult with your professsional investment advisers prior to making any investment decisions based on information on this website.
I was looking at the 'control panel' for this blog. It is hard to believe that I am now up to 1,605 entries (this is #1,606!). My first post was back on May 12, 2003, when I made a short entry on St Jude Medical (STJ). Needless to say, each entry got a little longer, a little more detailed. I added hyperlinks to source material, and learned how to add pictures. I continue to truly be an amateur blogger!
For some time, I have been doing weekend reviews like I did earlier today. A few months ago, I decided it would be a good idea to look deep into the blog and examine the early entries and find out how they turned out. And whether they still deserve a spot on this website!
 Two weeks ago reviewed my entry on Dick's Sporting Goods (DKS). The next entry on the blog was Enzo Biochem (ENZ) which was also posted on May 22, 2003. I wrote:
"May 22, 2003
Enzo Biochem (ENZ)
Here is a new one for you. Near the top of the list for the NYSE best advancers is Enzo Biochem (ENZ). They are trading currently (1:42 pm Central time) at
$20.40 up $2.36 on the day or a gain of 13.08%.
News for the day is about a new Phase I Clinical Trial result for Crohn's disease....Phas II study to be initiated (this was on  5/20/03). Crohns is a form of inflammatory bowel disease which is "a highly debilitating widespread ailment for which there is no effective treatment"...quoting Dean L. Engelhardt, Ph.D., the President of Enzo on the NYTimes internet site.
Last quarter, revenues increased 11% and net income was up 76%. In actual amounts, revenue for the 3 months ending 1/31/03 amounted to $13.1 million vs $11.8 million a year ago...and operating income was about $2.0 million vs $1.0 million last year. According to the same news story cash flow, an important criterion to consider, was strongly positive at $9.3 million with cash and cash equivalents at $75.9 million vs $61.9 million a year ago.
Looking at the 5 year growth in revenues on Morningstar, we find 1998 at $40.4 million, 1999 at $44.3 million, 2000 at $42.8 million, a slight drop, 2001 at $52.3 million, 2002 at $54.0 million, and $59.3 million for the trailing twelve months.
Cash flow has indeed improved with a $4 million positive in 2000, $7 million in 2001, $9 million in 2002 and $14 million in the trailing twelve months.
Looking a Yahoo, we find the stock with a market cap of $578.4 million, and a p/e of 58.19. An interesting if not compelling issue to be considered for investment. I do not own any shares of this stock nor plan to be buying any in the immediate future. Good luck! Bob"
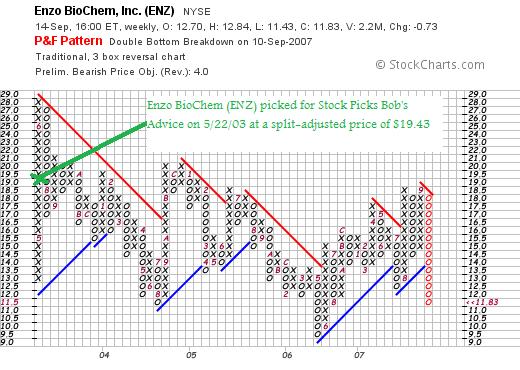
First of all, I selected ENZ on May 22, 2003, at a price of $20.40. ENZO had a 5% stock dividend on October 21, 2004, making my effective pick price actually $20.40 x 100/105 = $19.43. ENZ closed at $11.83 on September 14, 2007, for a loss of $(7.60) or (39.4)% since posting.
How about their latest quarterly report?
 On June 11, 2007, ENZ reported 3rd quarter 2007 results. Revenues climbed 45% to $14.0 million vs. $9.6 million in the year-earlier same period. The net loss for the period was $(3.8) million or $(.10)/share, improved from a lossof $(3.4) million or $(.11)/share the year-earlier.
What about longer-term results?
Looking at the Morningstar.com "5-Yr Restated" financials page, we can see that revenue actually declined from a peak of $54 million in 2002 to as low as $39.8 million in 2006 and has improved to $44.9 million in the trailing twelve months (TTM). Earnings dipped from $.20/share in 2002 to a loss of $(.20)/share in 2004, profitable at $.10/share in 2005, then a loss of $(.50)/share in 2006, improving slightly (as noted above) to a loss of $(.40)/share in the TTM. Shares have been stable with 31 million in 2002 and 33 million in the TTM.
Free cash flow which was positive at $12 million in 2005, dipped to a negative $(14) million in 2006 and $(13) million in the TTM. The company has a solid balance sheet with $120 million in cash and $18 million in other currnt assets, vs. only $8.9 million in current liabilities and $1.1 million in long-term liabilities. Certainly, they can handle both the losses and the negative cash flow for quite awhile.
What about a chart?
Reviewing the 'point & figure' chart on ENZ from StockCharts.com, we can see a rather dismal price chart with the price basically staying below resistance levels for the past 4 1/2 years and a general drift lower with a recent sharp dip in the stock price. This is a poor chart from my amateur perspective.
What do I think?
With the poor quarterly report, the unimpressive Morningstar.com report, and the very weak stock chart,
ENZO BIOCHEM (ENZ) IS RATED A SELL
I rate these stocks with a 'rear-view' mirror. I do this based on my own fundamental screens that I have detailed above. I should note that Lazard Capital Markets just initiated coverage of ENZ with a "buy" rating. Clearly, they look at different things than I do. But I am limiting my own "buy" ratings to stocks with steady revenue and earnings growth, profits, and positive charts. This one just doesn't cut it for me.
Thanks again for stopping by and visiting my blog! If you have any comments or questions, be sure and leave them on the blog or email me at bobsadviceforstocks@lycos.com. If you get a chance, be sure and visit my Stock Picks Podcast Page where I discuss a few of the many stocks I write about on the blog. Also, if you want to know how my own Trading Portfolio is performing, visit my Stock Picks Covestor Page where Covestor, a third-party website, evaluates my actual holdings. Also, since January, 2007, or thereabouts, SocialPicks has been reviewing and analyzing all of my stock picks, and you can visit my Stock Picks SocialPicks Page to read about that! Now THAT should keep you busy :).
Stay well and keep on visiting!
Bob
"Looking Back One Year" A review of stock picks from the week of March 27, 2006

Hello Friends! Thanks so much for stopping by and visiting my blog, Stock Picks Bob's Advice! I am truly grateful for all of you who take the time to visit and read what I write. I have written this line so many times, I am afraid that some may think it isn't sincere. Don't worry. It is! As always, please do remember that I am an amateur investor, so please consult with your professional investment advisers prior to making any investment decision based on information on this website.
It is the weekend once again (!) and that means it is time for a 'weekend review'. I use these review to help me find out about some of the past stock picks on this blog and see whether my 'system' is working. These reviews assume a buy and hold strategy for performance review. In reality, I utilize an active portfolio management strategy involving monitoring each stock in my own Trading Portfolio closely, selling weak stocks on small losses completely and selling strong stocks slowly and partially at targeted appreciation levels. This difference in strategy would certainly affect performance results; for the ease of evaluation, I continue to review past stock selections with a 'buy and hold' assumption.
Last weekend I reviewed the picks from March 20, 2006. I am actually about 18 months out from these reviews instead of the "one year", but this happened, as you might guess, from times in which I, the amateur blogger that I am, missed reviews. I apologize for these absences but still strive to continue to post on as regular a basis as possible. Let's take a look at the stock picks from the next week, the week of March 27, 2006.
 On March 27, 2006, I posted Candela Laser (CLZR) on Stock Picks Bob's Advice when the stock was trading at $20.68. CLZR closed at $7.45 on September 14, 2006, for a loss of $(13.23) or (64.0)% since posting.
On August 21, 2007, Candela reported 4th quarter results. Revenue for the quarter ended June 30, 2007, declined to $39.0 million from $41.3 million the prior year. Earnings for the quarter came in at a loss of $(727,000) or $(.03)/share compared with net income of $2.4 million or $.10/share the prior year. Except for the poor quarterly report, the Morningstar.com "5-Yr Restated" financials is intact.
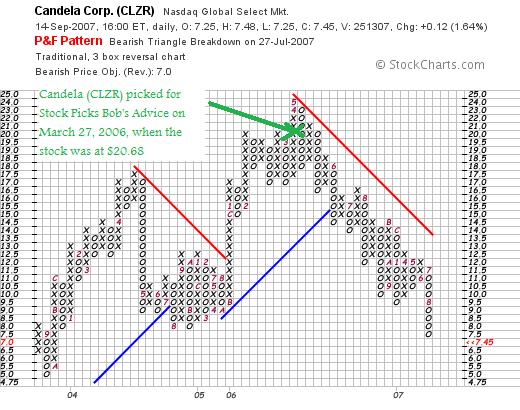
With the very weak quarterly report, and the weak stock chart,
CANDELA (CLZR) IS RATED A SELL

On March 28, 2006, I posted TALX Corporation (TALX) on Stock Picks Bob's Advice when the stock was trading at $28.26. As was announced, Equifax (EFX) acquired TALX Corporation for $35.50/share (or .861 shares of Equifax Stock). Assuming a sale at $35.50/share (I would not recommend taking the Equifax shares unless Equifax 'fitted' into my own investing strategy), this represented a gain of $7.24 or 25.6% since posting.
Since TALX is no longer traded, I shall not be following this stock further (obviously) and also do not have any buy or sell recommendations on this issue (double obviously!).
 On March 30, 2006, I posted NS Group (NSS) on Stock Picks Bob's Advice when the stock was trading at $47.09. On September 11, 2006, NS Group announced that it had entered into an agreement with IPSCO to be acquired for $66.00/share. This was completed by December 4, 2006.
This acquisition represents an appreciation of $18.10 or 37.8% since being posted on the blog.
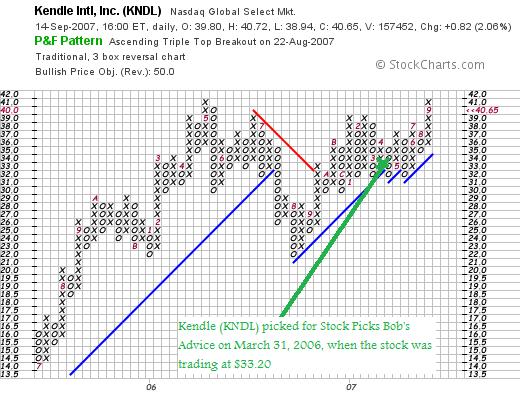
 Finally, on March 31, 2006, I posted Kendle International (KNDL) on Stock Picks Bob's Advice when the stock was trading at $33.20. KNDL closed at $40.65 on September 14, 2007, for a gain of $8.45 or 25.5% since posting.
On August 1, 2007, Kendle reported 2nd quarter 2007 results. Net service revenues for the quarter June 30, 2007, came in at $97.8 million, up 58% over 2nd quarter 2007. Net income came in at $.29/share. This was unchanged from 2nd quarter 2006 results of $.29/share. However, adjusting for acquisition costs (from the Charles River Lab Acquisition), the amount worked out to $.34/share. The company also lowered guidance for 2007 to earnings in the range of $1.32 to $1.52 (an $.18 reduction from previous guidance). The company explained that this represented "The write-off of financing fees results from the debt payments made in July with the proceeds from the convertible note offering." With two explanations in one announcement, in spite of the fabulous revenue growth, and with the strong stock chart, but being an amateur, I cannot really assess the clarity of these results, and thus
KENDLE (KNDL) IS RATED A HOLD
So how did I do with these four stock picks? First of all, I do not think it is coincidental that we have two out of four of these stock picks being acquired. I suspect that acquiring companies are probably looking at all of the same fundamentals that I examine---steady revenue growth, solid earnings, positive, free cash flow, and a healthy balance sheet. Of course, they are able to examine more of the important details with far great comprehension and clarity than I could possible accomplish. But it is interesting, isn't it?
Anyhow, one of my stocks, CLZR imploded with a big loss. The other three showed solid gains. The average performance for these four stocks was a gain of 6.2%.
Thanks again for visiting! Please remember that past performance is no guarantee of future performance. And of course that I am an amateur.
If you get a chance, be sure and visit my Stock Picks Podcast Page where you can download some mp3's of me discussing some of my stocks from the blog. In addition, check out my Covestor Page to find out how my actual trading portfolio has been doing. Unfortunately, that goes back only the last three months. In addition, for anevaluation of my stock picks from at least the beginning of 2007, visit my SocialPicks Page where that website has been monitoring and measuring the accuracy of my picking on this blog!
Have a great weekend everyone. May we all get through the Bernanke-Tuesday upcoming without an excess of price volatility!
Bob
Posted by bobsadviceforstocks at 12:17 PM CDT
|
Post Comment |
Permalink
Updated: Sunday, 16 September 2007 12:53 PM CDT
Friday, 14 September 2007
ICO Inc. (ICOC)
Hello Friends! Thanks so much for stopping by and visiting my blog, Stock Picks Bob's Advice! As always, please remember that I am an amateur investor, so please remember to consult with your professional investment advisers prior to making any investment decisions based on information on this website.

It was a nice change today seeing the market open lower and fight back all day to close on the upside at 13,442.5 up 17.64 on the Dow, and 2,602.18, up 1.12 on the Nasdaq. I will take any of these gains! Next week will likely also be a bit volatile with the Fed meeting on Tuesday and finding out what Bernanke and company have decided to do about interest rates.
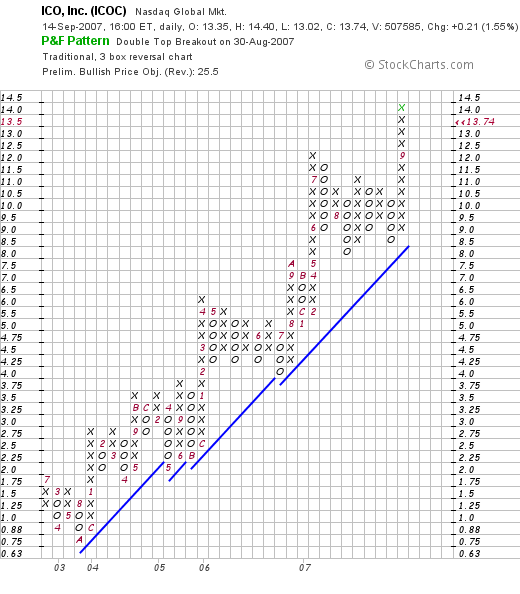
Earlier today I was scanning the list of top % gainers on the Nasdaq and came across a new name for me ICO Inc. (ICOC) which closed today at $13.74, up $.21 or 1.55% on the day. (The stock was on the top % gainers list earlier in the day when I examined the company, later in the day the stock dropped off the list but still closed up.) I do not own any shares or options of this stock, but was impressed enough to purchase 50 shares for one of my children in their custodial account an
ICO INC. (ICOC) IS RATED A BUY
Let me review this company with all of you and share with you why I think this company deserves your consideration.
What exactly does this company do?
 According to the Yahoo "Profile" on ICOC, the company
"...together with its subsidiaries, manufactures specialty resins and concentrates, and provides specialized polymers processing services. It offers specialty resins in powder form, which are used in the manufacture of household items, such as toys, household furniture, and trash receptacles; automobile parts; agricultural products, such as fertilizer and water tanks; paint; and metal and fabric coatings. The company also provides toll processing services, including ambient grinding, jet milling, compounding, and ancillary services for polymer resins produced in pellet form and other materials. Its concentrate products are primarily used by third parties to produce plastic films."
How did they do in the latest quarter?
On August 7, 2007, ICO, Inc. reported 3rd quarter 2007 financial results. For the quarter ended June 30, 2007, revenue came in at $113.4 million, up $30.9 million or 38% from the prior year results. Operating income for the quarter came in at $9.0 million, up 51% from last year's results. Income from continuing operations came in at $5.6 million, up 37% from last year's $3.5 million or $.20/diluted share up over 50% from the $.13/diluted share last year.
What about longer-term results?
Reviewing the Morningstar.com "5-Yr Restated" financials on ICOC, we can see that revenue came in at $181 million in 2002 and has been steadily increasing to $324 million in 2006 and $382 million in the trailing twelve months (TTM). Earnings dipped from $1.10/share in 2002 to a loss of $(2.00)/share in 2003, breaking even at $.00/share in 2004 then increasing to $.10/share in 2005, $.40/share in 2006 and $.60/share in the TTM. During this time the outstanding shares increased by about 10% from 24 million in 2002 to 26 million in 2006. During this same time period, revenue essentially doubled.
Free cash flow which was $(1) million in 2004 and 2005, turned positive at $5 million in 2006 and $9 million in the TTM.
The balance sheet looks solid with $4 million in cash and $141 million in other current assets for a total of $145 million in current assets. When compared to the $96.3 million in current liabilities, this yields an acceptable current ratio of 1.51.
What about valuation?
Checking Yahoo "Key Statistics" on ICOC, we can see that this is a small cap stock with a market capitalization of only $360.51 million. The trailing p/e is a reasonable 23.02, with a forward p/e of only 17.62. There is no PEG ratio but certainly with the current earnings growth of over 30% and the current p/e of 23, the PEG might well be close to or under 1.0 (assuming growth persisted the next five years.) As is not unusual in these small cap stocks, there likely are no analysts making 5-yr earnings predictions which are required to calculate a PEG.
Using the Fidelity.com eresearch website, we can see that ICOC has a Price/Sales (TTM) ratio of 0.92, well under the industry average of 2.00. In addition, the company is more profitable than similar companies in the same industry as they are reported to have a Return on Equity (TTM) of 27.44%, double the industry average of 13.88%.
Finishing up with Yahoo, we can see that there are only 26.24 million shares outstanding with 24.24 million of them that float. As of 8/10/07, there were 203.5 thousand shares out short representing a short ratio of only 0.6 trading days of volume. No dividend is paid, and the last stock dividend was a reverse 1:5 split on June 16, 1993.
What about the chart?
If we review the "Point & Figure" chart on ICO Inc. from StockCharts.com, we can see a very strong price chart dating back to October, 2003, when the stock was trading as low as $.75/share. since then the stock has been moving steadily higher bouncing off the support line time after time to move higher. This is, from my amateur perspective, a very strong price chart.
Summary: What do I think?
Well, I really like this stock. It isn't that I like Polymers :), but seriously, I like the numbers, I like the price chart, and I like the latest quarter's earnings. No matter what they do. That is what makes me interested in a stock. It is rather small, and may well trade more unpredictably than a larger cap stock, but I don't see much that I don't like.
In fact I liked this stock enough to buy 50 shares for one of my kids. But I didn't buy any for my own Trading Portfolio. I just don't have a buy signal :). But then again, that's a whole different story! Anyhow, it is worth a place in the blog, and it shall be part of my "trading vocabulary" of stocks that I believe should be considered when those buying opportunities arise.
Thanks again for visiting! If you have any comments or questions, please feel free to leave them on the blog or email me at bobsadviceforstocks@lycos.com. If you get a chance, be sure and visit my Stock Picks Podcast Website, where you can download some mp3's and hear me talk about some of the stocks I write about. In addition, check out my Covestor Page where my actual trading portfolio is monitored and analyzed by that website, and my SocialPicks page where my stock picks for the last 9 months have been evaluated and my performance measured by the SocialPicks people!
Have a great weekend everyone!
Bob
Wednesday, 12 September 2007
An Interview With Yours Truly on WallSt.Net!
Hello Friends! I really enjoyed discussing blogging and my experience with  this blog with Dennis Olson from WallSt.Net on his podcast. You can view the interview description here, or if you prefer you can download the interview here.
It is fun to be the subject of a podcast for a change!
I hope you all are surviving this turbulent market in one piece!
Bob
Monday, 10 September 2007
LKQ Corporation (LKQX)
Hello Friends! Thanks so much for stopping by and visiting my blog, Stock Picks Bob's Advice! As always, please remember that I am an amateur investor, so please remember to consult with your professional investment advisers prior to making any investment decisions based on information on this website.
 I was looking through the list of top % gainers on the NASDAQ today and came across a new name that I wanted to share with all of you. LKQ Corporation (LKQX) which as I write is trading at $30.34, up $1.65 on the day for a gain of 5.75%. I do not have any shares or options on this stock.
LKQ CORPORATION (LKQX) IS RATED A BUY
Let's take a closer look at this stock and I will explain to you why I wish to add it to the blog.
What exactly does this company do?
According to the Yahoo "Profile" on LKQ, the company
"...together with its subsidiaries, provides replacement systems,  components, and parts to repair light vehicles in the United States. It provides recycled original equipment manufacturer (OEM) products and related services. The company's products include engines, vehicle front end assemblies, doors, transmissions, trunk lids, bumper assemblies, wheels, head and tail lamp assemblies, mirrors, fenders, and axles; and aftermarket products comprising head lamps, tail lamps, grilles, hoods, and mirrors. It also engages in refurbishing and distributing aluminum alloy wheels, head lamps, and tail lamps."
How did they do in the latest quarter?
On July 26, 2007 LKQ (LKQX) announced 2nd quarter 2007 results. For the quarter ended June 30, 2007, revenue increased 19.6% to $233.3 million, up from $195.0 million for the same quarter the prior year. Since the company has been involved with acquisitions, the report notes what is called organic revenue growth of 10.5%.
Net income came in at $14.0 million, up 20.2% from the $11.7 million reported in the same quarter last year. On a per share basis, this was $.25/share for the quarter vs. $.21/share last year.
The company beat expectations of the analysts per Thomson Financial, they had been predicting $.24/share and revenue of $232.8 million. In addition, the company raised guidance for 2007 to a profit of $56 to $58 million or $.99/share. The company had previously predicted a profit of $.97/share. Analysts expect a profit of $.97/share for the year.
A strong earnings reports that beats expectations and find the company raising guidance is about all an investor could hope for in an announcement!
What about longer-term results?
Reviewing the Morningstar.com "5-Yr Restated" financials, we can see that revenue has steadily grown since 2002 when they reported $287 million in revenue through 2006 at $789 million and $871 million in the trailing twelve months (TTM).
Earnings have just as steadily improved from a loss of $(1.00) in 2002 to a profit of $.40/share in 2003, dipping to $.20/share in 2004, then increasing to $.60/share in 2005, $.80/share in 2006 and $.90/share in the TTM.
Shares outstanding have increased somewhat from 42 million in 2005 to 53 million in 2006.
Free cash flow has been positive and generally increasing with $-0- reported in 2004, $11 million in 2005, $16 million in 2006 and $15 million in the TTM.
The balance sheet appears solid with $9 million in cash and $218 million in other current assets. This is plenty to cover the $66.1 million in current liabilities resulting in a current ratio of 3.43. In addition, the company reported another $142.7 million in long-term liabilities.
How about valuation?
Referring to the Yahoo "Key Statistics" on LKQ Corp, we find that this is a mid-cap stock with a market capitalization of $1.59 billion. The trailing p/e is a tad rich at 32.92, with a forward p/e of 23.15. The PEG ratio is still acceptable at 1.49.
Valuation-wise, the stock is a bit richly priced with a Price/Sales (TTM) ratio of 1.76 compared to the industry average of 0.89 per Fidelity.com eresearch website.
The company is also a little less profitable than its peers with a Return on Equity (TTM) of 12.28% compared to the industry average of 15.70%.
Finishing up with Yahoo, we can see that there are 53.70 million shares outstanding with 45.61 million that float. As of August 10, 2007, there were 8.03 million shares out short representing 7.9 trading days of volume (the short ratio). This is in excess of my '3 day rule' and may well be a significant factor in any subsequent price rise pending release of positive news.
No dividends are paid and the last stock split was a 2:1 stock split a year ago on January 17, 2006.
What does the chart look like?
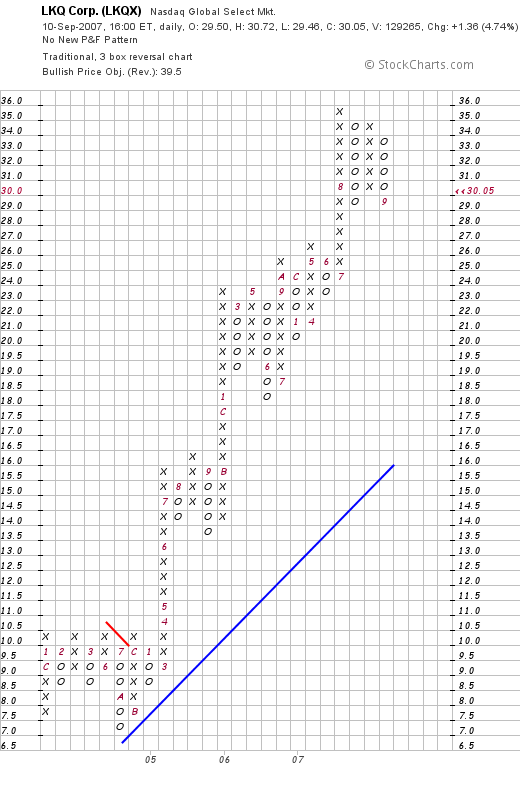
Checking a "point & figure" chart from StockCharts.com on LKQ Corp., we can see an incredibly strong price move from as long ago as July, 2004, when the stock briefly dipped down to the $7.00 level. After breaking through resistance in December, 2004, at $10.00, the stock has moved steadily higher to the current range of $30.05. The graph certainly looks good to me!
Summary: What do I think?
This is a very intriguing stock. I do not own any shares but if I were buying anything today, this is the kind of stock I would be purchasing! They had a terrific quarter that beat expectations, they have been growing their company steadily for the last 4 years or so, and valuation is o.k. at least insofar as p/e and PEG goes. In addition, there are a lot of shares out short on the stock leading to some pent up buying demand down the road assuming they can continue to report good news.
On the negative side, the Price/Sales and the Return on Equity figures were indeed a bit anemic. However, with the strong price chart, and even the 'Peter Lynch' factor of rebuilt auto parts being a recession play (?) (don't you think people will tend to repair their old cars rather than buying new ones if the economy is weak?), this stock is worth a place in the blog.
Thanks again for stopping by and visiting! If you have any comments or questions, please feel free to place them right on the website. If you would like, you are more than welcome to email me at bobsadviceforstocks@lycos.com. Of course, I shall do my best to remove any spam from comments, but as long as the comment is pertaining to the entry, you needn't worry about agreeing with me :).
If you get a chance, be sure and visit my Stock Picks Podcast Website. Also, consider stopping by and visiting my Covestor Page where Covestor evaluates and reports on the performance of my actual Trading Portfolio (since June, 2007), and my SocialPicks page where SocialPicks evaluates my stock picking of all of my selections since about January, 2007.
Now THAT should keep you busy! Have a great day everyone!
Bob
Sunday, 9 September 2007
Air Methods (AIRM) "A Reader Suggests a Stock"
Hello Friends! Thanks so much for stopping by and visiting my blog, Stock Picks Bob's Advice! As always, please remember that I am an amateur investor, so please remember to consult with your professional investment advisers prior to making any investment decisions based on information on this website.
 One of the great things about writing this blog is receiving emails and comments from readers and fellow investors. There are a lot of bright and observant people out there. Many with ideas and thinking ahead of my own. It is just perhaps that I like to write better than they do :). They are probably too busy making money!
Anyhow, one of my most loyal readers and letter writers is Doug S. who has peppered me with frequent emails. And he has LOTS of great ideas an comments. And I promise you Doug that I read them all. I just cannot write up all of your comments :). Doug did find an interesting company which I cannot tell you whether he owns any shares or not because I just don't know. Let's always assume that whenever somebody writes about a stock, they own shares.
 Anyhow Doug wrote:
"Check out AIRM as this is definitely
your kind of stock."
Let's take a brief look at Air Methods, and I think you will see that Doug is correct. In light of all of this,
AIR METHODS (AIRM) IS RATED A BUY
What do they do?
According to the Yahoo "Profile" on Air Methods, the company
"...provides air medical transportation services and systems in the United States. It operates in three segments: Community-Based Model, Hospital-Based Model, and Products."

Latest quarter?
On August 9, 2007, AIRM reported 2nd quarter 2007 results. Revenue climbed 16% to $90.7 million, net income grew 105% to $7.8 million or $.63/diluted share up from $3.8 million or $.31/diluted share the prior year.
Longer-term?
The Morningstar.com "5-Yr Restated" financials on AIRM are solid from my perspective. That means steady revenue growth, steady earnings improvement, relatively steady shares, positive free cash flow, and a solid balance sheet.
Valuation?
Looking at Yahoo "Key Statistics" on AIRM, we can see that this is a small cap stock with a market capitalization of $509.65 million. The p/e isn't bad at 23.69, the forward p/e is better at 18.39, and the PEG is nice at 1.06. There are 11.89 million shares outstanding with 9.18 million that float. As of 8/10/07, there were 1.37 million shares out short representing 11.4 trading days of volume. This is more than my '3 day rule' of significance, so this could have some bullish effects if ever there is any news reported as shorts could be squeezed.
The company doesn't pay a dividend and the last stock split was April 7, 1992, when the stock had a reverse split of 1:6.
Valuation-wise, using the Fidelity.com eresearch website, we can see that the stock trades at a Price/Sales ratio (TTM) of 1.49, compared to an industry average of 1.80. The company also appears to be slightly more profitable, at least as measured by the Return on Equity (TTM), coming in with a 20.06% figure, compared to the industry average of 17.04%.
And the Chart?
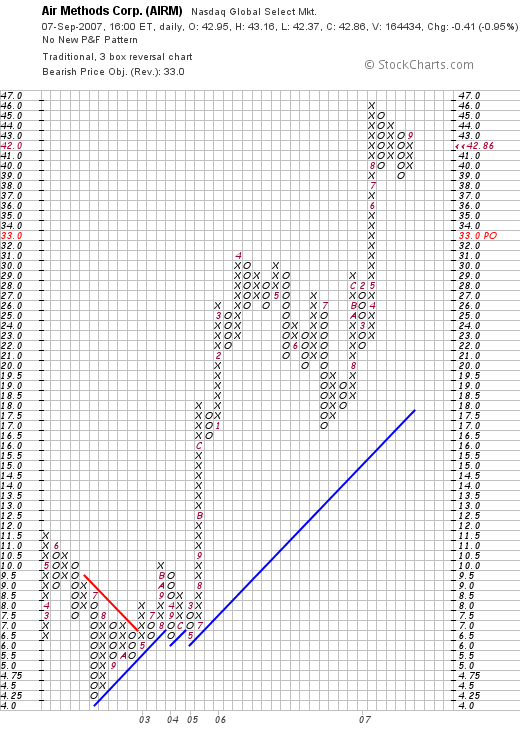
Looking at the "point & figure" chart on Air Methods from StockCharts.com, we can see an impressive price chart with the stock, after declining to a low of $4.25 in July, 2002, broke through resistance at $6.50 in May, 2003, and hasn't looked back yet. The stock has had a small amount of recent consolidation in price, but clearly shows great strength trading well above the support line.
What do I think?
I think Doug has indeed found one of 'my kind of stocks'! The quarterly report was strong, the Morningstar page was solid, valuation is reasonable, and there are even a bunch of short-sellers betting against the company. Finally the chart looks great as well. Everything is there except for a signal to be buying the stock.
For me I wait until my own portfolio generates a buy signal and the stock I am interested in appears on the top % gainers list on the day I wish to buy something. This really does limit my choices.
But I shall be keeping this one in my "vocabulary" of stocks and wouldn't be surprised to find an opportunity to pick up shares at some future time. If not, it still is worth a place in the blog!
Thanks again Doug for writing in and providing me with such a great stock to examine! I don't own any shares, but if you have indeed taken the plunge, good luck with your purchase. I don't feel too comfortable about the investing climate at this time, but I am always on the lookout for new names and new stocks to be monitoring!
If you have any comments or questions, please feel free to leave them on the blog or email me at bobsadviceforstocks@lycos.com. As I have been reminding everyone, if you get a chance, drop by my Stock Picks Podcast Website where you can hear me discuss some of the many stocks I have been writing about here on the blog---and maybe even hear me recite a favorite poem :). Also, be sure and visit my Covestor Page wherre Covestor has been tracking my actual Trading Portfolio since June, 2007. And my SocialPicks page where SocialPicks has been monitoring all of my stock picks since January, 2007, and evaluating my accuracy in picking stocks!
Wishing you all a healthy week ahead for both your financial as well as your medical well-being!
Bob
Posted by bobsadviceforstocks at 4:22 PM CDT
|
Post Comment |
Permalink
Updated: Sunday, 9 September 2007 8:22 PM CDT
"Looking Back One Year" A review of stock picks from the week of March 20, 2006

Hello Friends! Thanks so much for stopping by and visiting my blog, Stock Picks Bob's Advice! As always, please remember that I am an amateur investor, so please remember to consult with your professional investment advisers prior to making any investment decisions based on information on this website.
Once again it is the weekend! And that means that is time for me to review some of the past stock picks from this website. Since I have missed some of these weekend reviews, the 'looking back a year' part, really ought to read 'looking back 1 1/2 years!'. Because I am now about 18 months out from our reviews. Whatever.
As I have pointed out more than once, these reviews assume a 'buy and hold' approach to investing. I do this for the ease of analysis. In reality I advocate and practice a disciplined portfolio management strategy that requires me to sell my losing stocks quickly and completely and my gaining stocks slowly and partially. Certainly this difference in strategy would lead to different returns for an investor.
Last weekend I reviewed all of the stocks selected from the week of March 13, 2006. Let's move ahead a week and look at this blog during the week of March 20, 2006.
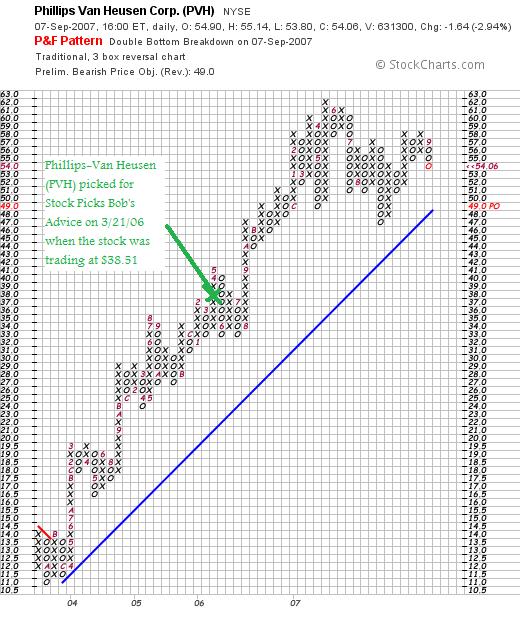
 On March 21, 2006, I posted Phillips-Van Heusen (PVH) on Stock Picks Bob's Advice when it was trading at $38.51. PVH closed at $54.06 on September 7, 2007, for a gain of $15.55 or 40.4% since posting.
On August 22, 2007, Phillips-Van Heusen reported 2nd quarter 2007 results. For the quarter ended August 5, 2007, total revenue came in at $522.4  million, up from $458.9 million in the same quarter last year. Net income was $39.1 million or $.68/share, beating its own guidance by $.07/share. This was a 28% increase over second quarter 2006 'non-GAAP' earnings per share of $.53. (Second quarter GAAP net income was reported at $29.0 million or $.33/share). In the same report the company also raised guidance for 2007 earnings to a range of $3.15 to $3.17/share from the previous guidance of $3.06 to $3.10.
The Morningstar.com "5-Yr Restated" financials on PVH are intact.
PHILLIPS-VAN HEUSEN (PVH) IS RATED A BUY
The 'point & figure' chart on PVH from StockCharts.com shows the strength of the price chart even with the recent volatility in the stock market.

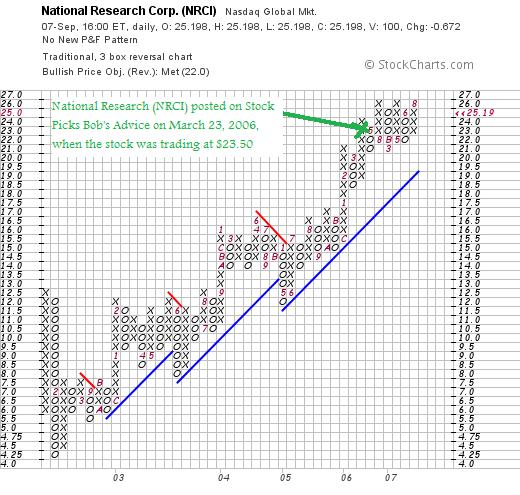
On March 23, 2006, I posted National Research Corp (NRCI) on Stock Picks Bob's Advice when the stock was trading at $23.50/share. NRCI closed at $25.20 on September 7, 2007, for a gain of $1.70 or 7.2% since posting.
On August 7, 2007, National Research Corporation reported 2nd quarter 2007 results. For the quarter ended June 30, 2007, revenue increased 12% to $11.9 million from $10.7 million last year. Net income climbed 24% to $1.6 million from $1.3 million last year. Diluted earnings per share were up 21% to $.23 from $.19/diluted share the prior year.
Except for a slight excess of Current Liabilities over Total Current Assets, the Morningstar.com "5-Yr Restated" financials on NRCI are intact.
NATIONAL RESEARCH CORPORATION (NRCI) IS RATED A BUY
Examining the "point & figure" chart on NRCI from StockCharts.com, we can see the rather impressive trading history of this company with little weakness evidenced since dipping to $4.25 in February, 2002.
Summary: How did I do with the stock picks from the week of March 20, 2006? In a word, great! Only two stocks were selected, and in spite of the recent weakness in the market, these stocks both represent appreciation from their 'pick price' for an average gain of 23.8%. I did not buy or own shares in either of these companies. Please remember that past performance is no guarantee of future price appreciation.
Thanks again for stopping by and visiting my blog! If you have any comments or questions, please feel free to leave them right on the website or email me at bobsadviceforstocks@lycos.com. If you get a chance, be sure and visit my Stock Picks Podcast website where I discuss many of the same stocks I write about here on the blog. In addition, check out my Covestor Page where Covestor monitors my actual Trading Portfolio so you can see what I actually own and how I am doing. Covestor has been only up and in business since about June, 2007, so there are only a few months represented on the site.
In addition, I am happy to be participating in SocialPicks and if you visit my SocialPicks page, you will see what that website says about my picking skills. They keep track of every one of my selections (since about January, 2007), and determine my performance as well.
There, THAT should keep you busy :).
Have a great week trading everyone.
Bob
Posted by bobsadviceforstocks at 2:03 PM CDT
|
Post Comment |
Permalink
Updated: Sunday, 9 September 2007 4:01 PM CDT
Thursday, 6 September 2007
Abercrombie & Fitch (ANF) "Revisiting a Stock Pick"
Hello Friends! Thanks so much for stopping by and visiting my blog, Stock Picks Bob's Advice! As always, please remember that I am an amateur investor, so please remember to consult with your professional investment advisers prior to making any investment decisions based on information on this website.
 It is always nice to see an 'old pick' make the lists on the top % gainers and continue to perform well.
Looking through the list of top % gainers this morning, I came across an 'old favorite' of mine, Abercrombie & Fitch (ANF) which as I write is trading at $78.49, up $1.37 or 1.79% on the day. (As sometimes is the case, the stock as the morning went on is no longer on the list as I write, but being the author of this blog, I always reserve the right to write up a stock that made the list as I was researching the stock but then dropped off the list as other stocks moved higher as well :)) I do not own any shares or options on this stock.
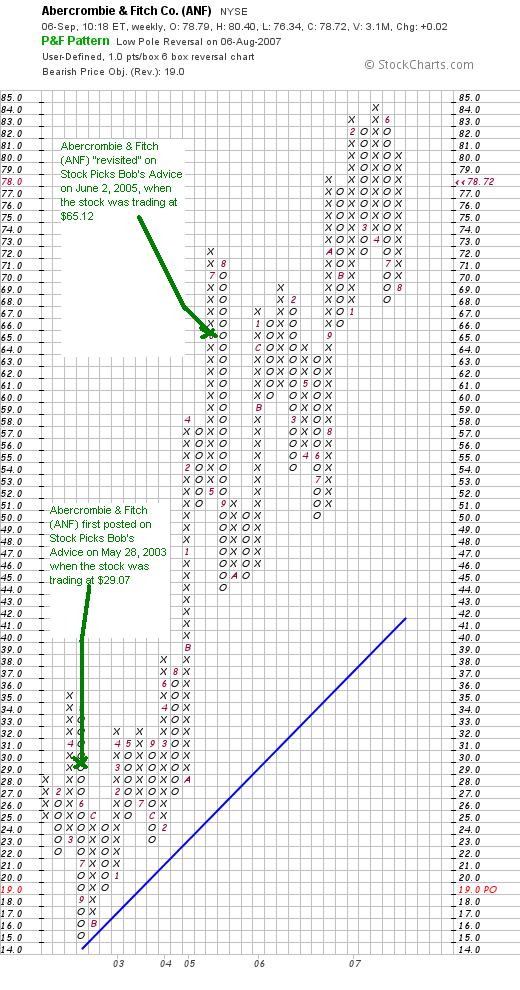
I first wrote-up Abercrombie & Fitch on May 28, 2003, as one of the early entries on this website. At that time the stock was trading at $29.07. I then 're-visited' ANF on June 2, 2005, when the stock had appreciated significantly and was trading at $65.12. Let's take a closer look at ANF and I will explain why
ABERCROMBIE & FITCH (ANF) IS RATED A BUY
What exactly does this company do?
According to the Yahoo "Profile" on ANF, the company
"...through its wholly owned subsidiaries, operates as a retailer of casual apparel for men, women, and kids in the United States. Its stores sell  casual apparel, such as knit shirts, graphic t-shirts, jeans, and woven shirts; and personal care and other accessories under the Abercrombie & Fitch, abercrombie, Hollister, and RUEHL brands. As of March 23, 2007, the company operated 950 stores located in the United States, Canada, and the United Kingdom. Abercrombie & Fitch Co. also sells its products through Web-based stores, as well through a mail order catalogue."
Is there any news to explain today's move?
Well it is the first Thursday of the month. And retailers usually report "same store sales" results the first Thursday. Same store sales are important because they indicate the underlying health of a retail venture. An outfit that rapidly puts up new 'brick and mortar' locations could well cover-up a poor performance with new places to sell goods. This might work over the short run, but long-term growth depends on existing sites continuing to grow the business--thus the 'same store sales results'.
This mornings, shortly before the open of trading Abercrombie & Fitch announced same store sales for August. They came in with terrific results (imho) of a 6% rise in same store sales with overall total sales climbing a strong 21%. It was this news that drove the stock higher in early trading this morning.
What about the latest quarterly results?
On August 22, 2007, Abercrombie & Fitch announced 2nd quarter 2007 results. For the second quarter ended August 4, 2007, net sales increased 22% to $804.5 million, but during the quarter same store sales actually decreased 2%. (Since the latest month indicates at least a temporary change in this sales pattern, I am willing to overlook this less than satisfactory piece of news.) Net income for the quarter was up 24% to $81.3 million and net income per diluted share increased 22% to $.88/share. On an interesting note, the company announced plans for stores in Italy, France, Germany, Spain, Denmark and Sweden, as well as a flagship store in Tokyo in 2009.
Analysts polled by Thomson Financial had been expecting profit of $.87/share on revenue of $795 million. Thus, while the same store sales decline for the quarter was obviously disappointing, the company did manage to beat expectations for the quarter. However, the company also reduced expectations for the second half to a per-share range of $3.63 to $3.67, with full-year results expected now to be between $5.16 to $5.20/share. This is below analysts according to Thomson Financial who had been expecting full-year results at $5.24/share. Certainly the quarterly report was 'mixed' to say the least.
The reduction in estimates was reported to be related to the quarter's flat same store sales results. One could only hope that with this apparent turn-around in same store sales, if this is repeated again next month, we may well see estimates picking up once more.
What about long-term results?
Reviewing the Morningstar.com "5-Yr Restated" financials on ANF, we can see that the revenue growth has been impressive the last several years with revenue reported at $1.6 billion back in 2003 (the time of my first blog entry), increasing to $3.3 billion in 2007 and $3.4 billion in the trailing twelve months (TTM).
Earnings have also steadily increased from $1.90/share in 2003 to $4.60/share in 2007 and in the TTM. The company is first reported to pay a dividend at $.60/share in 2006 and increased it to $.70/share in 2007.
Nicely, the outstanding shares are reported at 93 million in 2005, decreasing to 87 million in 2006 and 88 million in 2007. It isn't often that we can find relatively rapidly growing companies that manage to retire shares instead of diluting investors with additional shares issues to fuel their growth.
Free cash flow is positive, but the trend downwards is a little bit concerning. The company is reported to have had $239 million in free cash flow in 2005, $197 million in 2006 and $179 million in 2007. The trailing twelve months is reported to show $99 million in free cash flow. This decrease isn't much of a concern as operating cash flow during this period showed a steady increase but the company is spending considerable amounts of money on Capital Spending, presumably for expansion of the retail line.
The balance sheet also looks solid with $74 million in cash and $817 million in other current assets. This total of $891 million in current assets could easily 'pay off' both the $372 million in current liabilities as well as the $368.7 million in long-term liabilities combined. The current ratio works out to a healthy 2.40.
What about some valuation numbers?
Reviewing Yahoo "Key Statistics" on Abercrombie & Fitch (ANF) we find that this is a mid cap stock with a market capitalization of $6.86 billion. The trailing p/e is a reasonable (imho) 16.33 with a forward p/e even nicer (fye 03-Feb-09) of 13.07. With the rapid growth and the reasonable p/e, we end up with a PEG that is also very attractive from a GARP evaluation at 0.96.
Using the Fidelity.com eresearch website, we can see that the Price/Sales (TTM) ratio is a bit rich at 1.91, relative to the industry average of 0.97. In terms of profitability, ANF comes out a little better with a Return on Equity (TTM) of 32.15%, ahead of the industry average of 25.59%.
Finishing up with Yahoo, we see that there are 88.07 million shares outstanding with 80.38 million that float. As of August 10, 2007, there were only 5.18 million shares out short which represent 6% of the float or only 2.3 trading days of volume (the short ratio). Using my own '3 day rule' for significance, this doesn't appear to be a large number of shares out short suggesting less of a possibility of a short squeeze as good results are reported.
As I noted above, the company pays a small dividend of $.70/share yielding 0.9%. The last stock split was a 2:1 split back in June, 1999.
What does the chart look like?
If we review a long-term 'point and figure' chart on ANF, we can see that the stock has relatively steadily appreciated in value since dipping to a low of $15 back in September, 2002. Since last October, the stock has been trading in a relatively broad range between $67 and $85, but appears, nevertheless, to be steadily appreciating in price.
Summary: What do I think about this stock?
Needless to say I like this stock a lot. It has even the Peter Lynch attractiveness of being something 'your daughter found in the mall'! In the midst of the relatively uneven consumer-driven economy, Abercrombie appears to be able to continue to grow its brand with increasing same store sales and has plans to export the brand further to Europe and Japan.
The latest monthly report out today was very encouraging in face of a relatively pessimistic quarterly report just out a few weeks ago. The Morningstar.com report is solid, valuation is excellent and the chart appears to be steadily appreciating without much over-extension of the price move.
Unfortunately, I still don't own any shares :(. And I am not in the market for buying any stock today anyhow. I don't have one of my 'signals' to purchase anything. However, if I were buying a stock, this might well be one I would be buying today. Meanwhile, I shall keep it in my "vocabulary" of 'investable' stocks for future reference!
Thanks so much for visiting! If you have any comments or questions, please feel free to leave them on the blog or email me at bobsadviceforstocks@lycos.com. If you get a chance, be sure and visit my Stock Picks Podcast Website. For further information on the performance of my actual Trading Portfolio, be sure and visit my Covestor Page. If you would like to see a third party evaluation of my stock picks since January, 2007, then drop by and visit my SocialPicks page!
There! I have given you lots of homework already. You too can feel like you are starting school once again. And for all of the students who do read my blog, here is an apple for you for your teacher!
Regards!
Bob
Posted by bobsadviceforstocks at 12:34 PM CDT
|
Post Comment |
Permalink
Updated: Thursday, 6 September 2007 1:54 PM CDT
Tuesday, 4 September 2007
Stock Picks Bob's Advice participates in more Carnivals!
Believe it or not, I am not as technologically and blog sophisticated as some of my fellow bloggers! I am participating in a couple of "Carnivals" which you might wish to visit which consist of entries from other bloggers on similar topics. Here is a great carnival puzzle picture I found on the net.

I am participating in the Carnival of Everything Finance which just got published and last week in the 3rd Carnival of Securities. Drop by and let them know 'Bob sent you!'.
Have a great day trading everyone!
Bob
Posted by bobsadviceforstocks at 9:06 AM CDT
|
Post Comment |
Permalink
Updated: Tuesday, 4 September 2007 3:00 PM CDT
Sunday, 2 September 2007
A Podcast on Micros Systems (MCRS)
Click HERE for my podcast on Micros Systems (MCRS).
Bob
Newer | Latest | Older


