Stock Picks Bob's Advice
Sunday, 2 September 2007
Cerner Corp. (CERN) "Weekend Trading Portfolio Analysis"

Hello Friends! Thanks so much for stopping by and visiting my blog, Stock Picks Bob's Advice! As always, please remember that I am an amateur investor, so please remember to consult with your professional investment advisers prior to making any investment decisions based on information on this website.
 As one of my weekend tasks, I try to examine one of my actual holdings every few weeks. Going alphabetically through the list of what is now 15 holdings, I am up to my holding in Cerner (CERN). Two weeks ago I reviewed my holdings in Bolt (BTJ). Let's review my experience with CERN and see if it still deserves a spot in my blog as well as a holding in my Trading Portfolio!
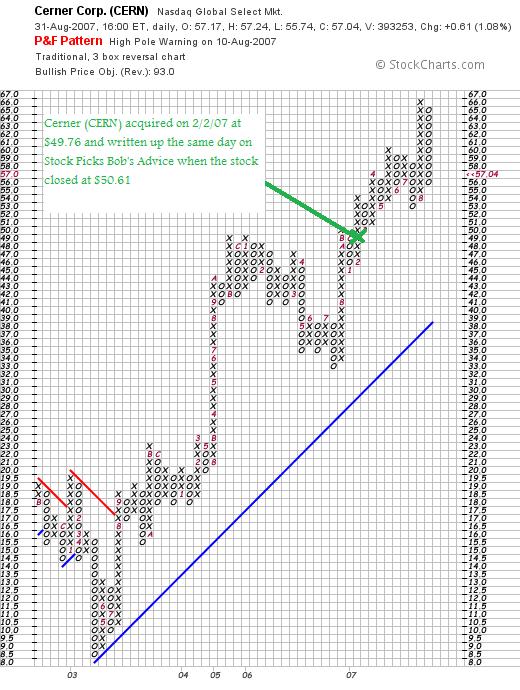
Currently I own 120 shares of Cerner which were acquired 2/2/07 at a cost basis of $49.76. I have not sold any shares from my original purchase. Cerner closed at $57.04 on August 31, 2007. This represents a gain of $7.28 or 14.6% since my purchase of these shares.
At what price would I sell shares?
There are always at least two situations in which I will sell my shares. That is if they appreciate on the upside to a targeted level then I plan on selling 1/7th of my shares. On the downside, if they hit a targeted depreciation level, then I plan on selling all of my shares. Since I have not sold shares yet, my first sale on the upside would be at a 30% appreciation level at which time I would sell 1/7th of my 120 shares or 17 shares if the stock hits 1.3 x $49.76 = $64.69. On the downside, again since I have yet to sell any shares on the upside, my 8% loss limit still applies, meaning that if the stock should decline to .92 x $49.76 = $45.78, then all of my 120 shares would be sold.
As is my plan, sales on the upside are signals to add new positions assuming under the maximum number of positions planned; sales on the downside direct me to 'sit on my hands' with the proceeds.
How did they do in the latest quarter?
On July 24, 2007, Cerner announced 2nd quarter 2007 results. Revenue came in at $386.6 million, up from $330.6 million last year. Earnings were $31.1 million or $.37/share, up 30% from $23.9 million or $.29/share last year. "Adjusted" per share earnings came in at $.41 vs $.33/share last year.
The company met expectations on earnings at $.41/share. They exceeded analysts' expectations of revenue of $376 million.
In addition, the company raised its guidance for 2007 from $1.72/share on revenue of $1.54 to $1.57 billion up to $1.72 to $1.73/share on revenue of $1.55 to $1.57 billion. This is in line with analysts' expectations of earnings of $1.73/share on revenue of $1.56 billion.
What about longer-term results?
Reviewing the Morningstar.com "5-Yr Restated" financials on CERN, we find that the steady revenue growth from $.8 billion in 2002 to $1.4 billion in 2006 and $1.5 billion in the trailing twelve months (TTM) remains uninterrupted. Earnings have continued to steadily increase except for a dip in 2003, from $.70/share in 2002 (to $.60/share in 2003), $.90/share in 2004, $1.30/share in 2006 and $1.50/share in the TTM.
Free cash flow is positive albeit not especially growing at $112 million in 2004, $101 million in 2006 and $62 million in the TTM.
The balance sheet on Morningstar.com is solid with a current ratio over 2.0.
What does the chart look like?
Looking at a "point & figure" chart on Cerner from StockCharts.com, we can see a beautiful graph of Cerner stock which dipped from $19.50 in January, 2003, to a low of $8.50 in April, 2003, before breaking through resistance at $17.50 and moving steadily higher since that time.
In light of the solid earnings report, the continued strength in the Morningstar.com evaluation, and the chart staying well above support levels,
CERNER (CERN) IS RATED A BUY
Summary: What do I think?
Well, as the last note above recorded, I am still impressed with the consistency of this company, the steady revenue and earnings growth, the solid Morningstar.com financials and the strong chart. I am happy to be owning this stock but of course shall be following my own sell strategy as this stock either continues to climb or corrects!
Thanks again for stopping by and visiting! If you have any comments or questions please feel free to leave them on the blog or email me at bobsadviceforstocks@lycos.com. If you get a chance, be sure and visit my Stock Picks Podcast Website, my Covestor page where my trading portfolio is reviewed, and my SocialPicks page where all of my "picks" are reviewed since January, 2007.
Have a great Labor Day everyone!
Bob
Dicks Sporting Goods (DKS) "Long-Term Review #11"

Hello Friends! Thanks so much for stopping by and visiting my blog, Stock Picks Bob's Advice! As always, please remember that I am an amateur investor, so please remember to consult with your professional investment advisers prior to making any investment decisions based on information on this website.
For those of you who may be new to this blog, I try to accomplish many different task. For me, I use this blog to refine my own thinking and develop my own discipline in investing, including buying and selling stocks, and managing my own trading portfolio. I write about individual equities that I find attractive, share with you thoughts on portfolio management, and also write about my own stock portfolio, letting you know what I own, when I buy and sell stocks, and why I do what I do!
This blog dates back to May 12, 2003, when I first posted about St Jude Medical. Since that time, I have made nearly 1,600 entries about stocks, stock trades, and investing philosophy. I hope that you take the time to look through these entries and you can find links to them along the left side of each page on my blog linked to by date. I know that there isn't a very good index system at all here. In fact, when I go to look for my own entries I find myself using Google, and will find a past stock pick, such as Dicks by searching the terms "Stock Picks Bob's Advice" Dicks Sporting Goods. In that way, you will find most of my entries as well as related entries such as my Podcast and websites that carry my blog or podcasts as well. It does get very confusing sometimes :).
 With the large number of stocks I have discussed on this blog, some time back I decided to do my "Looking Back One Year" reviews which now are reviewing stocks from about 18 months earlier. However, that still leaves an older bunch of stock picks that should be revisited. For this I started the Long-Term Review entry, and try, as often as I can get a chance, to go sequentially through my older entries. As you can see, I am just up to #11, Dicks Sporting Goods. On August 18, 2007, I reviewed New Century Financial; let's take a look at a more successful stock pick, Dick Sporting Goods, that I originally wrote up on May 22, 2003.
On that date I wrote:
"May 22, 2003
Dicks Sporting Goods (DKS)
When the market is strong, more of our kind of stocks come to the fore. Is that a proper word? Anyhow, DKS is a relatively recent issue...came public recently. I do NOT own any shares of this anywhere....I do have a managed account that COULD own shares of anything....but don't own this one.
DKS is trading today (10:04 am) and $29.75, up $1.62 or a 5.76% rise. The graph is beautiful...and appears to have come public in mid-October, 2002. Stock has moved up fairly steadily from about $14 to its current price of $29.75.
They are making an additional move today as they announced that they will discuss their first quarter 2003 results today after the close of the market. It appears that the 'street' thinks that there will be positive comments made.
For the last quarter ending 2/1/03, revenues rose 18% to 1.27 Billion. Net income rose 63% to $38.3 Million. This was due to solid increased comparable store sales and the opening of seven new stores. I believe the same store sales were up in the 5% range.
Looking at Morningstar we see sequential annual revenue growth from 0.6 billion in 1998, $0.6 billion in 1999, 0.7 billion in 2000, $0.9 billion in 2001, and $1.1 billion in 2002. Unfortunately, Morningstar suggests that the company is still burning through some cash and is $20 million NEGATIVE cash flow the trailing twelve months.
Anyhow, that is it for pick #2 today. Good luck and remember those 8% stops and when things get good, peel a little off each 50% gain....Bob"
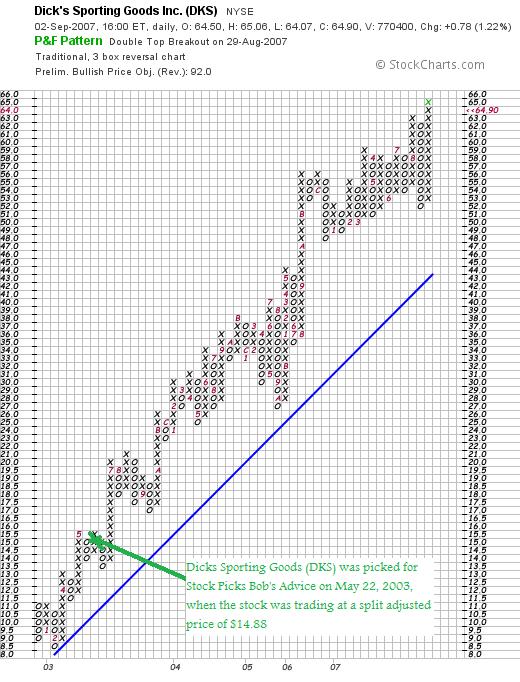
This was probably one of my best stock picks from those early days in the blog. Dicks had a 2:1 stock split on April 6, 2004, making my effective stock pick price actually $14.88. DKS closed at $64.90 on August 31, 2007, giving that pick (I do not own any shares of DKS) a gain of $50.02 or 336.2% since posting!
DICKS SPORTING GOODS (DKS) IS RATED A BUY
Let's take a look at a few of the things I like to review on stocks in the blog.
Is there any recent news that could affect the stock price?
Dicks is also a favorite of Motley Fool and they did a nice write-up recently on August 22, 2007.
Ryan Fuhrmann commented:
"The strong third quarter last year is expected to lead to a dip in earnings for the coming quarter, but that is not likely to qualify as a near-term hiccup. That's because Dick's is rarely caught by surprise and has informed investors of what they can expect for the balance of fiscal 2007. For the full year, it is calling for 23% earnings growth, and fiscal 2008 will bring further Golf Galaxy integration upside, as well as the customary new store openings.
 With only 315 namesake stores and 77 Golf Galaxy stores, Dick's has plenty of room to expand. Management plans to grow its store base 15% annually until it reaches 800 stores, implying at least another five years of expansion before any significant market-saturation concerns. Growth investors are likely salivating at these prospects."
I always like writing up a stock that is also liked by as reputable a group of investment writers as the folks at Motley Fool. Sometimes I think my approach is a bit of a cross between the CAN SLIM approach and the Motley Fool philosophy. In any case, they like the stock as well.
What about the latest quarter?
 On August 21, 2007, Dick's Sporting Goods reported 2nd quarter 2007 results. Net sales for the quarter increased 38% to $1.01 billion. More importantly, same store sales for the quarter increased 7.2% (or 5.8% adjusting for a changed retail calendar). Net income grew 87% to $47.9 million and earnings per diluted share were up 77% to $.83 vs $25.7 million or $.47/diluted share the prior year.
The company beat expectations of analysts which had been on average expecting earnings of $.76/share. In addition, the company raised guidance for the full year from $2.40/share to a new estimate of $2.47 to $2.50/share.
It is difficult to read a better earnings report in which strong growth in earnings and revenue is reported, with solid same-store-sales numbers, and raised guidance.
What about longer-term results?
Reviewing the Morningstar.com "5-Yr Restated" financials on DKS, we can see that the revenue growth has been steady the last five years, earnings growth uninterrupted, and while shares have modestly increased from 35 million to 52 million beetween 2003 and 2007, during this time revenue has more than doubled as has earnings. This is acceptable to me.
Free cash flow is positive and recently growing and the balance sheet looks solid.
What about a chart?
Looking at the "point and figure" chart from StockCharts.com, we can see that the steady appreciation in stock price has been almost without break since 2002. Really an extremely strong pattern imho.
Summary: What do I think?
This has been a phenomenal stock pick from 2003! My biggest mistake is now owning shares! Anyhow, the company just reported earnings which beat expectations and they raised guidance. The Morningstar report appears intact and the chart is incredible.
Thanks again for visiting! If you have any comments or questions, please feel free to leave them on the blog or email me at bobsadviceforstocks@lycos.com. Have a great weekend everyone!
Bob
Posted by bobsadviceforstocks at 12:17 PM CDT
|
Post Comment |
Permalink
Updated: Sunday, 2 September 2007 12:33 PM CDT
Saturday, 1 September 2007
"Looking Back One Year" A review of stock picks from the week of March 13, 2006

Hello Friends! Thanks so much for stopping by and visiting my blog, Stock Picks Bob's Advice! As always, please remember that I am an amateur investor, so please remember to consult with your professional investment advisers prior to making any investment decisions based on information on this website.
I hope you all are having a good Labor Day Holiday (for those of you outside the United States, I also wish you a wonderful weekend!).
Always thinking about informing my readers nd learning more myself, I would like to share this commentary about the history of 'Labor Day' in the United States from a PBS NewsHour Production:
 "In September 1892, union workers in New York City took an unpaid day off and marched around Union Square in support of the holiday. But now, protests against President Cleveland's harsh methods made the appeasement of the nation's workers a top political priority. In the immediate wake of the strike, legislation was rushed unanimously through both houses of Congress, and the bill arrived on President Cleveland's desk just six days after his troops had broken the
 Pullman strike.
1894 was an election year. President Cleveland seized the chance at conciliation, and Labor Day was born. He was not reelected.
In 1898, Samuel Gompers, head of the American Federation of Labor, called it "the day for which the toilers in past centuries looked forward, when their rights and their wrongs would be discussed...that the workers of our day may not only lay down their tools of labor for a holiday, but upon which they may touch shoulders in marching phalanx and feel the stronger for it."
For me, and I am sure most of the American readers, Labor Day is now just an excuse for a three day weekend, a picnic trip, or fishing expedition, or perhaps a county fair or parade. It is important to understand the historic origins of the days we celebrate!
Well, one of my 'labors' this weekend (excuse any semblance to a pun), is to examine past stock picks from this blog and find out how they would have worked out if indeed purchased, and how the companies themselves are doing and whether they still deserve a spot on the blog, as I refer to my large 'vocabulary' of stock names.
These reviews assume a 'buy and hold' approach to investing. In fact, I recommend and practice an extremely disciplined approach to ownership of equities that demands that I sell stocks at small losses quickly and also sell portions of appreciating stocks in a slow and deliberate fashion. This difference in strategies would certainly affect performance; however, for the ease of analysis, this 'buy and hold' assumption is retained for this review.
 On March 13, 2006, I posted Stryker (SYK) on Stock Picks Bob's Advice when the stock was trading at $48.07. SYK closed on August 31, 2007, at $66.80, for a gain of $18.73 or 39.0%.
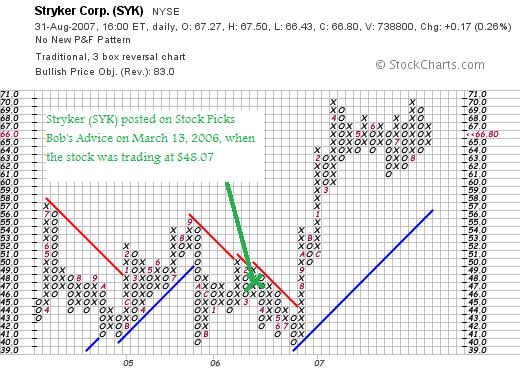
On July 19, 2007, Stryker (SYK) reported 2nd quarter 2007 results. For the quarter ended June 30, 2007, net sales grew 16.0% $1.46 billion. Diluted net earnings per share increased 25.0% to $.65/share. The company beat average expectations of $.61/share on revenue of $1.44 billion. The Morningstar.com "5-Yr Restated" financials are intact.
For all of the above reasons,
STRYKER (SYK) IS RATED A BUY
 On March 15, 2006, I posted LMI Aerospace (LMIA) on Stock Picks Bob's Advice when the stock was trading at $18.01. LMIA closed at $22.86 on August 31, 2007, for a gain of $4.85 or 26.9% since posting.
Here is the "point and figure" chart on LMIA from StockCharts.com:
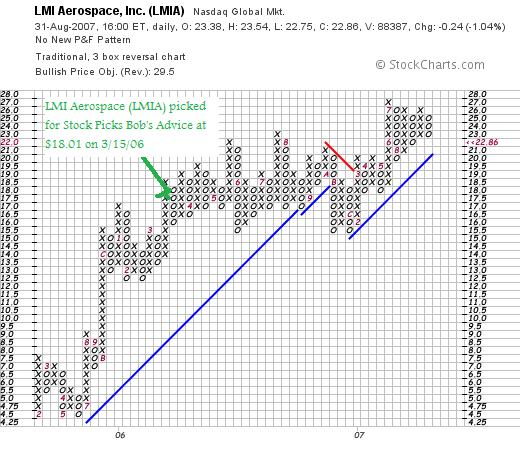
 On August 7, 2007, LMI Aerospace (LMIA) announced 2nd quarter 2007 results. Net sales increased to $33.9 million for the quarter ended June 30, 2007, up 3.6% from $32.8 million the prior year. Net income, however, dropped to $2.9 million from $3.0 million or $.26/diluted share, unchanged from $.26/diluted share the prior year.
The company failed to meet expectations of analysts who had been looking for a profit of $.30/share. More recently, the company lowered estimates on revenue growth for 2007 to a range of 15-19% from the previous estimate of a minimum 18% growth.
Furthermore, examining the Morningstar.com "5-Yr Restated financials on LMI Aerospace we find that besides the dip in earnings, the company turned cash flow negative in 2006 at $(1) million and this dropped further to $(5) million in the trailing twelve months (TTM).
With this relatively weak earnings report that missed expectations, the lowered guidance, and the fundamentals that are less than stellar, I shall be reducing the rating on LMIA and even though the pick was 'profitable',
LMI AEROSPACE (LMIA) IS RATED A SELL
 Finally, on March 17, 2006, I posted Clarcor (CLC) on Stock Picks Bob's Advice when the stock was trading at $35.62. CLC closed at $38.72 on August 31, 2007, for a gain of $3.10 or 8.7% since posting.
Here is the "point & figure" chart on CLC from StockCharts.com:
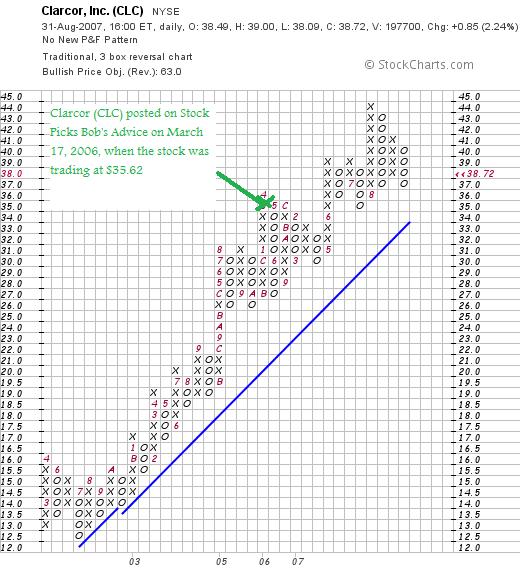
On June 19, 2007, Clarcor (CLC) announced 2nd quarter 2007 results. Net sales increased 3.5% for the quarter ended 6/2/07, to $235.1 million from $227.1 million in the same quarter last year. Earnings grew 28.1% to $.41/diluted share, up from $.32/diluted share last year.
The company slightly missed estimates on revenue, with $235.9 million expected but beat expectations on earnings with analysts looking for $.37/share. The company also raised 2007 guidance to $1.72 to $1.80/share. Analysts had been expecting net income of $1.70/share.
The Morningstar.com "5-Yr Restated" financials page is intact.
With the solid earnings report and the company beating expectations on earnings (although coming in slightly light on revenue), raising guidance, and with an intact Morningstar.com report,
CLARCOR (CLC) IS RATED A BUY
So how did I do picking these three stocks back during the week of March 13, 2006? In a word, great! All three stocks showed gains with the average appreciation being a gain of 24.9% since posting.
Please remember that past performance is no guarantee for future performance and that of course I am an amateur so please consult with your advisers!
In the meantime, please feel free to drop me a line at bobsadviceforstocks@lycos.com if you have any comments or questions or simply post on the blog itself. Also, be sure and visit my Stock Picks Podcast website, my Covestor page where my trading portfolio is monitored, and my SocialPicks page where all of my stock picks since January, 2007, are being followed.
Have a great Labor Day everyone! And a great week trading and investing next week.
Bob
Posted by bobsadviceforstocks at 10:18 PM CDT
|
Post Comment |
Permalink
Updated: Saturday, 1 September 2007 10:20 PM CDT
A Reader Writes "...do you look into trying to time the purchase of your stock?"
Hello Friends! Thanks so much for stopping by and visiting my blog Stock Picks Bob's Advice! As always, please remember that I am an amateur investor, so please remember to consult with your professional investment advisers prior to making any investment decisions based on information on this website.
 I really enjoy receiving emails and visits from readers. I especially enjoy receiving feedback from fellow bloggers like Andrew G. who writes G. Stocks, a blog well worth visiting!
Like so many intelligent readers of my investing methods Andrew finds my timing a little bit suspect. Couldn't there be a better way? Quite frankly, I am sure there are better ways to time things. I just want to try what I have described multiple times as an idiosyncratic system. But let me first get to Andrew's letter and then comment. Andrew wrote:
"Hi Bob, I really enjoy reading your blog. You do a great job analyzing the companies you review. I was wondering if you ever consider picking a stock to purchase, and then sitting on that decision until you see a valley in the stocks price? Your choosing strategy, of picking a top gainer, is a great way to find good stocks, but big gainers tend to always have a correction of some sort. Combine that with your -8% sell point and it seems like your strategy could cause you to sell a bit more then you'd like.
I recently scanned through some of your recent sells, knowing that if you picked the stock, it should be a good one. I took off the list any stocks that had obvious reasons for dropping, and actually ended up purchasing MLAB. I got it while it was round $20.70. This company has good numbers, a lot of potential for growth, and just seems like a well run company. It just seems like you had bad timing when purchasing it (at a peak). What do you think? Are your purchases solely based upon when you have a free pass to do so or do you look into trying to time the purchase of your stock?
Keep up the great blogging!
First of all Andrew I want to thank you for your continued support of my own blogging efforts. As a fellow blogger, you can imagine the time it takes to write up each of my entries. Way too much time lol. But I love doing it just the same. And readers like you make it all worthwhile!
On your question of entry points into stocks, you made a good observation on my awful timing on Mesa Laboratories (MLAB). I really did get whipsawed on that one even though there wasn't anything fundamentally wrong with the stock. But because of my own sale of MLAB on weakness,
MESA LABORATORIES (MLAB) IS RATED A HOLD
For me a sale of a stock when nothing seems wrong means that something is wrong somewhere else besides the stock itself. I do not know if you follow but I use my own portfolio as a 'barometer' of the market itself. Like the canary in the coal mine that historically was used to indicate poor air conditions, my own stock portfolio is what I use to indicate to me that something is rotten in the market itself.
Let's review that MLAB position. Going back in my own portfolio history, I can see that I purchased MLAB on 5/23/07 when the stock was selling at $24.00. I then sold my MLAB shares on 8/14/07 when the stock hit $22.20 triggering my loss limit. I pulled the plug on my share and haven't looked back.
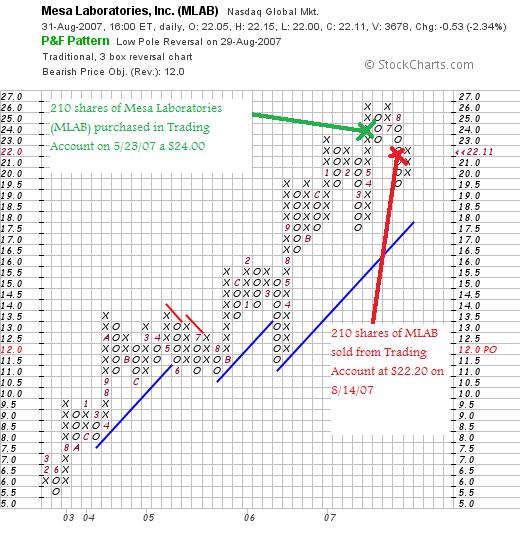
On May 23, 2007, when I purchased my Mesa Labs stock, the
NASDAQ closed at 2,577.05. On August 14, 2007, the NASDAQ had dropped to close at 2,499.12. This was about 78 points lower from the purchase price. It wasn't exactly a rout, but the NASDAQ wasn't exactly acting healthy at that time.
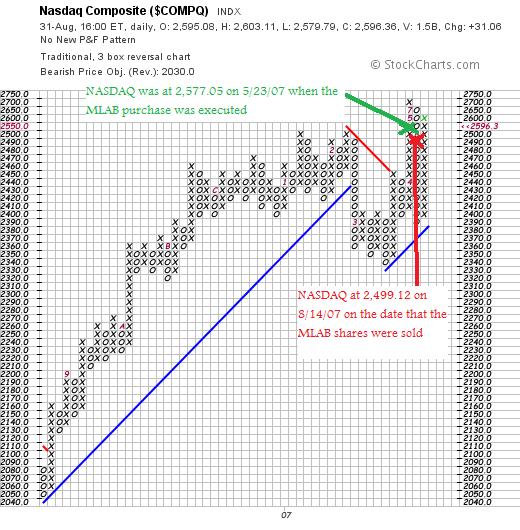
I really don't want to overstate the significance of these charts. I am not sure if they even make the point. But my basic point is that I trust the actions of my stocks. Whenever I think that I am smarter than the market then I really ought to hang it up. I believe strongly in my ability to select what I really think are high quality companies. Without some fundamental information to explain an unexplained drop in a stock, I have to assume there are other factors working on the stock price and I don't second guess. I sell my shares.
This doesn't always work. But it works well enough for me.
Now you asked actually about entry points. You could be right on this one. Probably it is a bit risky to buy them on daily momentum indicators. Many stocks sell off after making a move higher. But then again, after screening through these names, I am only buying the shares of companies with the best characteristics that I have identified over and over again.
A lot of what this blog is about is being successful at investing. Not at necessarily being the most successful of any technique. If I can simply consistently or often stay ahead of the market, then I shall be successful more than a multitude of investors. Anyhow, that's my goal.
Good luck with you MLAB stock! I often revisit stocks after I have sold them when the circumstances are right. However, to answer your question, if I haven't done so already, I don't buy stocks unless I have a "permission slip" and that stock is on the top % gainers list on the day that I make a purchase. So no, I don't wait for a stock to pull back to make a purchase.
I want my system to be easy. I don't want to rely on my thinking and intuition. Every time I do that I open myself up for more errors. My portfolio talks to me loud and clear. I just need to listen!
Thanks again for writing and reading and linking to Stock Picks! Your support is greatly appreciated and your kind words and intelligent questions are welcomed!
If any of you have comments or questions, please feel free to leave them on the blog or email me at bobsadviceforstocks@lycos.com.
Bob
Wednesday, 29 August 2007
A Reader Writes "...you think its a good time now to jump in....?" (VSEC)
Hello Friends! Thanks so much for stopping by and visiting my blog, Stock Picks Bob's Advice! As always, please remember that I am an amateur investor, so please remember to consult with your professional investment advisers prior to making any investment decision based on this website.
I received a nice letter from Kay, asking me about my VSEC comments. She wrote:
"Hi Bob and its great to find your blog. what do you think of vsec from now on, its around 43. you think its a good time now to jump in or to wait for a minor pullback around 37 and go long at that point.Or just buy in small quantities when it goes a bit lower?
please reply,thanks,
with best wishes n greetings,
Kay."
First of all thanks for writing and it is great to have you visiting my blog! Please remember that I am an amateur investor. I cannot write that up enough. I have my own idiosyncratic system for picking stocks and determining my entry into and exit from positions. It isn't necessarily the best way and quite frankly, I am not sure it shall be profitable long-term. I guess that is why I am writing this blog.
But to get back to your question, I don't really have an opinion on your best approach to buying VSEC if you choose to do so. I haven't changed my 'rating' on VSEC, which is still rated a buy. It is just that I personally choose to buy stocks only on the particular day that they are on the top % gainers list and also on that particular day that I have a 'permission slip' from my own portfolio. This system is only a shade more scientific than Astrology (no offense to any Astrology fans intended), as I await for an alignment of all of the planets and constellations :).
It isn't necessarily the best way, but it is my method and approach.
I know that there are many wiser minds out there who can advise you better about this particular stock and a proper entry point. In fact, with a Google Search, I found a nice article on the Investor's Corner from Investors.com about entry points into stocks. I am sure there are many other articles about entry into stocks that you can review as well.
I hope that isn't a disappointing response :). You were very kind to write and all. But I have to tell you that what I do might not work for you and might not be the best way to go about it at all. But it gives me a structure to my trading, a clear set of rules that limits my actions to a very well-delineated set of actions. And it thus far has been working better for me than my many years of 'shooting from the hip' so to speak.
Thanks again for writing. Feel free to leave a comment here--either you Kay or any of my readers--or drop me a line at bobsadviceforstocks@lycos.com. I cannot respond to all of the comments I receive, but I certainly read them all and shall keep working at responding to the letters one by one :).
Bob
MICROS Systems Inc. (MCRS) "Revisiting a Stock Pick"
Hello Friends! Thanks so much for stopping by and visiting my blog, Stock Picks Bob's Advice! As always, please remember that I am an amateur investor, so please remember to consult with your professional investment advisers prior to making any investment decisions based on information on this website.
What a difference a day makes! I suppose in retrospect when I noted that ALL 15 of my stocks had declined, I should have figured that at least for the short-term that was some sort of climactic sell-off. At least for now, the market is over-sold and appears to be rebounding with the Dow up 118 points at 13,160.29 and the Nasdaq up 26.91 points at 2,527.55 with several hours left in the trading day.
 I was looking through the list of top % gainers on the NASDAQ this morning and came across an 'old favorite' of mine, MICROS Systems (MCRS) which as I write is trading at $59.50, up $3.99 or 7.19% on the day. I say 'old favorite' because I first wrote up MICROS on Stock Picks Bob's Advice on October 28, 2005, when the stock was trading at $45.82. Thus the stock has appreciated $13.68 or 29.9% since posting. I do not own any shares or have any options on this company.
MICROS SYSTEMS (MCRS) IS RATED A BUY
Since we are discussing prices of this stock and my last write-up, let's take a look at a "point & figure" chart on MICROS from StockCharts.com:
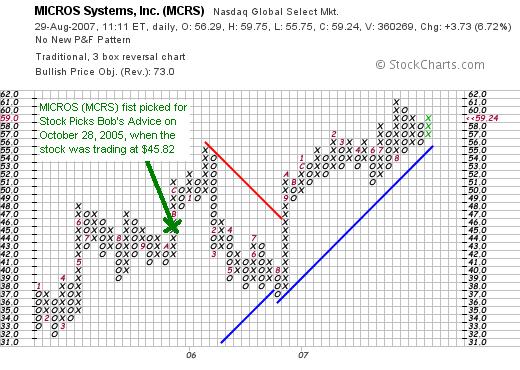
On the chart we can see that the stock reached an intermediate peak of $55 in January, 2006, only to sell-off to $36 in August, 2006. In that same month the stock turned around and broke through resistance on the upside and has resumed its upward trek since. The stock appears to be solidly in an upward move trading above support lines.
What exactly does the company do?
According to the Yahoo "Profile" on MICROS (MCRS), the company
"...engages in the design, manufacture, marketing, and servicing of  enterprise information solutions for the hospitality and specialty retail industries."
What about the latest quarter?
As is so often the case, and was the case when I first wrote up MICROS in 2005, what moved the stock higher today was the report of earnings results, in this case 4th quarter 2007 results, which were announced after the close of trading.
For the quarter ended June 30, 2007, revenue came in at $221.6 million, up 15.5% over the prior year same period. GAAP net income came in at $785.7 million, up 15.7% over the prior year. GAAP diluted eps came in at $.66, up 24.5% over the same period last year.
The company beat expectations for the quarter. Analysts had been expecting earnings of $.49/share on revenue of $202.7 million. In addition, the company raised guidance for fiscal 2008 to earnings of $2.59 to $2.62/share, on revenue of $910-$915 million. Analysts on average had been expecting earnings of $2.56/share on revenue of $905.5 million.
For an earnings report, I like to call this a "trifecta-plus" which for me means a company reports strong revenue growth, strong earnings growth, beats expectations and raises guidance. And the street liked what it read as well and the stock came out of the gate charging higher this morning!
What about longer-term results?
If we review the Morningstar.com "5-Yr Restated" financials on MICROS, we can see what I consider to be a very 'pretty' picture! Revenue has been steadily increasing from $372 million in 2002 to $679 million in 2006 and $756 million in the trailing twelve months (TTM).
Earnings during this period increased by six-fold from $.30/share in 2002 to $1.60/share in 2006 and $1.80 in the TTM. During the same period, the outstanding shares increased from 35 million in 2002 to 39 million in the TTM, a dilution of a little over 10%, quite acceptable to me.
Free cash flow has been positive and growing with $63 million reported in 2004, increasing to $111 million in 2006 and pulling back slightly to $109 million in the TTM. The balance sheet appears quite solid with $301 million in cash, which by itself could cover both the $246.5 million in current liabilities and the $29.6 million in long-term liabilities combined.
Calculating the current ratio, the total of current assets works out to $573 million, which when compared to the current liabilities of $246.5 million, yields a current ratio of 2.32.
What about some valuation numbers?
Reviewing Yahoo "Key Statistics" on MCRS, we can see that this stock is a mid cap stock with a market capitalization of $2.42 billion. The trailing p/e is a moderat 33.12, but the forward p/e is estimated at 18.65 (fye 30-Jun-08). Thus the PEG ratio, which takes into consideration the future growth in earnings in determining the richness in the price, comes out to a very reasonable 1.16 (I generally find PEG's between 1.0 and 1.5 to be reasonably priced).
In other measurements of valuation, according to the Fidelity.com eresearch website, the company has a Price/Sales ratio (TTM) of 2.84, well below the industry average of 6.02. There is a nice article by Paul Sturm at Smart Money on the importance of relative Price/Sales ratios, and MCRS does well in this regard.
In terms of profitability, Fidelity suggests MCRS is not quite as good as its peers, with the Return on Equity (TTM) coming in at 15.78%, under the industry average of 25.05%.
Finishing up with Yahoo, we find there are 40.52 million shares outstanding with 38.39 million that float.
As of July 10, 2007, there were 3.11 million shares out short. This works out to a short ratio (as of 7/10/07) of 7.4 trading days of average volume or 7.7% of the float. I personally use a '3 day rule' for significance, and at 7+ days, this is well above that, setting this stock up for a short squeeze, which may well be developing today as the company announces strong results attracting interest in the stock and buyers coming into the market driving the stock price higher.
No cash dividend is paid and the last stock split was a 2:1 stock split on February 2, 2005.
Summary: What do I think?
Well, as you probably can tell I like this stock a lot. I practically LOVE this stock :). But I don't own any shares :(. However, if I were in the market to be buying a stock today, this is the kind of stock I would be adding to my portfolio. Meanwhile, I shall keep it in my 'vocabulary' of stocks, ready to buy at the appropriate time.
Let me summarize a few of the findings. First of all the stock reported strong earnings with both earnings and revenue growth as well as beating expectations for both and then raising guidance for both! Longer-term the company has been steadily increasing revenue, earnings, and free cash flow, while keeping the outstanding shares relatively stable. The balance sheet is solid with the company with enough cash to pay off all liabilities--both short-term and long-term!
Valuation-wise, the p/e is a tad rich in the 30's, but the PEG is just over 1.0. The Price/Sales is good compared to other companies in the same industry, but the Return on Equity is a bit weak. In addition there are lots of short-sellers who appear to be betting the wrong way on this stock.
Finally, the chart looks great, moving higher without appearing over-extended. This stock belonged in the blog in 2005 and deserves a spot in 2007!
Thanks again for dropping by! If you have any comments or questions, please feel free to leave them on the blog or email me at bobsadviceforstocks@lycos.com. If you get a chance be sure and visit my Stock Picks Podcast Page where I discuss some of the stocks I write about here on the blog. In addition, check out my Covestor Page which analyzes my actual trading portfolio performance relative to other registered invesotrs, and visit my SocialPicks Page which has an ongoing analysis of my blog since about January, 2007. Now you also have a lot of homework!
Regards and isn't it nice to have a market moving higher for a change?
Bob
Tuesday, 28 August 2007
A Reader Writes "Is there something I am missing?"
Hello Friends! Thanks so much for stopping by and visiting my blog, Stock Picks Bob's Advice! As always, please remember that I am an amateur investor, so please remember to consult with your professional investment advisers prior to making any investment decisions based on information on this website.
I always enjoy receiving, and responding to email. By the way, if you have any comments or questions, you are always welcome to leave them right on the blog or email me at bobsadviceforstocks@lycos.com. I read every email I receive and I try to answer as many as I can....so bear with me. Remember that as much as you may enjoy this blog, I am still an amateur investor answering all of your questions. I guess you could say we are all in this together :).
Anyhow, instead of concentrating on how bad everything was today and the past month for that matter, I wanted to share with you a nice email I received from Asad R. who writes from Racine, Wisconsin, about "buy and hold" investing.
Asad wrote:
"Hello!
I read your website, I have a question:
I have looking at stocks like Yahoo, Walmart, Coca Cola etc.
And it seems to good to be true.
For example: if one had bough one thousand dollars worth of shares of Yahoo back in 1996 when the price per share was one dollar,
today with splits you would have 24,000 shares and since the price per share is 23.59, you would have: $566,000.
Wal-Mart for example, back in 1974 was 4 cents per share. If you had bought $1000 worth of shares that would have been 25,000 shares.
It split 9 times since then. So you would have 12,800,000 shares. At the current price of $43 per share you would have $550,400,000. (Half a billion).
Now some may say: 'yeah but you have to chose a winning stock many stocks will lose money or even go bankrupt.
But I say: Let's say you spend $50,000 on stocks, spening $1000 each in 50 companies. Even if 40 of those 50 companies went bankrupt, as long as you chose one winning stock (like Wal-Mart or Yahoo) you would be a millionaire!
Just seems to good to be true. This 'buy and hold' strategy.
Is there something I am missing? Some catch?
Any comments would most appreciated, thank you
Asad R."
First of all, thank you for writing Asad! You are indeed correct. If you can possibly find these companies when their shares are in the pennies and they go on to become gigantic firms, you may well be on your way to wealth! I cannot argue with you. But the challenge is in identifying those companies and staying with them long-term.
I am not opposed to 'buy and hold' approaches.
In fact, nothing would delight me more than to have perhaps found one of these companies on the way to immense levels of appreciation.
The only difference in what I do is to think about some of the 'what if's'. In other words, what if your stock declines after your purchase? What if they announce poor earnings and problems with management? What if they are being investigated for fraud? What if they turn to losses instead of gains and their revenues shrink away? What if?
On the other hand, I do not believe that you should sell a stock completely just because it appreciated in value. Nowhere will you find that recommendation on this blog. I have suggested that it is wise to aggressively sell your losers. To balance these sales, I like to sell my gainers very slowly and only partially. As I have sold some of these stocks multiple times, I continue to give them greater rein to travel. That is, I let them decline more before pulling the plug, increasing the likelihood that they shall become long-term gainers.
Furthermore, I believe it is important to identify the characteristics of these companies like Wal-Mart or Coca Cola before they become the fabulous success investments they look like today. It is my belief that it is relatively foolish to buy a random basket of 50 stocks with $1,000 in each. I would much rather see you do some work and identify those characteristics of the stongest stocks and instead buy 10 stocks with $5,000 apiece.
But don't just randomly select stocks.
Identify those characteristics that made the Wal-Mart's or the Coca Cola's of the world so fabulous. This is what I have referred to previously as the Fastenal stock. The stock that keeps on appreciating year in and year out making millionaires out of relatively small investors. From my perspective, this is a product of the steady growth in revenue, earnings, possibly dividends, stable shares, positive free cash flow and a solid balance sheet.
I believe that if I build a portfolio based on these criteria, I shall be successful. That at least is my dream.
Good luck with whatever you do. You are not incorrect to note that you might be able to buy 50 stocks and if one hits the jackpot you win. But the chance to find that one stock might well be under 1/50. I don't know the chance of your success. This isn't my approach, but maybe it is something you would like to do. Let me know what you decide.
In any case, thanks again for visiting and taking the time to write. You have added some provocative ideas to this blog and I appreciate that very much. There really isn't one approach that makes sense in investing. There are many approaches and some shall be more successful than others in differing trading environments.
Paraphrasing the Byrds, "There is a Time and a Season for every Purpose."
Bob
How I am Dealing with the Market Correction
Hello Friends! Thanks so much for stopping by and visiting my blog, Stock Picks Bob's Advice! As always, please remember that I am an amateur investor, so please remember to consult with your professional investment advisers prior to making any investment decisions based on information on this website.
It was another lousy day in the market. The Dow closed at 13,041.85, down (280.28) and the Nasdaq did just as poorly, closing at 2,500.64 down (60.61) points on the day. My own portfolio wasn't spared, EVERY SINGLE POSITION closed lower, for a loss of $(2,355.29) on the day in my trading account.
So WHAT is a trader supposed to do?
And how am I dealing with this rout?
Part of this blog is to see whether the trading strategy that I have been using will be successful over the long haul. And that includes bear as well as bull markets! So NO, I have not changed my strategy.
My approach to the markets is to let my own portfolio tell me what to do. That is I manage each of my holdings independently and the combined effect of all of these decisions is my way of responding to the market.
I am already down from 20 to 15 positions. Currently, only my VCA Antech (WOOF) is flirting with a sale, down to a $(541.41) loss or (6.28)%. If the stock makes it to an (8)% loss, the entire position shall be sold.
I am monitoring my other positions as well. I know where I need to sell each and every one of my holdings. As you may recall, after an initial purchase, I allow a stock to move to an (8)% loss before selling. I also sell stocks as they appreciate at different intervals. After a single partial sale at a 30% gain level, I move my 'stop' up to a break-even level before selling all remaining shares. After two or more partial sales at 60% or higher, I move my stop up further to 1/2 of the highest appreciation level sale. For instance, if I have sold a portion of a holding, with the last sale at a 90% gain, then I would move my sale point up to a 45% appreciation level before unloading all shares.
A couple of points in addition. If I sell a stock on 'bad news' I 'sit on my hands' with the proceeds. That is, I either apply it to my unfortunately significant margin level, or if that is paid down, I simply save it as cash. I continue to pull back my investment exposure until I am at a 25% invested posture. With 20 stocks being my maximum, the minimum portfolio size is planned to be 5 positions. At 5 positions, if any of these stocks are sold, then for the time being, I shall be replacing those positions with new stock investments that meet my criteria.
So when stocks decline, I do not look to find 'value' in the depressed issues. Perhaps I should, but that is not my strategy. I do not depend on diversification into bonds and other forms of investments to protect my stocks. Instead I manage my holdings aggressively and in a very disciplined fashion. I do not try to anticipate the market. I don't know where it shall be a week from now. I do not try to outsmart the market. I simply try to listen to what the market is telling me and to respond to the price actions of my stocks in my own portfolio.
I hope this will be successful for me.
I wanted all of you to know that I too am feeling the pain of the stocks dropping in price. I shall keep you all posted as I write about and struggle with managing stocks in good times and bad.
Bob
Monday, 27 August 2007
Stock Picks Bob's Advice in Carnival of Personal Finance
If you are a frequent blog reader you may well be aware of the phenomenon of "carnivals". These are events in which the hosting website invites contributions of blog entries on a given topic from across the blogosphere.
I contributed and had my post on "Averaging Down" included in the Free Money Finance: Carnival of Personal Finance. Please visit this and you will appreciate many of the other financial blogs that are commenting and thinking about personal finance and investing. I look forward to participating in future carnivals as I share my writing with others across the 'net.
Bob
ICF International (ICFI)
Hello Friends! Thanks so much for stopping by and visiting my blog, Stock Picks Bob's Advice! As always, please remember that I am an amateur investor, so please remember to consult with your financial advisers prior to making any investment decisions based on information on this website.
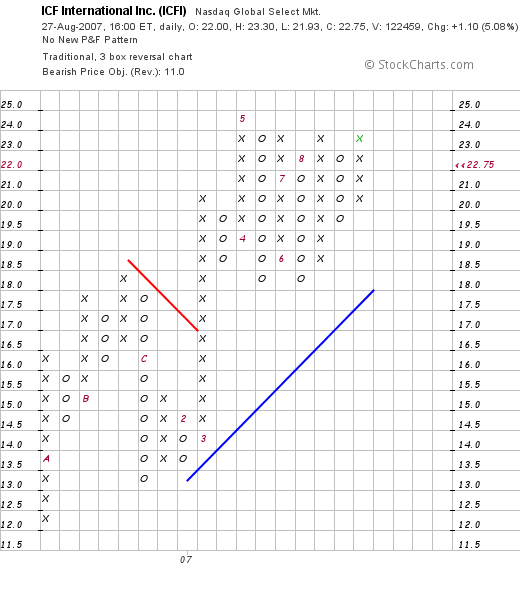
 Earlier today, scanning through the list of top % gainers on the NASDAQ, I came across ICF International (ICFI) which as I write, is trading at $22.70, up $1.05 or 4.85%. The stock is no longer on the list of top gainers, but after reviewing the stock this morning, I feel it deserves a place on the blog. I do not own any shares nor do I have any options on this stock.
ICF INTERNATIONAL (ICFI) IS RATED A BUY
What exactly does this company do?
According to the Yahoo "Profile" on ICFI, the company
"...and its subsidiaries provide management, technology, and policy consulting and implementation services primarily to government, commercial, and international clients. Its services primarily address energy; environment and infrastructure; health, human services, and social programs; and homeland security and defense markets."
Is there any recent news to explain the move today?
This morning, before the open of trading, the company announced two new contracts worth up to 4.5 million Euros under the 'European Commission's Technical Aid to the Commonwealth of Independent States (TACIS)" program.
How did they do in the latest quarter?
On August 9, 2007, the company reported 2nd quarter 2007 results. Revenue came in at $190.2 million for the quarter ended June 30, 2007, a 25.3% increase from the $151.7 million reported last year. Net income was $11.2 million, or $.75/diluted share, up about 25% from the $8.7 million or $.60/diluted share in the preceding quarter, and up sharply from last year's revenue of $56.1 million and a net loss of $(1.4) million or $(.15)/diluted share.
A large portion of the revenue was the $128.6 million received from the New Orleans "The Road Home" contract which was recorded in the second quarter of 2007. The earnings report does note that even minus The Road Home revenue, there would have been a 12.1% increase sequentially and a 10.6% increase year-over-year in the revenue.
What about longer-term results?
Reviewing the Morningstar.com "5-Yr Restated" financials on ICFI, we can see the steady increase in revenue from $143 million in 2002 to $146 million in 2003, then a dip to $139 million in 2004, increasing sharply thereafter to $331 million in 2006 and $564 million in the trailing twelve months (TTM).
Earnings have also been erratic during the earlier years with $.10/share in 2002, increasing to $.30/share in 2004, dropping to $.20/share in 2005 then ramping up to $1.10 in 2006 and $2.50/share in the TTM.
The company has increased its float slightly from 8 million shares in 2002 to 10 million in 2006 and 11 million in the TTM. This 40% increase in shares has been accompanied by a 200% increase in revenue and about a 700% increase in earnings. This is an acceptable dilution in shares outstanding.
Free cash flow which was $2 million in 2004 and only $1 million in 2005, increased to $16 million in 2006 and $47 million in the TTM.
The balance sheet is adequate with $2 million in cash and $151 million in other current assets, which when compared to the $133.4 million in current liabilities, yields a current ratio of 1.15.
What about some valuation numbers?
Looking at the Yahoo "Key Statistics" on ICFI, we can see that this is a small cap stock with a market capitalization of $323.69 million. The trailing p/e is quite cheap at 9.50, with a forward p/e estimated (fye 31-Dec-08) at 13.98. Looking at earnings going forward, the PEG ratio is estimated at 0.49.
Checking the Fidelity.com eresearch website, we can see that ICFI has a Price/Sales (TTM) of 0.63, well below the industry average of 2.70. The company is also more profitable than its peers, with a Return on Equity (TTM) of 20.04%, according to Fidelity, compared to an industry average of only 12.66%.
Finishing up with Yahoo, it is reported that there are only 14.39 million shares outstanding with 13.05 million that float. There are only 204,560 shares out short as of 7/10/07, representing 2.4 trading days of volume (the short ratio) or only 1.5% of the float. According to Yahoo, there are not dividends paid and no stock splits are reported.
What does the chart look like?
Reviewing a "point & figure" chart on ICF International (ICFI) from StockCharts.com, we can see that the stock, which traded as low as $12 in September, 2006, has moved fairly steadily higher to as high as $24/share in May, 2007. The stock has been trading between $18 and $25 since then and overall appears to be moving higher above its support line.
Summary: What do I think about ICFI?Well needless to say, I like the stock. The recent announcement of European contract is encouraging. There is indeed a large dependence on The Road Home contract which makes up a big part of its business. But the company is still growing it business nicely even without that particular contract.
The latest quarter was strong, the last several years were quite strong, the balance sheet looks nice and valuation is dirt cheap with a p/e in the teens, a PEG well under 1.0, a Price/Sales ratio under its peers and a Return on Equity exceeding other similar enterprises. Finally the chart looks encouraging without appearing overextended.
If I were buying any stock today, this is the kind of stock I would be purchasing and it thus belongs in the blog.
Thanks so much for stopping by and visiting! If you have any comments or questions, please feel free to leave them on the blog or email me at bobsadviceforstocks@lycos.com. Be sure and visit my Stock Picks Podcast Page as well as my Covestor page which tracks my actual trading portfolio, and my Social Picks Page which reviews my past stock picks for this year.
Regards!
Bob
Newer | Latest | Older


