Stock Picks Bob's Advice
Sunday, 5 August 2007
Home Depot (HD) "Long-Term Review #8"

Hello Friends! Thanks so much for stopping by and visiting my blog, Stock Picks Bob's Advice! As always, please remember that I am an amateur investor, so please remember to consult with your professional investment advisers prior to making any investment decisions based on information on this website.
I am now getting well into my fifth year of blogging here on Stock Picks. There are many entries and I am sure many of you find it difficult to find entries on the website. I know that I do. In fact, when looking for whether I have reviewed stocks, I often need to Google myself! Don't laugh, it works.
This past year I have been trying to dig way back into the early days of this website to find out how those early picks turned out. As I like to point out, these reviews also depend on a buy and hold strategy. In practice, I advocate and employ a very different strategy of closely monitoring the actual stocks in my own portfolio, selling the losing stocks quickly and completely and selling gaining issues slowly and partially. Much of my success or failure long-term will depend on this strategy. But for this review, I assume a buy-and-hold approach to these investments.
My last 'long-term' review was on July 8, 2007, when I reviewed my May 19, 2003 write-up of Bradley Pharmaceuticals. Let's take a closer look at Home Depot (HD) which I wrote up on May 20, 2003:
"May 20, 2003
Home Depot (HD)
Thanks for stopping by. Taking a look first at the NYSE biggest advancers we find Home Depot near the top. We find HD trading currently at $31.10, up $3.03 or 10.79%. I have to confess to some bias in reviewing these charts and let me explain. I have found that the larger cap issues overall tend to perform better with this technique and also stocks over $10. If I can find issues on the NYSE, stocks even like Dell or Krispy Kreme, then I will go with them....many of the smaller issues I have been "shaken out" as they say in the business because a company trading at $4.00 a share, needs to go down only $.32 to reach the 8% stop.
Back to Home Depot. This is a long time growth stock favorite. Recently, it has sold off with relatively slower growth, presumably due to stiff competition with Lowes among other retail outfits.
Last quarter, just reported today (!), sales increased to $15.1 billion from 14.2 billion. However same store sales dropped 1.6% (a negative) although EXPECTATIONS were for a 2-4% drop in same store sales. what is important here is what the 'street' was expecting and HD outperformed.
Looking at Morningstar we find that sales have grown from $24.2 billion in 1998 to $30.2 billion in 1999, $38.4 billion in 2000, $45.7 billion in 2001, and $53.6 billion in 2002. Extrapolating out the first quarter...which is probably unreasonable due to somewhat seasonality of retail business, we can see a near $60 billion rate for the year 2003.
The cash flow of this company has really turned around as well from a -762 million in 2001 to a positive 2.57 billion in 2002 and the TTM as Morningstar says...is $3.6 billion in positive cash flow (TTM is 'trailing twelve months').
Anyhow, the issue is not perfect....but at a p/e of 17.9, this issue is ripe for the picking. Good luck and remember to hold to the 8% stop loss. I do own some shares of this stock among my different accounts...as do members of my family. Bob"
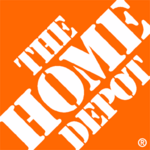
Home Depot (HD) closed at $36.19 on August 3, 2007, for a gain of $5.09 or 16.4% since posting.
How did they do in the latest quarter?

On May 15, 2007, Home Depot announced
1st quarter 2007 results. Net earnings came in at $1.0 billion or $.53/diluted share, down from $1.5 billion or $.70/diluted share the year earlier same period. Sales for the quarter came in at $21.6 billion, up 0.6% from the prior year same period. More telling, however, was the figure on 'same-store sales' which showed a (7.6)% decline year over year.
What about longer-term results?
Reviewing the
Morningstar.com "5-Yr Restated" financials, we can see the recent dip in revenue, earnings dipped from 2005 steadily to 2007 and are up in the trailing twelve months. Free cash flow is nicely positive and the balance sheet is adequate.
How does the chart look?
Looking at the "Point and Figure" chart on Home Depot from StockCharts.com, we can see the dip in 2003, the recovery in March, 2006, and the apparent resistance to upward price moves. Overall, the chart is less than exciting.
Thus, with the weak earnings report and negative same-store sales, and un-impressive chart, with the knowledge of the continuing real-estate and home-building challenges,
HOME DEPOT (HD) IS RATED A SELL
Thanks so much for stopping by and visiting my blog! If you have any comments or questions, please feel free to leave them right on the blog or email me at bobsadviceforstocks@lycos.com.
Bob
Baldor Electric (BEZ) "Weekend Trading Portfolio Analysis"

Hello Friends! Thanks so much for stopping by and visiting my blog, Stock Picks Bob's Advice! As always, please remember that I am an amater investor, so please remember to consult with your professional investment advisers prior to making any investment decisions based on information on this website.
One of my goals of this blog is to share with you my own experience in investing. As part of this transparency I have been on a regular basis reviewing each of my stock holdings which now number twenty. On July 7, 2007, I reviewed Wolverine World Wide (WWW). Alphabetically, that was the bottom of th list. Starting at the top once more I am at Baldor Electric (BEZ).
Let's take a closer look at Baldor, which being one of the latest additions to my portfolio is teetering on the edge of a sale.
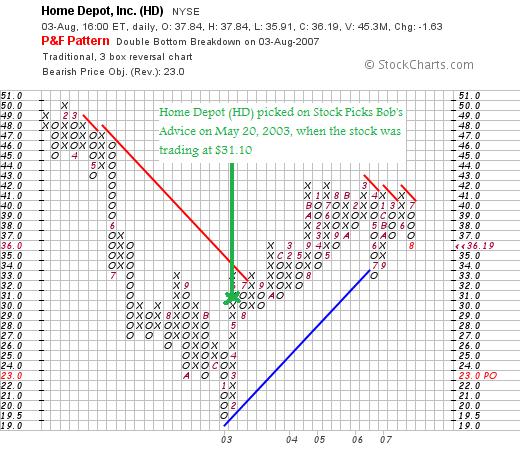
 I first wrote up Baldor on Stock Picks Bob's Advice on May 4, 2007, when the stock was trading at $44.01/share. Shortly after writing up Baldor, Doug S., one of my loyal readers on this blog, pointed out that much of the revenue growth was due to acquisitions. My own review of this didn't lead to much concern, and the stock stayed in my portfolio. Currently I own 140 shares of Baldor (BEZ) that were acquired May 22, 2007, at a cost basis of $47.19. BEZ closed at $43.63/share on August 3, 2007, for a loss of $(3.56) or (7.5)% since my purchase. I plan on selling my shares if they decline to an (8)% loss, which for Baldor would mean declining to .92 x $47.19 = $43.41/share. The stock just needs to decline $.25 tomorrow to trigger a sale.
(My ownership of Baldor is confounded by a short purchase and sale....I purchased 140 shares on 5/4/07 and sold them 5/23/07 for a short-term gain of $352.50....these shares were sold because I 'accidentally' (!) purchased shares twice. I then unloaded these shares and purchased Mesa Laboratories instead. I wouldn't be near a sale point if I had been paying attention :(. But regardless of all of that, I shall be selling my BEZ if it hits a sale point on the latest purchase.)
Let's take a closer look at this company and see if the stock still deserves a spot on my blog and a spot in my portfolio!
Since I recently reviewed Baldor, let's take a brief look at the chart, the latest quarterly report, and the Morningstar.com "5-Yr Restated" financials on this company and double-check the data!
First of all the "point & figure" chart on Baldor from StockCharts.com:
You can see how confusing this picture appears. The second purchase was a mistake. I sold shares shortly thereafter but that gave me a new basis for the shares. Yikes. However, while there has been some profit-taking and the market overall has certainly hasn't helped, the chart appears intact with prices well above the blue 'support line'.
What about that latest quarterly report?
On July 26, 2007, Baldor (BEZ) reported 2nd quarter 2007 results. Net sales increased 139% to $491.6 million from $205.6 million. Net earnings climbed 103% to $25.2 million from $12.4 million the prior year. On a per share basis this worked out to a 42% increase from $.38/share to $.54/share this year. However, the increase would have been even more except that the number of shares climbed almost 50% to 46.6 million from 32.8 million the prior year.
The company was pretty clear that much of the big increase was due to acqusitions, but the fact that they were able to significantly increase their earnings even with more shares outstanding is pretty encouraging to me.
And the longer-term results?
Reviewing the Morningstar.com "5-Yr Restated" financials on Baldor (BEZ), we can see that revenue growth is uninterrupted. Earnings which did dip after 2004, have now strongly rebounded to higher levels than even the $1.10/share in 2004. The company has been paying a dividend, and also increasing that dividend. Free cash flow is positive and growing, and the balance sheet looks fine although the long-term debt is a bit impressive at $1.9 billion.
Even though I am just 25 cents from a sale, the latest quarter looks fine, the chart appears intact, and the Morningstar.com page looks adequate except for the long-term debt, which should be able to be handled with the growing free cash flow.
Thus,
BALDOR ELECTRIC (BEZ) IS RATED A BUY
Thanks so much again for stopping by! If you get a chance, be sure and visit my Stock Picks Podcast Page and I shall make a good effort at posting a new podcast this month. In addition, to review my trading portfolio performance, be sure and visit my Covestor Page for BobsAdvice, and also for all of my picks and a review of my picking performance, stop by and visit my SocialPicks page which summarizes and evaluates my stock picking relative to the world of stock pickers and analysts.
Have a better week trading!
Bob
"Looking Back One Year" A review of stock picks from the wek of February 13, 2006

Hello Friends! Thanks so much for stopping by and visiting my blog, Stock Picks Bob's Advice! As always, please remember that I am an amateur investor, so please remember to consult with your professional investment advisers prior to making any investment decisions based on information on this website.
What a volatile week we had in the market! The Dow closed out the week Friday with a 281.42 point loss representing a 2.09% pullback in that index. The NASDAQ composite was even worse closing at 2,511.25 down 64.73 just on Friday alone, a loss of 64.73 points or 2.51% on the index.
Glad to see that week completed! I do not know how the market will move on Monday, this week, this month, or this year. I do know that I shall still maintain my investment strategy of monitoring my holdings closely, selling them quickly on losses, and slowly and partially on gains.
Let's take a look at some stock picks from last year. As is my practice, I reviewed stock picks from the week of February 6, 2006 last wekeend. Going ahead a week, I want to review the picks from the week of February 13, 2006. For the sake of this review, this evaluation assumes a buy and hold strategy for all of the stocks selected. In actual practice, I advocate and employ a disciplined strategy of limiting losses by selling declining positions quickly and completely, and partially selling appreciating stocks at targeted appreciation levels. This difference in strategy between this review and my actual practice would certainly affect the overall outcome of stocks selected from this blog. However, for the ease of evaluation, I plan on continuing to use the "buy and hold" analysis for reviews.
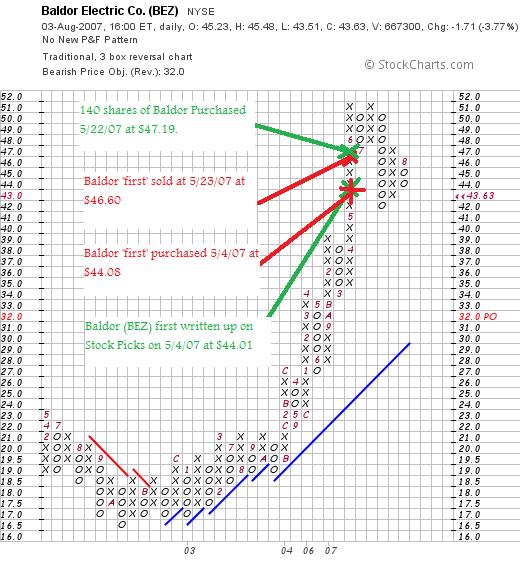
 On February 14, 2006, I posted Chico's FAS (CHS) on Stock Picks Bob's Advice when the stock was trading at $47.61. CHS closed at $17.99 on August 3, 2007, for a loss of $(29.62) or (62.2)% since posting.
On May 30, 2007, Chico's FAS announced 1st quarter 2007 results. Net sales for the quarter increased 16% to $453 million from $391 million in the same 2006 quarter. During the quarter comparable store sales decreased 1.6%. Net income for the quarter dropped from $52.5 million in 2006 to $47.2 million in the same quarter this year. Net income dropped to $.27/diluted share from $.29/diluted share last year.
The bad news does not appear to be over for Chico's. On July 11, 2007, Chico's reported that June 'same-store sales' declined (7.3)% in June.
With no good news in sight from my perspective, as well as a poor technical chart,
CHICO'S FAS (CHS) IS RATED A SELL
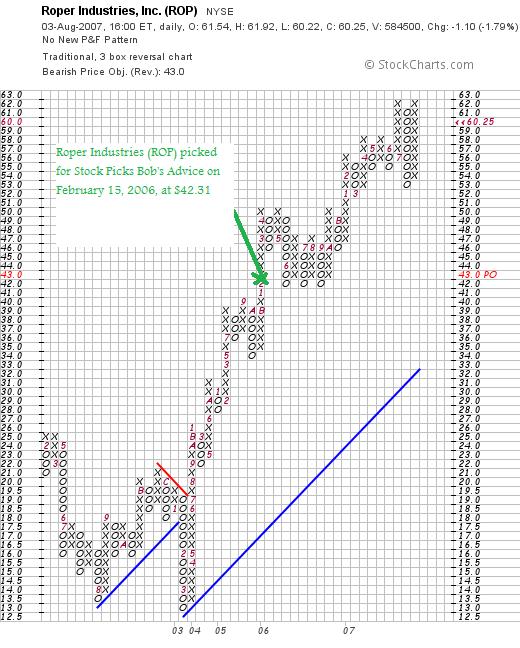
 On February 15, 2006, I posted Roper Industries (ROP) on Stock Picks Bob's Advice when the stock was trading at $42.31. ROP closed at $60.25 on August 3, 2007, for a gain of $17.94 or 42.4% since posting.
On July 26, 2007, Roper Industries reported 2nd quarter 2007 results. Second quarter sales came in at $531 million, up 25% over last year's $425 million in sales. Net earnings came in at $61.2 million up from $48.1 million last year. This worked out to $.66/diluted share, up from $.53/diluted share.
The company beat expectations as analysts had been expecting $.65/share in earnings on revenue of $513 million. The company also raised guidance on 2007 earnings results with $2.60 to $2.66/share now expected, up from the prior guidance of $2.54 to $2.64/share.
With this solid earnings report and raised guidance as well as a strong chart,
ROPER INDUSTRIES (ROP) IS RATED A BUY

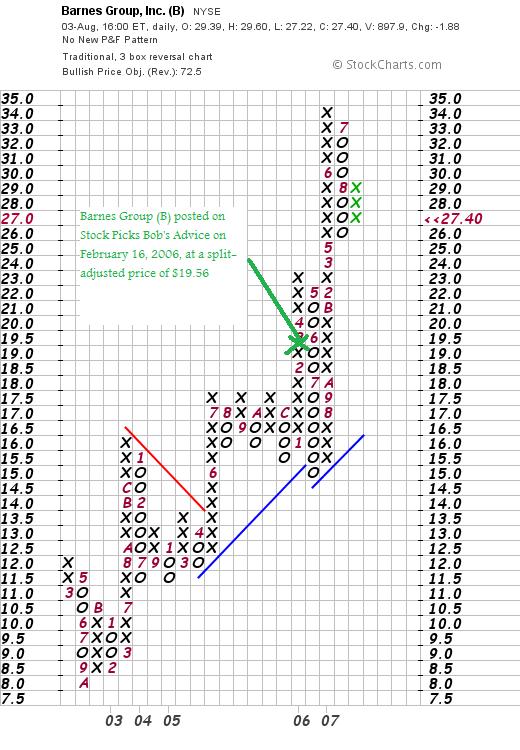
On February 16, 2006, I posted Barnes Group (B) on Stock Picks Bob's Advice when the stock was trading at $39.11.
Barnes had a 2:1 stock split on June 12, 2006, making my effective stock pick price $19.56. Barnes (B) closed at $27.40 on August 3, 2007, for a gain of $7.84 or 40.1% since posting.
On August 2, 2007, Barnes (B) reported 2nd quarter 2007 results. Revenue came in at $359.5 million, up 16% from $308.9 million last year. Earnings came in at $28.4 million or $.49/share, up from $18 million or $.34/share in the same quarter in 2006. The company beat expectations on earnings which had been expected by analysts to come in at $.47/share. However, revenue came in a little bit low of expectations which were expected to come in at $362.1 million according to Thomson Financial.
With this strong earnings report, and a strong chart,
BARNES GROUP (B) IS RATED A BUY

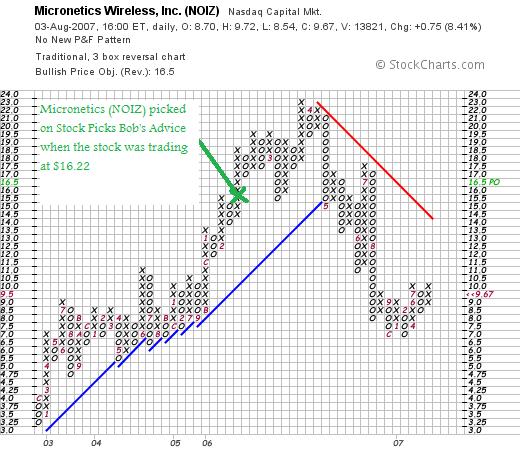
On February 17, 2006, I posted Micronetics (NOIZ) on Stock Picks Bob's Advice when the stock was trading at $16.22. NOIZ closed at $9.67 on August 3, 2007, for a loss of $(6.55) or (40.4)%.
On June 29, 2007, NOIZ reported 4th quarter 2007 results. Revenue for the quarter fell 27% to $6.3 million from $8.6 million last year. Net income declined to $340,063 or $.07/share, down from $942,109, or $.19/share last year.
With this poor earnings report and weak chart,
MICRONETICS (NOIZ) IS RATED A SELL
So how did I do with these four stocks picked during the week of February, 13, 2006? Well it certainly was a 'mixed bag' with two gainers and two losers. The overall performance was a loss of (5.03)%.
This once again demonstrates how there is nothing magical about what I have been doing here and the necessary sales on small losses!
Thanks so much for visiting! If you have any comments or questions, please feel free to leave them on the blog or email me at bobsadviceforstocks@lycos.com.
Bob
Saturday, 4 August 2007
Market Comment: Picking up the Pieces after Last Week's Action!
Hello Friends! Thanks so much for stopping by and visiting my blog, Stock Picks Bob's Advice! As always, please remember that I am an amateur investor, soplease remember to consult with your professional investment advisers prior to making any investment decisions based on information on this website.
I would be negligent if I didn't acknowledge the fast and sharp correction in virtually all of my holdings this past week. I am not immune to market action.
But as of this date, during this particular correction, none of my stocks have been sold. But four of the twenty are now at the cusp of being sold.
Baldor Electric (BEZ) is carrying a (7.54)% loss since my purchase of shares, Hologic (HOLX) is at a (6.77)% loss, National Oilwell (NOV) is a (7.02)% loss, and VCA Antech (WOOF) is showing a (6.21)% loss. These stocks are close to my (8)% loss limit. I have set that up as a level that I sell stocks after an initial purchase.
In addition, after a single sale at a gain, I implement sales of remaining shares if they drop to break-even. Also, if I have sold shares more than once at different appreciation targets, such as a holding like ResMed (RMD) which I have sold twice at 30% and 60% levels, I allow that stock to decline to 1/2 of its highest appreciation-sale level before selling shares. In other words, since ResMed (RMD) has been sold at a 60% target, if the stock shoud decline back to a 30% appreciation level I plan on selling all remaining shares. (ResMed closed Friday at a 47.82% appreciation level, so this particular stock is not currently near a sale point).
Also, after any sale on a decline, I consider this a sale on "bad news". This difference is critical as I do not have "permission" to re-invest those proceeds in another position. Instead, those proceeds must be used to either pay down my margin (which is still significant) or simply add to a cash position. The only exception is if I have shrunk the size of my portfolio down to a minimum level of equity exposure which for me is 5 positions. Recall that 1/2 of my maximum of 20 positions (where I am at currently) is called "neutral" or 10 positions. The minimum is 1/2 of that or 5 positions. Since my 'strategy' requires me to respond to my own portfolio, I cannot completely get into cash as I shall not have a signal to be buying new positions! Thus, at my minimum, if I receive a 'sell signal' then I would indeed plan on selling that stock, but I shall also plan on replacing that stock with a new position selected through the same techniques I use to pick stocks on "good news".
Wish me luck!
Remember that I am truly an amateur, so do consult with professional investment advisers to see even if this particular approach is appropriate for you.
One important note. Throughout this discussion you will see that I am not predicting the market action. I shall reserve the right to sell EVERYTHING if I feel there is something terribly fundamentally wrong with the market. Just as I reserve the right to over-ride my own trading rules and do something arbitrary. However, I haven't been doing this very often at all. And the very rare times that I have done so, I have generally been wrong.
I do believe in the long-term financial prospects of stock markets, especially the stock market in the United States. That is the one I am most familiar with. And thus, my goal is not to be shaken-out of investments by corrections, but not to put my head in the sand either. I shall continue to work at responding to my own portfolio's signals and see if this shall continue to be profitable for me.
Have a great week trading everyone!
Bob
Posted by bobsadviceforstocks at 5:36 PM CDT
|
Post Comment |
Permalink
Updated: Sunday, 5 August 2007 9:18 AM CDT
Friday, 3 August 2007
A Reader Writes; "I have two questions:"
Hello Friends! Thanks so much for stopping by and visiting my blog, Stock Picks Bob's Advice! As always, please remember that I am an amateur investor, so please remember to consult with your professional investment advisers prior to making any investment decisions based on information on this website.
 The market sure was just terrible today. If your portfolio is anything like mine, I am sure you incurred some serious losses. I haven't sold anything at this time as I have my sale points all set and a couple of my holdings are now nearing sales. The important thing, however, is that I have anticipated this possibility and have definite price levels at which I shall be parting with these companies.
I had another nice email from a reader today which I wanted to share with you and answer on the blog as it raises some good questions about my own method of selecting stocks.
Vijay wrote:
"Bob,
I am very new to stock market investing, and your blog is one of the more illuminating ones that I have come across. It is one of the very few that I religiously read every day.
In one of your recent posts, you had mentioned that you buy only those qualifying stocks that are in the top % gainers of the day. I have two questions:
1. Is it not ill advised to buy after a stock has already gained big?
2. How far down the list of gainers do you go, and where do you get this list?
Thanks
Vijay"
Vijay, thank you for writing and especially thank you for those kind words. In days like today, any words of encouragement are appreciated.
I do not know if I deserve the credit that you assign me and I am sure there are many other websites that deserve your attention and are equally if not more illuminating. But I shall strive to continue to be informative so that your visits are worthwhile.
Regarding your first question:
"1. Is it not ill advised to buy after a stock has already gained big?"
Certainly if stock price movement were random events then buying after a stock rise might be considered risky because it would be more likely subsequently to be incurring declines. But stock price movements aren't random. They are, from my perspective, the result of many different forces acting upon stocks including earnings, expectations, industry expectations, and the overall market action.
It has been my observation that the stocks that are moving higher in a significant fashion may well include among them stocks that will make very significant moves higher following the initial spike in the stock price. I simply start with this list, and then look carefully at the underlying reasons for that price move. I examine their latest quarterly result, their Morningstar.com results, the price chart and valuation numbers. It is not enough that a stock should have moved higher one day. But it isn't a bad place to start in trying to identify stocks that are likely to move higher in the future. That at least has been my experience.
Your second question:
"2. How far down the list of gainers do you go, and where do you get this list?"
I will go all the way to the bottom of the list, which usually has the 50 top % gainers on the NYSE, NASDAQ and AMEX markets. When I write up my reviews, I generally include a hyperlink to the underlying information unless you are reading my blog on another website where this link is no longer available. I have found the Money.cnn.com website the most helpful. (http://money.cnn.com/data/gainers/nasdaq/?). This is the link for the NASDAQ top gainers. There are many other sources of top % gainers including even USA Today.
I hope this answers your questions adequately. If not, please feel free to comment right on the blog or email me at bobsadviceforstocks@lycos.com.
As your positions decline in price, you will all find it helpful, I believe, to anticipate any degree of price appreciation or price declines with planned sales either to limit losses or to lock-in small gains on appreciating stocks.
Bob
Wipro (WIT) "Clearing up a Comment!"
Hello Friends! Thanks so much for stopping by and visiting my blog, Stock Picks Bob's Advice! As always, please remember that I am an amateur investor, so please remember to consult with your professional investment advisers prior to making any investment decisions based on information on this website.
On Wednesday, I answered a reader about my investment strategy. He asked in particular about Wipro (WIT), the Indian outsourcing firm. I am a big fan of Wipro stock, and my stock club actually owns a few shares.
Somehow, Social Picks, the website that tracks my 'picks' interpreted my evaluation as a "Sell" on the stock. This was not my intention in case you happened to read my review on that website. I am a great fan of Social Picks, and if you are interested you can visit my SocialPicks Page where all of my discussions have been reviewed since January, 2007.
Just to make sure, I took a quick look at Wipro (WIT). Their latest quarterly report was positive. The Morningstar.com "5-Yr Restated" financials on WIT are intact, and the StockCharts.com "point and figure" chart on Wipro appears to be still bullish to me.
For all of these reasons, I still maintain that
WIPRO (WIT) IS RATED A BUY
I hope that clears up the confusion.
Thanks again for dropping by and visiting! If you have any comments or questions, please feel free to leave them on the blog or email me at bobsadviceforstocks@lycos.com.
Bob
Wednesday, 1 August 2007
A Reader Writes "When would you be buying....? and ....your overall strategy?"
Hello Friends! Thanks so much for stopping by and visiting my blog Stock Picks Bob's Advice! As always, please remember that I am an amateur investor, so please remember to consult with your professional investment advisers prior to making any investment decisions based on information on this website.
One of favorite things about writing this blog is receiving emails from readers about things I write about. As I have mentioned before, I cannot answer every email I receive, but I do read them all and when I get a chance, enjoy responding right on the website.
This afternoon I received an excellent note from Balaji V. who wrote:
"Bob:
Sometime back, I saw your blog and I have been
visiting your blog now and then. Your way of analysing
the stocks is good. Your analysis are very simple,
easy to understand.
I came across an analysis for Wipro (WIT). Assuming
you have a 'permission' to buy (and we are in an
uptrend), when would you be buying this stock ? For
the last few sessions, the market is kind of zig
zagging, without a direction.
Also, is it possible for you to create a separate link
which explains your method ? I have gone through
several of your postings to find how you pick the
stocks and your overall strategy. But IMHO, if you
could put a separate page, it would really help people
like me, who is starting to invest (I understand and
respect your disclaimer).
TIA for your time.
Regards
Balaji V"
Balaji, thank you for writing! I would like to answer your questions in two different parts. First of all you write about WIPRO (WIT) a stock that I first wrote up on October 4, 2004, when the stock was trading at $20.86. WIT had a 2:1 stock spit September 2, 2005, giving me an effective pick price of $10.43. WIT closed today (8/1/07) at $14.42, for a gain of $3.99 or 38.3% since posting.
But your question is not about me. It is about you. And you asked me when i woud be buying the stock assuming I have a "permission" to do so.
You have made an excellent observation that the first part of deciding to purchase a stock for me is to have permission to do so. I get this "permission" by a partial sale at a gain at a targeted appreciation price in one of my existing holdings. Assuming I was not at my maximum portfolio size (I currently am at my maximum of 20), this would 'entitle' me to add a new position.
My own 'idiosyncratic' system doesn't allow me to buy shares of WIT just because i like it and the company is doing well. I restrict myself to stocks that are on the list of top % gainers in the market that particular day. If there are no stocks on the lists of top % gainers that meet my criteria then I wait an additional day. I usually can find a stock that works for me by the second day if not almost immediately. So I wouldn't be buying shares of WIPRO unless that particular stock was on the list of top % gainers the day I was selling shares at a gain. In which case, I could buy WIT if it was on the list. Otherwise I would be buying something else.
You don't have to follow that particular rule. I am not sure it is necessary. But I have been following that rule for the last several years.
Regarding my overall strategy, it would be a good idea to place my strategy on a separate page. Long-term I have even thought about writing a short book on my strategy. I am not sure if there would be any market for it at this time. I am still an unknown amateur but I think I have some good ideas.
My overall strategy could be expressed in the summary that it is important to decide WHAT to buy, WHEN to buy and WHEN to sell.
The WHAT to buy for me is to start with the top % gainers list, check the latest quarterly results, look at long-term results on Morningstar. I insist on revenue growth, earnings growth, free cash flow, stable outstanding shares, and a reasonable balance sheet. I look at a few valuation numbers, and like to see a chart that is basically moving higher. Each entry repeats this strategy over and over. I think if you follow a half-dozen entries or so it will become clearer to you.
WHEN to buy is easy as well.
Before I comment on that I want to point out that my portfolio has a relatively elastic number of positions. That is, I currently have 20 positions (different stocks) in my trading account. That is my maximum number of stocks I wish to own right now. (In earlier entries I have written about a maximum of 25 positions. But I chose to stop at 20 until my ever-present margin balance is erased).
I consider 10 positions to be in "neutral" posture. Ideally, one would have 505 cash and 50% equities at that point. My minimum is 1/2 of that or 5 positions, and my maximum is double that or 20 positions. When I sell a stock on "good news" I have a signal that is encouraging and I look to the 'top % gainers lists' for a new holding. On the other hand, stocks on declines or fundamental problems, I consider selling on 'bad news'. On those events I 'sit on my hands', essentially moving further into cash from equities.
My basic exceptions to this are at times when I am either at a minimum equity exposure (5 postions) in which case if I sell a holding on bad news, I plan on replacing that holding with a new name, or if I am at 20 positions and I sell a portion of a holding on good news; in that case, I also use the proceeds to add to my cash position (or pay down my margin).
The second point that shoud be made is that when I sell stocks on 'bad news' I sell the entire position. On good news, I sell only 1/7th of my holding (rounded down) so that I exercise a bias against poorly performing stocks. That is I sell my poorly performing stocks quickly and completely and sell my better performing stocks slowly and partially.
Let me talk a little about the WHEN I sell. First the good news part. I sell stocks at intervals of appreciation that I group by four sales. That is I have appreciation targets of 30, 60, 90, 120, then 180, 240, 300, 360, then 450, 540, 630, and 720, and then 840, 960% appreciation targets etc. At each of these levels, I sell 1/7th of my remaining shares.
And the bad news sales? First of all, I reserve the right to sell if any bad news is announced. And I reserve the right to define that bad news myself. This is regardless of the price move.
Based on price moves, I sell a stock after a purchase if the stock should decline 8% no matter how long I have held the stock. Sometimes they drop even a day or two later. If I have sold once on 'good news', which for me would be a 1/7th sale at a 30% appreciation target I push up my 'stop' to break-even. Otherwise, if I have sold a portion more than once, for instance three times with the highest sale point at 90%, then I sell ALL remaining shares if the stock should decline to 1/2 of that highest appreciation level. That is if the stock should decline to a 45% appreciation level (over my purchase) from a 90% appreciation level where a portion was sold, then my sale would be triggered and the entire position would be liquidated.
Anyhow, that's my strategy in a nutshell. If you review my past entries, I think you will get a better handle on my approach. Please let me know if you have additional questions. And I will think about that additional page.
Please feel free to leave comments or questions on the blog or email me directly at bobsadviceforstocks@lycos.com.
Bob
Posted by bobsadviceforstocks at 6:16 PM CDT
|
Post Comment |
Permalink
Updated: Wednesday, 1 August 2007 6:18 PM CDT
Team (TISI) "A Reader Suggests a Stock"
Hello Friends! Thanks so much for stopping by and visiting my blog, Stock Picks Bob's Advice! As always, please remember that I am an amateur investor, so please remember to consult with your professional investment advisers prior to making any investment decisions based on information on this website.
The market is quite volatile this past week or two and somehow managed to close higher this afternoon. In spite of that fact, my account dipped with weakness in my two oil-related stocks: BTJ and NOV.
Looking through the lists of the top % gainers in the market, I haven't been able to find anything that fits the blog just right. Maybe I am getting more cautious, or maybe my kind of stocks aren't participating in these 'rallies' after the sharp correction we have seen.
In any case, I wanted to use this entry to discuss a stock that came to me via Doug S. I don't think that Doug has any shares of this stock, but whenever I receive an email from anyone on the net, we all have to assume that they already have a position in this stock regardless of their comments. Doug has asked me to review Team (TISI) a couple of times now, and in fact, the stock looks rather intriguing and deserves a place on this blog. I do not own any shares or options on this stock.
TEAM (TISI) IS RATED A BUY
Let's take a closer look at this company and I shall explain why I happen to agree with Doug on this stock.
Doug S. wrote to me:
"TISI Your kind of stock" on June 27, 2007,
Then again, he wrote once more:
"TISI...Have you had a chance to look at it. I've no position and really reluctant to go long anything right now but would like your thoughts on it as it looks really intriguing. Interesting sector, great earnings and evidently very sound management.. Thanks"
O.K. Doug, here goes :). Your persistence has paid off! And thanks for bringing this stock to my attention. The numbers are indeed intriguing and it is indeed the kind of stock I like. Team (TISI) closed at $46.86 today, down $(.15) or (.32)% on the day. (In general, I choose to write up stocks making the top % gainers list, but with a 'request' like this, I shall make an exception :)).

What exactly does this company do?
According to the Yahoo "Profile" on Team, Inc., the company
 "...provides specialty maintenance and construction services primarily in the United States. The company offers leak repair services, which include repairs of leaks in pipes, valves, flanges, and other parts of piping systems and related equipment; and hot tapping services, which consists of hot tapping, Line-stop, and Freeze-stop services. Its emissions control services include identification, monitoring, data management, and reporting services for the chemical, refining, and natural gas processing industries; and field machining and technical bolting services, such as use of machining equipment to repair or modify machinery, equipment, vessels, and piping systems, as well as offers flange facing, pipe cutting, line boring, journal turning, drilling, and milling services."
How did they do in the latest quarter?
On July 25, 2007, Team, Inc. (TISI) reported 4th quarter 2007 results. Revenue for the quarter came in at $96 million, up 26% from the prior year same period. Net income was even stronger, with Team reporting a 52% increase of $6.1 million, compared to $4.0 million, last year, and earnings of $.63/diluted share, up 50% from the $.42/diluted share reported the prior year. In the same news story, the company announced a planned 2:1 stock split in the form of a 100% stock dividend payable August 29, 2007, for stockholders of record on August 15, 2007.
The company beat expectations of $.60/share on revenue of $85.1 million and then went ahead and raised guidance for the 2008 fiscal year to exceed $400 million with earnings of $2.00 to $2.20/share. Two analysts are reported to have estimates of $2.10/share on revenue of $364.3 million.
What about longer-term financial results?
Reviewing the Morningstar.com "5-Yr Restated" financials on Team (TISI), we can see that the company has been steadily increasing revenue from $74 million in 2002 to $260 million in 2006 and $298 million in the trailing twelve months (TTM).
Earnings have been a bit more erratic, climbing from $.50 in 2002 to $.70 in 2004, only to dip to $.20/share in 2005. Since 2005, earnings have been steadily increasing up to the current $1.50 in the TTM.
Free cash flow, which was negative at $(1) million in 2004 and $(8) million in 2005, turned positive at $2 million in 2006 and increased to $6 million in the TTM.
The balance sheet is solid with $5.0 million in cash and $84 million in other current assets. This total of $89 million in total current assets, when compared to the $31 million in current liabilities yields a current ratio of 2.71.
What about some valuation numbers?
Reviewing the Yahoo "Key Statistics" on TISI, we find that this company is a small cap stock with a market capitalization of only $417.85 million.
The trailing p/e is a moderate 28.49 and the forward p/e (fye 31-May-09) is a bit better at 17.95. Thus, the PEG ratio works out to a very nice .92 (5 yr expected). I am generally comfortable with PEG's at 1.0 to 1.5, which might be considered 'growth at a reasonable price' (GARP). Thus, at under 1.0, this company shows great value in terms of the growth in earnings expected.
Looking for some comparative valuation numbers from the Fidelity.com eresearch website, we can see that TISI's Price/Sales ratio (TTM) comes in at 1.30, compared to the industry average of 2.56, also showing 'good value'.
The company also shows excellent profitability with a Return on Equity (ROE) TTM of 20.68% compared to the industry average of 13.65% according to Fidelity.com.
Finishing up with Yahoo, we can see that there are 8.92 million shares outstanding, with 7.88 million of them that float. As of 7/10/07, there were 578,160 shares out short, representing 7.60% of the float or 12.3 trading days of average volume (the short ratio). Using my own "3 day rule" on short interest, this is quite significant and might result in a 'short squeeze' in the event of any good news or upward price movement of the stock.
No dividend is paid by the company per Yahoo, and no stock splits are recorded.
What does the chart look like?
Gorgeous! Let's look at the "point and figure" chart on TISI from StockCharts.com:
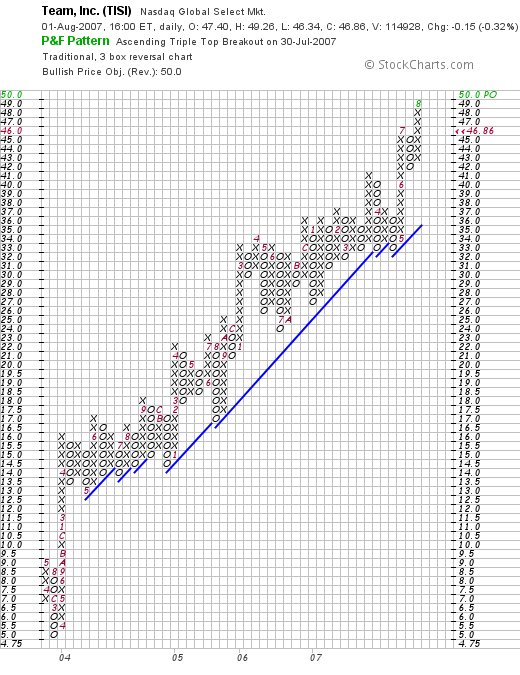
The chart shows the stock price, after a dip to the $5.00 level in March, 2003, breaking out to $16 in April, 2003, through April, 2004. Since that time the stock has essentially moved higher in an uninterrupted fashion to its current level which reached as high as $49 today!
Summary: What do I think?
Well, I have to admit that Doug has picked a really terrific stock for me to review. Reviewing some of the findings, we have a stock at its high that recently reported outstanding earnings and revenue growth that beat expectations at the same time. They raised guidance and announced a stock split!
Longer-term, revenue has been steadily increasing, earnings have been a bit erratic, free cash flow which was negative has moved nicely positive currently, and the balance sheet looks great.
The company has reasonable valuation with a p/e in the mid-20's, a PEG under 1.0 and a Price/Sales ratio under the industry average and a ROE that is higher than other similar companies.
On top of this there are loads of shares out short suggesting there are lots of investors out there that shall need to cover their bet that the stock is moving lower and who may well feel 'squeezed' with the upcoming stock split. Finally, the chart is beautiful. O.K., I admit it. This is a great stock, my kind of stock, and I wasn't the one to find it :).
Thanks Doug! And for all the rest of you, feel free to drop me a line, leave comments on the blog, or email me at bobsadviceforstocks@lycos.com if you have any comments, questions, or have other ideas I should be examining. I cannot answer or comment on all of the letters I receive, but I do read them all, and they all are greatly appreciated!
Thanks again for dropping by! If you get a chance, be sure and visit my Podcast site, or my Covestor site to see how my actual trading portfolio is performing, or even my Social Picks Page, where that website evaluates my stock picking ability relative to the whole world of stock pickers and investors :).
Bob
Sunday, 29 July 2007
"Looking Back One Year" A review of stock picks from the week of February 6, 2006
Hello Friends! Thanks so much for stopping by and visiting my blog, Stock Picks Bob's Advice! As always, please remember that I am an amateur investor, so please remember to consult with your professional investment advisers prior to making any investment decisions based on information on this website.
I wanted to get this review out before it is no longer the weekend :). Las week I reviewed stocks from the week of January 30, 2006. Let's take a look at the following week and see how stocks 'picked' during the week of February 6, 2006 worked out!
As I like to point out, this review assumes a 'buy and hold' strategy to investing with equal dollar amounts purchased in each of the stocks reviewed during the particular week and the overall performance calculated as an average of the individual performances. In practice, I employ a very different disciplined portfolio management approach involving quick sales of declining stocks and partial sales of appreciating stocks at targeted levels. This difference in strategy would certainly affect actual returns. However, for the ease of calculation, the 'buy and hold' approach has been adopted for reviews.
 On February 7, 2006, I posted Gardner Denver Machinery (GDI) on Stock Picks Bob's Advice when the stock was trading at $58.68. GDI declared a 2:1 stock split on June 2, 2006, making my effective pick $29.34. Gardner Denver closed at $41.16 on July 27, 2007, for a gain of $11.82 or 40.3% since posting.
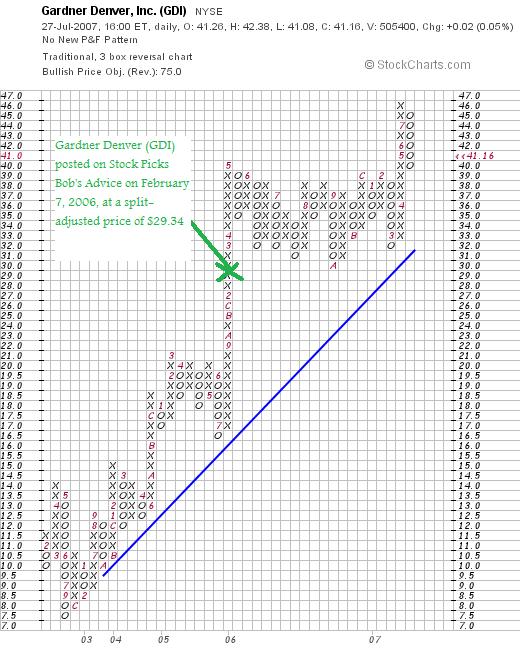

On July 25, 2007, GDI reported
2nd quarter 2007 results. For the three months ended June 30, 2007, revenue increased 10% to $459.9 million compared to $416.3 million in the year ago same period. Net income climbed 36% to $44.8 million from $33.0 million last year. Diluted earnings per share jumped 34% to $.83/share from $.62/share in 2006.
With this outstanding earnings report, a still strong Morningstar.com "5-Yr Restated" financials page,
GARDNER DENVER (GDI) IS RATED A BUY
 On February 8, 2006, I posted Stamps.com (STMP) on Stock Picks Bob's Advice when the stock was trading at $30.99. STMP closed at $11.70 on July 27, 2007, for a loss of $(19.29) or (62.2)% since posting.
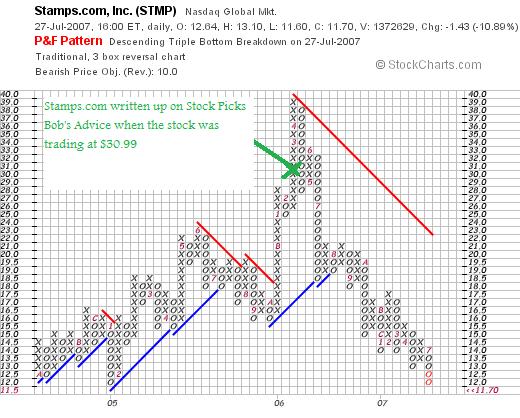
On July 26, 2007, Stamps.com (STMP) announced
2nd quarter 2007 results. Revenue for the quarter ended June 30, 2007, came in at $21.4 million, up 6% from revenue in the same quarter in 2006. Net income came in at $.13/share, down from $.17/share in the same period last year.
With the poor price chart, the decline in earnings in the latest quarter, and the decline in revenue per the Morningstar.com "5-Yr Restated" financials during the trailing twelve months,
STAMPS.COM (STMP) IS RATED A SELL
 On February 9, 2006, I posted Akamai (AKAM) on Stock Picks Bob's Advice when the stock was trading at $26.01.
AKAM closed at $36.71 on July 27, 2007, for a gain of $10.70 or 41.1% since posting.
On July 25, 2007, Akamai announced 2nd quarter 2007 results. Revenue for the quarter came in at $152.7 million up 52% from last year's $100.6 million. earnings came in at $21.6 million or $.12/share, up from $11.2 million or $.07/share in the same period last year. The company met earnings expectations of $.30/share and beat on revenue with analysts expecting $150.9 million per Thomson Financial.

With the strong earnings report, the strong Morningstar.com "5-Yr Restated" financials page, yet the weak price chart,
AKAMAI (AKAM) IS RATED A HOLD
So how did I do during this week in February, 2006? The three stocks averaged out to a gain of 6.4%.
Thanks so much for stopping by and visiting! If you have any comments or questions, please feel free to leave them on the blog or email me at bobsadviceforstocks@lycos.com.
Bob
A Reader Writes "I have a few questions...."
Hello Friends! Thanks so much for stopping by and visiting my blog, Stock Picks Bob's Advice! As always, please remember that I am an amateur investor, so please remember to consult with your professional investment advisers prior to making any investment decisions based on information on this website.
One of my favorite things about blogging is receiving letters from readers about what I write and trying to figure out the best way to respond. All of you are more than welcome to drop me a line at bobsadviceforstocks@lycos.com or just leave your comments right on the blog. I read all of the letters I get, and try to answer as many as possible, often on the blog! Of course, I am an amateur, so before acting on my personal opinions, I would once again suggest you consult with professionals to make sure that my approach is appropriate, timely and likely to be profitable for you.
Anyhow, I had a wonderful letter from Mark F. who wrote:
"Bob,
Not sure how I found your blog but I've been reading
it lately... I like your ideas... sounds like your
having a lot of success. I'm a beginning trader and I
think your ideas are pretty much in line with most
successful traders. I have a few questions, maybe you
could answer one of them or all?
1) Is your basic strategy shaped by ideas from Darvas,
Livermore, O'Neil? What books on trading do you
think influenced you the most?
2) How long did it take you to get to where you are?
Did you always have this strategy or did you have to
stumble along the way?
3) What percentage of your total trading assets do you
commit to the strategy on your blog? Is this the bulk
of your assets and if not, what strategy do you use
for that (or do you let a broker manage other
assets)?
4) What has been your average return over, say, the
last few years or so?
Thanks. Obviously the market looks dangerous now. I
hope you don't get too many stops hit as it seems you
are maintaining your long positions. I am in cash and
reevaluating my ideas after a mediocre year of trading
full-time."
Mark, thanks so much for writing! I hope that I may contribute to your own understanding about investing and you are more than welcome to learn from my own experience as I have also learned from others.
Let me try to answer your questions in order.
1. I am the first to give credit to all of the famous traders and authors you have mentioned. There is little in my approach to investing that hasn't been adopted from somebody else in some form or another.
Jesse Livermore: One of my favorite books is "Reminiscences of a Stock Operator" by Edwin Lefevre. This is allegedly a fictionalized biography of Jesse Livermore. Livermore was able to make large fortunes in the 1907 and 1929 crash. Some of his lessons were to "follow the tape" closely in observing the activity of the market.
Nicholas Darvas: Another classic text: "How I made $2,000,000 In The Stock Market" also sits my bookshelf at home. Darvas was a professional dancer who developed his belief of a technical approach to investing utilizing price "boxes" that stocks seemed to trade within. More of a technician, the book is a great read for an investor wishing to read about how another non-professional approached the market.
William J. O'Neil: Probably the strongest influence on my investing, the publisher of the Investors Business Daily as well as the author of "How To Make Money In Stocks: A Winning System in Good Times or Bad", O'Neil set out with a vast computerized investigation into the characteristics of stocks that later went on to make large moves higher. The creator of the CANSLIM system, O'Neil inspired me to think about stocks similarly, looking for characteristics that might be predictive of future price gains. Rather than looking at stocks at 'new highs', I have chosen to look at stocks moving higher on the top % gainers lists. I also have been sold on O'Neil's discipline of selling losing stocks quicklyat 8% losses. However, O'Neil relies more on technical charts on timing purchases and making sales than I do.
I would also like to add at least two additional authors who have inspired me in my own thinking and deserve as much credit as possible for any success I may achieve in this process.
Gene Walden: Mr. Walden, who I do not believe is as well known as some of the others discussed, is the author of "The 100 Best Stocks to Own in America". Unfortunately, I believe the last edition published was back in 2001. Walden had a point system with different numbers of 'stars' for each stock in different categories in terms of dividends, earnings, etc. This objective system for evaluating stocks inspired me to think about the specific criteria that I believed were important.
Robert Lichello: The author of "How to Make $1,000,000 in the Stock Market Automatically". I was pointed towards this book by my good friend Pete F. who practiced medicine and was also an avid investor. Lichello believed that an automatic system of responding to the stock market might be possible establishing two funds, one a mutual fund, and the other a money market fund (simplifying his more complex system), and then utilizing his AIM system to determine when to be transferring money between those two funds in response to market action. My own portfolio management approach borrows from this concept as I try to respond to market action by either looking for signals from my own portfolio to be buying new positions or moving proceeds into cash equivalents.
Over the years, I have read as many articles and books on investing as I have time for. Currently I am reading Practical Speculation by Victor Niederhoffer and would recommend that book to all of you interested in additional insight into investing.
I believe this answers your question on books that have influenced my trading.
2. You have asked me about my own journey to where I am. Elsewhere I have commented on the fact that I started investing in 1967 when I invested my first $300 in the market buying 5 shares of Global Marine. At that time, I purchased shares near the peak, only to see them slide down into the teens.
I also purchased shares through high school and college in very small amounts using a Merrill Lynch 'sharebuilder' account that I do not believe still is available. However, an independent ShareBuilder service is now in existence that serves the same purpose of allowing small investors to buy small dollar amounts of stocks and reinvest fractional amounts as well. I do not have any personal experience with them, but it recalls my own approach.
My own journey has been a bit irregular. In fact, my blogging has helped me develop the trading rules and discipline that I attribute to my current success. But I am humble enough to know that failure is only a trade or a market correction away.
Previously, I have 'shot from the hip' at stocks. Going with my gut. Buying and selling without much rhyme or reason. About 12 years ago I lost quite a bit on Jefferson Smurfit options. I was buying options and not writing them. I don't trade in options anymore.
Some time in early 2003 or late 2002, I started realizing that it was possible to buy stocks off the top % gainers list and make a profit. I worked that approach and started screening them for fundamental information that would help me identify stocks that might have an increased chance at success. I credit another friend, Dean W., who pointed me to the Morningstar.com website, where I learned how to use the "5-Yr Restated" financials page. I have incorporated that particular page and the information therein into my stock selection approach.
Robert A., a broker who had been advising my current stock club, introduced me to Point & Figure charting. After some time, I started really appreciating this approach to graphing price movement which now gave me the ability to appreciate the bull and bear movements in a stock price.
I learned the hard way about reinvesting stocks after selling them for losses only to see them lose again that I needed to have some timing device about when to be buying and when to be selling. I recall reading William O'Neil talking about the M in CANSLIM, the Market to determine when to be buying stocks. He commented somewhere about how it was important to observe that your own portfolio might be telling you that it was a bad Market when your own stocks were hitting sale points shortly after purchasing them.
This struck me as quite important in the process. So I learned to 'sit on my hands' after a sale on a loss, what I call "bad news".
But I needed a signal to be buying. Logically, if a sale on a loss was a good signal to be avoiding the market, it seemed that some sort of appreciation measurement might also signal me to be buying. I have used sales at gains to give me that signal. Initially I sold only 1/4 of my positions at each point, figuring that 1/4 of 4/3 would be 3/3 after a 33% appreciation. But continued 1/4 position sales started eroding the size of my positions. I reduced this to 1/6th and most recently down to a 1/7th position sale at targeted gains.
3. Percentage of my trading assets using this strategy? All of them. All 20 positions. But I also have some mutual funds in retirement accounts and also employ professionally management to handle other retirement assets.
I am seeking to learn from this account. Currently I am not willing to assume management over all of my assets. But this account is completely managed by this approach.
4. My average return? I have done well. But I do not know the exact numbers. And more recently I have been participating on Covestor, where you can check my Covestor Page which is usually linked along the left side of the blog. Unfortunately, I haven't calculated my return until my participation on Covestor. I would encourage you to go through the entries and about every month or so I have been writing up my holdings and valuation and gains and losses. Hopefully, with my Covestor participation, I shall be able to get a better handle on my actual % performance. This should be helpful to me as well as my readers.
Thanks so much for writing! I hope that I have responded to your questions in as complete and direct fashion as possible. Remember that I am an amateur investor, even though I have been investing for many years now, and also am still learning about how to go about this process. If you have any other questions or comments, please feel free to leave them on the blog or email me at bobsadviceforstocks@lycos.com.
Bob
Newer | Latest | Older


