Click ***HERE*** for my PODCAST ON BARNES GROUP (B)
Hello Friends! Thanks so much for stopping by and visiting my blog, Stock Picks Bob's Advice. As always, please remember to consult with your professional investment advisors prior to making any investment decisions based on information on this website.
 Earlier today I sold 33 shares (1/6th of my position) of Morningstar at a 30% gain level. This 'entitled' me, according to my trading strategy, to add a new position to my portfolio. With that nickel burning a hole in my pocket, I turned to the list of top % gainers on the NYSE to find a suitable candidate for purchase. A new stock, Barnes Group (B), appeared to fit the bill and I went ahead and purchased 180 shares earlier today for my trading account. As I write, B is trading at $39.11, up $2.06 or 5.56% on the day.
And what does Barnes Group actually do?
 According to theYahoo "Profile" on Barnes, the company
"...engages in the manufacture of precision metal components and assemblies; and distribution of industrial supplies. It operates through three segments: Barnes Distribution, Associated Spring, and Barnes Aerospace."What drove the stock higher today, as is often the case, was an outstanding 4th quarter earnings report. Revenue for the quarter came in at $276.4 million, a 10% increase from the $251.6 million reported in the same quarter last year. Income for the quarter was $11.6 million, or $.47/share, up approximately 200% from $3.9 million or $.16/share last year. In addition, to complete the "trifecta", the company raised guidance with expectations of earning $2.50 to $2.60/share in 2006. Currently analysts are expecting $2.44/share for the year.
How about longer-term?
 Looking at the "5-Yr Restated" financials on Barnes from Morningstar.com, we can see the steady increase in revenue from $.7 billion in 2000 to $1.0 billion in 2004 and $1.1 billion in the trailing twelve months (TTM).
Earnings during this period have been a bit erratic, dropping from $1.90/share in 2000 to $1.01 in 2002, increasing to $1.49/share in 2003, dipping to $1.40/share in 2004 and increasing to $2.14/share in the TTM. The company has been paying a dividend during this period increasing it from $.79/share in 2000 to $.80/share in 2004 and $.82/share in the TTM.
Free cash flow has been positive with $35 million reported in 2002, increasing to $45 million in the TTM.
The balance sheet as presented on Morningstar looks reasonable with $31.5 in cash and $354.9 million in other current assets. This is balanced against current liabilities of $247.8 million, giving B a current ratio of just under 1.5. In addition, the company is reported to have $369.4 million in long-term liabilities.
And what about some valuation numbers?

Looking at Yahoo "Key Statistics" on Barnes, we can see that this is a mid-cap stock with a market capitalization of $924.95 million. The trailing p/e is reasonable (imho) at 18.10 with a forward p/e (fye 31-Dec-06) of 15.90. With the growth expected, the company based on 5 yr expected earnings, comes in with a PEG of 1.70.
Barnes is in the "Misc. Fabricated Products" industrial grup. Within this group, according to the Fidelity.com eResearch website, Barnes is reasonably valued with a Price/Sales ratio of 0.8. Only Shaw Group (SGR) is more reasonable with a Price/Sales ratio 0f 0.7. Topping this group in richness in valuation is Ceradyne (CRDN) with a Price/Sales ratio of 4.2, followed by American Science and Engineering (ASEI) at 4.1, Parker Hannifin (PH)at 1.1, and Masco Group (MAS) at 1.0.
Going back to Yahoo for some additional numbers, we can see that the company has only 23.84 million shares outstanding with 16.16 million of them that float. Of these, 743,540 shares were out short as of 1/10/06, or 3.60% of the float, for a short ratio of 6.1. With this many shares out short, today's stock rise on good news good well represent (imho) a bit of a squeeze on the short sellers.
As I noted earlier, the company does pay a dividend, which in today's low interest environment is actually significant, at $.88/share or 2.40% yield on the common shares. The last stock split reported per Yahoo was a 3:1 split in April, 1997.
And what does the chart look like?
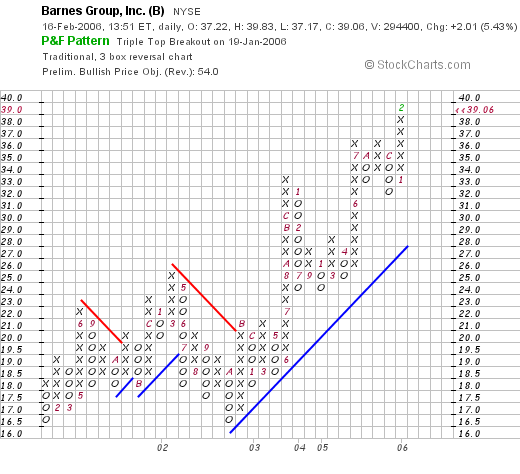
Examining the "Point & Figure" chart on Barnes from Stockcharts.com:

We can see that this stock was trading sideways between January, 2001, when it was at the $16.50 level, until January, 2002, when it peaked at the $25 level. The stock backed off again to the $16.50 level in October, 2002, and since then, has been moving steadily higher to the current $39.06 level.
So what do I think? Well, I liked the stock enough to buy some shares :). This is in an industrial area that is not well represented in my trading portfolio. I like the latest earnings report, the increased guidance, and the steady growth in revenue the past five years. Earnings have indeed been a bit erratic, but have been strong recently. Valuation is nice with a p/e is the teens to twenties, and the PEG is close to 1.5. The Price/Sales ratio is near bottom of its group, and the chart looks strong.
That's my update! Thanks again for visiting. If you have any comments or questions, please feel free to leave them on the blog or email me at bobsadviceforstocks@lycos.com.
Bob
Updated: Sunday, 19 February 2006 2:54 PM CST


