Stock Picks Bob's Advice
Saturday, 15 May 2004

Hello Friends! Thanks so much for stopping by! The weekend is the time for me to review my past selections: The "good, bad, and the ugly." (apologies to Clint Eastwood.) As always, please remember that I am an amateur investor and that you should do your own investigation on all of the stocks discussed here and consult with your investment advisors to make sure investments are suitable and timely for your investment needs!

The first stock picked on Stock Picks Bobs Advice (whatever am I going to do about THAT missing apostrophe...oh well...) was St Jude Medical (STJ) which
was selected for the blog on 5/12/03 at $55.30. STJ closed on 5/14/04 at a price of $74.74 for a gain of $19.44 or 35.2%.
What about recent news? On April 21, 2004, STJ
announced 1st quarter 2004 results. Net sales were up 24% (about 6% of that was due to currency exchange effects), to $549 million from $441 million the prior year. Earnings for the first quarter were $96 million, a $16 million or 20% increase over net earnings of $80 million. Per diluted share this came out to $.52 in 2004 a 21% increase over the $.43/diluted share in the first quarter of 2003 ended March 31st.

On May 14, 2003, J2 Global Communications (JCOM)
was selected for the blog at $32.60. They had a 2:1 split so the adjusted pick price was $16.30. JCOM closed at $22.96 on 5/14/04 for a gain of $6.66 or 40.9%.
On April 19, 2004, JCOM
reported 1st quarter results. Revenues for the quarter ended March 31, 2004, increased 51% to $22.9 million from $15.2 million in the same quarter the prior year. GAAP Net Earnings per diluted share increased 25% to $.25/share from $.20/share the prior year. JCOM appears to be doing just fine!

HealthExtras was
selected for Bobs Advice on 5/14/03 at a price of $5.70/share. HLEX closed on 5/14/04 at $14.00/share for a great gain of $8.30 or 146%.
HealthExtras
reported 1st quarter 2004 results on April 28, 2004. Revenues totaled $110.5 million, a 21% increase over last year's revenues of $91.7 million. Net income came in at $3.4 million or $.10/share, a 79% increase over first quarter 2003 earnings of $1.9 million or $.06/share. HLEX appears to be right on track!

AMN Healthcare Services (AHS) was
posted on Bob's Advice on 5/15/03 at a price of $10.05. AHS closed at $15.21 for a gain of $5.16 or 51.3% during this period.
On April 28, 2004, AHS
reported 1st quarter 2004 results. Revenue was $161.3 million, down from $199.8 million for the first quarter of 2003. Net income came in at $4.6 million or $.15/share compared to $12.4 million or $.29/share the prior year. However, these results were slightly better than the PRIOR quarter...so the market did not punish the stock price much at all. My judgement on this one is out. Certainly this stock does not fulfill the requirements of this blog to be picked as a possible purchase, but then again, we have a nice gain on the pick (although I do NOT own any shares)...so if I owned it, I would be sitting tight...letting the market price dictate my actions.

On May 16, 2003, I
picked Agree Realty (ADC) for the blog at a price of $23.41. ADC closed 5/14/04 at $23.05 for a loss of $(.36) or (1.5)%.
On April 23, 2004, ADC
reported 1st quarter 2004 results. Since this is a REIT, the results are not typical for some of our other companies: funds "from operations" increased 17.4% to $4.3 million compared to $3.6 million the prior year. Diluted funds from operation were $.60/share compared to $.71/share the prior year. Net income, however, increased 29% to $2.9 million or $.45/share compared with net income the prior year of $2.2 million or $.50/share. Clearly there are more shares out this year diluting some of the income. Overall this is a satisfactory if not exciting result imho.
So how did we do that first week in May when I set out to start picking stocks for this blog? Of the five stocks picked a year ago, I recorded gains (Of these stocks I currently only own some shares of STJ in my trading account, and I believe I have some shares of HLEX in a managed account that I do not decided purchases or sales) ranging from +35.2% to +146%, with a single loss of (1.5)%, for an average performance of a gain of 54.4%. This was a GREAT week and a GREAT start for this blog!
Thanks so much for stopping by! I have added some of these LOGOS to add some spice to the site. Please let me know if it slows down the loading too much! If you have any questions, comments, or words of encouragement, please feel free to leave them right here on the blog or email me at bobsadviceforstocks@lycos.com
Have a great Sunday everyone!
Bob
Posted by bobsadviceforstocks at 3:29 PM CDT
|
Post Comment |
Permalink
Updated: Sunday, 16 May 2004 12:13 AM CDT
Friday, 14 May 2004
May 14, 2004 Panera Bread (PNRA)
Hello Friends! Thanks for stopping by! As always, please remember to do your own investigation of stocks and consult with your financial advisors before acting on any information discussed on this website.
The market is acting anemic but at least it is not plummeting as I write. In fact, in my trading account, I have not hit any sell points. In some ways, this has been a problem as I have had to "pony-up" some cash to deal with the high margin level. Today Panera Bread (PNRA) hit the list of top gainers.

As I write, PNRA is trading at $35.63, up $2.18 or 6.52% on the day. According to Yahoo, PNRA "...operates a retail bakery-cafe business and franchising business under the concept names Panera Bread Company and Saint Louis Bread Company."
On May 13, 2004, Panera reported
1st quarter 2004 results. Company revenue jumped 29% to $130 million from $101 million in 2003. (Franchise revenue jumped 25% from $199 million to $248 million in the same period). Earnings per diluted share increased 24% to $.31/share for the 16 weeks ended April 17, 2004. On a comparable store basis, sales jumped 1.8% during the period. An interesting note on this company, is the fact that it was formed in 1981 under the name Au Bon Pain Co. In 1993, Au Bon Pain purchased the Panera Bread assets. By 1999, the Au Bon Pain division was sold and the name of the company was switched to Panera Bread.

Reviewing Morningstar.com
"5-Yr Restated" financials, we can see that the revenue was dropping through 2000 from $249.7 million in 1998 to a bottom of $151.4 million in 2000. At this time, the company was transitioning to the Panera Bread Concept, and revenues have grown steadily since then to the current $334.2 million in trailing 12 month revenue.
Earnings, which also bottomed at $(.03)/share in 1999, have improved steadily each year since with $.91 reported in the trailing twelve months.
Free cash flow has improved from a break-even $0 in 2000, to $29 million in the trailing twelve months. Looking at the balance sheet on the same Morningstar site, we can see that the company has $45.1 million in cash and $34.0 million in other current assets, enough to pay off BOTH the $34.7 million in current liabilities and the $6.7 million in long-term liabilities.
Looking at
"Key Statistics" from Yahoo, we can see that the Market Cap is a mid cap $1.06 Billlion, the trailing p/e is 32.86 with a forward p/e of 21.44 (fye 27-Dec-05). The PEG on this stock is very nice at 0.87, with a price/sales of 2.60.
Yahoo reports 30.11 million shares outstanding with 23.10 million of them that float. There ARE 7.09 million shares out short which is a BIG short level, representing 8.96 trading days or 30.68% of the float as of 4/7/04. The move upwards in the stock price today MIGHT be due to all of this pent up demand for shares by the shorts! No cash dividend is paid, and the last stock split reported by Yahoo was in January, 2002.
If we look at the stockcharts.com point & figure chart:
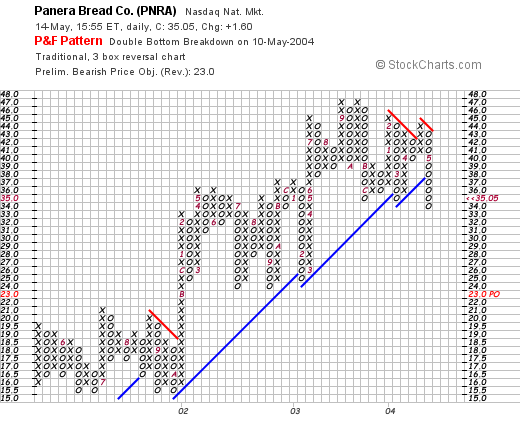
We can see that the stock HAS actually demonstrated some weakness lately...having broken through the support level at $38.
What do I think? First of all, I do NOT own any shares nor do I have any options or leveraged positions. That being said, PNRA actually looks pretty interesting to me. The valuation is nice with a PEG under 1.0. I would rather have a bit stronger level of same store sales...better than the 1.8% reported. However, with all of the short interest chasing shares, we may just see a nice price rise!
Thanks so much for stopping by! If you have any questions, comments, or words of encouragement, please feel free to email me at bobsadviceforstocks@lycos.com.
Bob
Thursday, 13 May 2004
New Blog Links Category
O.K. so I am a year old. That doesn't sound like I should be old enough to drive a car! Anyhow, I am FINALLY getting around to reading OTHER PEOPLE's blogs. Alright I have been trying to get other people to read MY blog...but I have resigned myself to a level or readership somewhere under stellar. So I am starting to realize there are a lot of AWESOME blogs out there. Came across
sugarmama as a link from a link or something or other. By the time I am into three links back....well I can never remember EXACTLY where I started. Anyway, I am going to try to expand upon my endless stock comments and start to talk to you about more than stocks....well a little anyhow!
Have a great evening everyone, and come back and visit often now!
Bob
May 13, 2004 MapInfo (MAPS)
Hello Friends! You know for a 'one-year-old', I really feel pretty mature. I mean, with this BLOG one year old (lol), and here I am WRITING at twelve months, reading, telling awful jokes...heck...I am even potty-trained! Thanks so much for stopping by. As always, remember to do your own investigation on all stocks discussed on this blog and consult liberally with your investment advisors...as I am an AMATEUR investor who just likes to discuss ideas and look at stocks. If you have any questions, comments, or words of encouragement, please feel free to post them right here....just click under the posts where it says "comments" and start a discussion...or email me at bobsadviceforstocks@lycos.com and I will probably respond to you right in the blog!
As I noted in my last post, the stock market really does appear to be looking for a support level in here. I find it hard to believe that the only thing that will move this stock market higher is BAD economic news...news that will not mean that interest rates will be raised. Quite frankly, with the rates at 40 year lows, what can we expect but some normalization of interest rates in here. If rates get so high that they seem to be shutting down the economy....well then that would be something different...but all of this hysteria, in my opinion, of the first rate rise...well is this overdone or what? Anyhow....
Was looking over the big movers today and came across MapInfor Corp. (MAPS).

MapInfo is having a fairly nice day today trading at $10.50, up $.56 or 5.63% as I write. According to Yahoo.com, MapInfo "...is a global software company that designs, develops, licenses, markets and supports location-based software and data products, application development tools and industry-focused solutions." I guess the key to all of that 'jargon' is the term "location-based". Sort of like a map!

On April 21, 2004, MAPS announced 2nd quarter 2004 results: revenue came in at $31.4 million vs $27.1 million in the prior year same quarter. Net income came in at $1.07 million vs a loss of $(742) thousand last year. On a per share basis, this was $.07/share vs $(.04)/share last year.
If we look at Morningstar.com "5-Yr Restated" financials, we can see a slightly erratic growth in revenue from $74.4 million in 1999 to $114.0 million in the trailing twelve months. Earnings peaked in 2000 at $.54/share dropping to a loss of $(.16)/share in 2002 and have been improving each year since. Free cash flow which was $(1) million in 2001, $(7) million in 2002, turned positive in 2003 at $3 million and has improved to $6 million in the trailing twelve months.
The balance sheet on Morningstar.com shows $35.4 million in cash and $27.8 million in other current assets, easily covering the $41.5 million in current liabilities, with enough left over to pay off the long-term liabilities of $17 million if that were necessary or desirable.
Looking at "Key Statistics" from Yahoo, we see that this is a SMALL cap stock with a market cap of $206.46 million. The trailing p/e is steep at 50.10 (as the company is just returning to profitability), but the growth is so FAST that the forward p/e (fye 30-Sep-05) is only 21.04. Thus the PEG, which isn't cheap, isn't nearly that bad at 2.21. The price/sales is 1.65.
Yahoo reports 19.62 million shares outstanding with 19.60 million of them that float. Thus, the insider holdings are only 0.13%. There are only 180,000 shares out short representing 0.92% of the float or only 0.677 trading days as of 4/7/04, so this is not much of an issue. No cash or stock dividends are reported on Yahoo.
Looking at technicals with a "point and figure" graph:
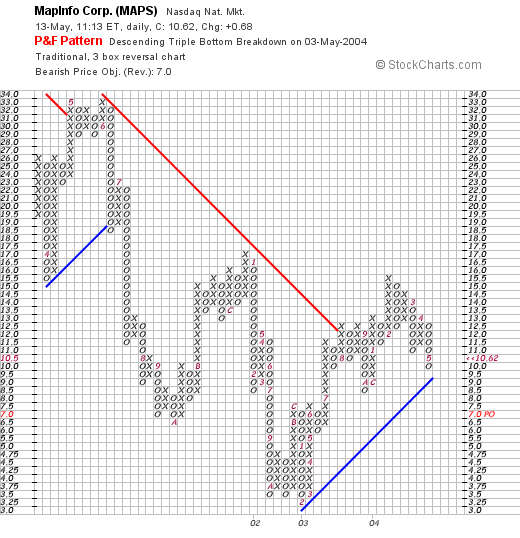 We can see that MAPS was trading lower throughout 2002, bottoming out in January, 2003, at about $3/share, Since that time, it has moved higher, breaking through a resistance level at about $12 in August, 2003, to its current level around $10.
By the way, I do NOT own any shares nor have any leveraged position on this issue. What do I think? I prefer stocks a little higher than $10.50/share. With an 8% stop, I seem to hit this point over and over in the lower-priced investments. Other than that, I like this stock! The valuations isn't bad, the technicals look nice, and the recent earnings report is encouraging.
If you have any questions, comments or words of encouragement, please feel free to email me at bobsadviceforstocks@lycos.com
Bob
P.S., meanwhile, enjoy a slice of birthday cake: a beautiful picture from one of my favorite artists: Wayne Thiebaud!

Wednesday, 12 May 2004
Technicals on NASDAQ
Hello Friends! I do NOT have any stocks to present today. Saw that SEM has fallen apart...and my stock club has that one so out it will need to go. Was looking at the NASDAQ chart:
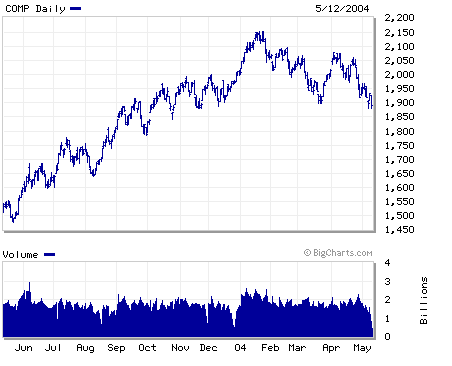
in my humble opinion, this 1890 level appears to be a critical area that may determine whether more selling will develop. I do not claim to be a brilliant technician, but what do you think? It looks like if this level holds, this would represent some sort of "double bottom" and we may see some upside from here. Otherwise, look out below!
On the other hand, the NYSE composite index graph:
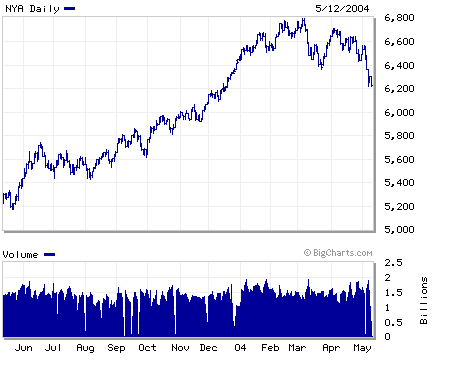
looks like it has broken through the prior support level, so I am not sure what to make of it except where is the next level of support?
I don't make many technical observations, so if there are better technicians out there, just email me at bobsadviceforstocks@lycos.com, and we can share your comments with everyone!
Bob
Tuesday, 11 May 2004
"Happy Birthday Stock Picks Bobs Advice"
Hello Friends! It is hard to believe it but tomorrow marks ONE YEAR of blogging for me! If you have any birthday greeting, comments, or words of encouragement, please email me at bobsadviceforstocks@lycos.com and I will share them with the rest of the blognerhood. (Is that a WORD???). Anyhow, Again THANKS for stopping by and I look forward to another year of blogging and posting out here in cyberspace!

Bob
May 11, 2004 Rayovac (ROV)
Hello Friends! As always, I am greatly appreciative of your visit here today. Remember to always do your own investigation of any stock discussed on this website and please consult with your investment advisors to determine whether investments are appropriate and timely for you!

Rayovac (ROV) made the lists today for one of the top performers on the NYSE. This stock is not a "perfect" fit on this blog, but I like it better than most of the others on the gainers list today. ROV closed today at $27.20, up $2.10 or 8.37% on the day in a market that rebounded from the past week's correction. According to Yahoo, Rayovac "...is a global branded consumer products company with market positions in two product categories: consumer batteries and electric personal care products."
On April 22, 2004, Rayovac
announced 2nd quarter 2004 results. Second quarter net sales were $278 million, up from $202.3 million the prior year. Sales were positively impacted by the

acquisition of the Remington acquisition. Net income for the quarter ended March 28, 2004, came in at $2.6 million compared to $300,000 the prior year. (Pro forma net income came in at $6.7 million vs. last year's $4.5 million). Pro format earnings per share came in at $.19/share, a 36% increase over $.14/share the prior year. This is a more accurate result than the reported eps of $.08/share vs $.01/share the prior year. Pro forma, as I understand it, takes into consideration acquisitions in comparing results to give a more realistic review of the results. In either case, earnings and revenue were up nicely!
If we look at a
"5-Yr Restated" financials from Morningstar.com, we can see what appears to be fairly flat revenue performance between 1999 and 2002, and then substantial growth in revenue in 2003 and in the trailing twelve months.
Earnings/share have also been erratic but have improved nicely the last 18-24 months. Free cash flow, per Morningstar, was $(2) million in 2001, improved to $51 million in 2002, $50 million in 2003, and $73 million in the trailing twelve months.
The balance sheet shows $25.6 million in cash and $609.7 million in other current assets, enough to easily cover the $392.4 million in current liabilities and to pay off some of the $917.3 million in long-term liabilities.
Looking at
"Key Statistics" from Yahoo.com, we can see that the company is a "mid-cap" corporation with a market cap of $926.89 million. The trailing p/e is nice at 22.30, but the forward p/e (fye 30-Sep-05) is even nicer at 12.95. The PEG is beautiful at 1.06, with a price/sales VERY reasonable at 0.72.
There are 34.08 million shares outstanding with 29.60 million of them that float. Interestingly, there are 2.64 million shares out short as of 4/7/04, representing 8.93% of the float or 5.723 trading days. This is a large short balance, in my opinion, whenever the days short exceeds 3 or 4. We may be witnessing a bit of a short "squeeze" in here!
Yahoo reports NO cash dividend and no recent stock split.
If we take a look at a "Point and Figure" chart from ROV:
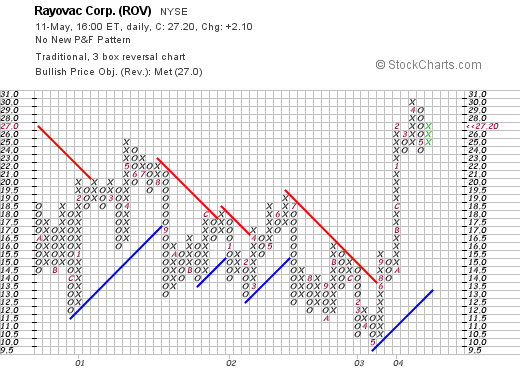
, it appears that the stock price which has been heading "sideways" or lower since mid-2000, broke through a resistance level on an upwards move in June, 2003, at a bout $14 and has been heading higher since! It looks nice to me imho.
What do I think? I kind of like this battery and shaver company. I do not own any shares or options, but IF I were in the market to buy some shares, this one might be on my short list. The recent growth in revenues and earnings demonstrates the capability of this management team to integrate acquisitions in a positive fashion (I believe that the term used is that the acquisitions have been "accretive" to earnings!). I like the PEG at just over 1.0. The Price/sales UNDER 1.0 is nice. And the large short interest is an interesting plus. I only wish they paid a dividend (LOL) or that their revenue growth record was a bit longer than just the past couple of years.
Thanks again for stopping by! If you have any comments, questions, or words of encouragement, please feel free to email me at bobsadviceforstocks@lycos.com
Bob
Monday, 10 May 2004
May 10, 2004 Hewitt Associates (HEW)
Hello Friends! O.K. it is another LOUSY day in the market. But what can I say about that? My stocks in my trading account are doing lousy. I had to send over some cash from my savings as the margin was getting a bit borderline and I didn't want a forced sale....that should teach me. But none of our stocks have yet hit a sell point...so I will hang in there. And I am also SORRY about not posting a retrospective review this weekend. Boy am I ever apologizing today!

It is interesting that Hewitt Associates (HEW) made the list earlier today with a gain of $.61 or 2.06% at $30.26 as I write. But the numbers look nice so here goes! According to Yahoo, HEW "...is a global provider of human resources outsourcing and consulting services." I do not own any shares nor do I have any leveraged positions.
On May 4, 2004, HEW
announced Second Quarter 2004 results. For the second quarter ended March 31, 2004, revenue was up 14% to $546.3 million from $478.1 million last year. Net income came in at $30.4 million or $.31/diluted share, vs $23.5 million or $.24/diluted share the prior year, for an increase of 29%.
If we look at the
"5-Yr Restated" financials on Morningstar.com, we can see that revenue has grown steadily from $1.1 billion in 1999 to $2.1 billion in the trailing twelve months. Earnings have increased from $.97/share in 2003 to $1.12 in the trailing twelve months. Free cash flow has been solid, with HEW generating $261 million in 2001, $192 million in 2002, $235 million in 2003, and $211 million in the trailing twelve months.
Looking at the balance sheet on Morningstar.com, HEW reports $250.7 million in cash and $529.8 million in other current assets, easily covering the $455.8 million in current liabilities and making a "dent" in the $454.1 million in long-term liabilities if needed.
How about valuation? Looking at
"Key Statistics" from Yahoo, we can see that the market cap of HEW is $2.98 billion. The trailing p/e is 25.57 with a forward (fy3 30-Sep-05) p/e of 19.73. The PEG isn't too bad at 1.44, and the price/sales is nice at 1.35.
Yahoo reports 98.24 million shares outstanding with 38.40 million of them that float. Currently there are only 192,000 shares out short representing only 0.50% of the float or 1.466 trading days...so this does not appear to be an issue. Yahoo does not show any dividend on this stock, nor any recent stock split.
Looking at a point & figure graph on HEW:
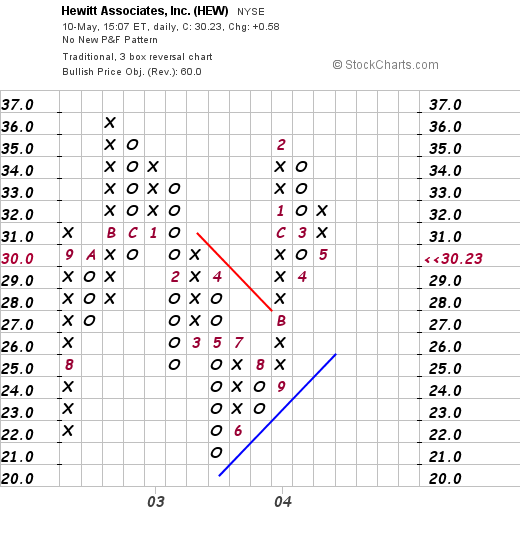
we can see that HEW has been trading recently above its support level but longer-term mostly moving in a rather horizontal fashion (how is that for a 'sophisticated' technical analysis...lol)....moving sideways...but NOT looking overextended to me!
Overall, this is a nice selection in a company that is not overvalued, has steady growth, and reasonable technicals. No dividend though...if that is important!
Thanks so much for stopping by! If you have any questions, comments, or words of encouragement, please feel free to email me at bobsadviceforstocks@lycos.com
Bob
Friday, 7 May 2004
May 7, 2004 Provide Commerce (PRVD)
Hello Friends! Thanks so much for stopping by! I am so glad it is Friday, it is sunny outside, and not too hot. A beautiful day in Wisconsin! I hope you are having nice weather also. As always, I must insist that you do your own investigation on all stocks discussed on this blog before making any decisions, and please discuss this with your investment advisors as I am an amateur investor and cannot be expected to advise you regarding the suitability and profitability of any investment idea!
And THAT was a LOT of exclamation marks!!!

I came across Provide Commerce (PRVD) today while scanning the lists of greatest % gainers on the NASDAQ. I do not own any shares nor do I have any leveraged or option positions. PRVD is currently trading at $20.16, up $1.95 or 10.71% on the day. According to Yahoo, Provide "...operates an e-commerce marketplace for perishable goods that delivers products direct from the supplier to the customer." I guess that includes flowers...and not to remind anyone or anything but guess what is coming up this next Sunday....Mother's Day!...so this is our Mother's Day stock :)
On May 4, 2004, PRVD announced record
third quarter 2004 results. Net sales increased from $28.8 million in the quarter ended March 31, 2003, to $40.7 million in the same quarter this year. Net income, on a fully diluted basis, increased from $.22/share in 2003 to $.30/share this year, same quarter.
If we take a look at the Morningsar.com
"5-Yr Restated" financials we can see a rapid increase in revenue from $3.9 million in 1999 to $88.7 million in 2003. Net income has turned positive from negative and the free cash flow which was $(4) million in 2001, improved to $0 in 2002 and $7 million in 2003, with $6 million reported in the trailing twelve months.
Balance sheet-wise, this company looks fine, in my humble opinion, with $6.5 million in cash and $2.1 million in other current assets with $7.7 million in current liabilities and NO long-term liabilities at all.
Looking at
"Key Statistics" from Yahoo we can see that this is a SMALL cap stock with a market cap of only $228.66 million. The trailing p/e is only 17.20, but the forward p/e is 32.87 (???). That part I just don't follow. As the PEG is only 1.30 and price/sales at 1.87. Probably some kind of error that forward p/e...(?).
Yahoo reports 11.40 million shares outstanding with 4.30 million of them that float. There are only 11,000 shares out short as of 4/7/04, representing 0.5 trading days or just 0.26% of the float...so this is not an issue. No dividend is reported and Yahoo does not report any stock dividend either recently.
Taking a look at a chart:
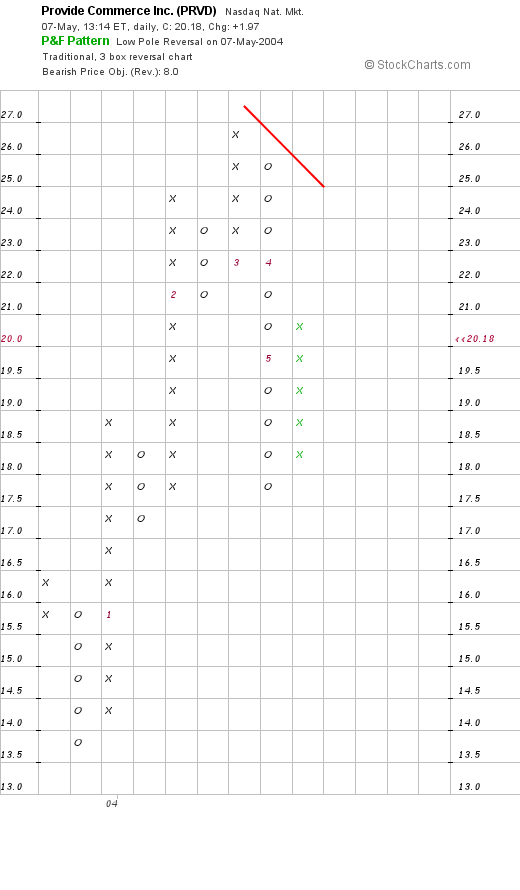
We really do not have much of a chart to hang our hats on but overall the stock price is appreciating, but currently under a resistance level. Maybe you can get a better take on this one.
What do I think? The stock is interesting to me. The results and rapid revenue growth are impressive, the balance sheet is nice, and the valuation does not seem unreasonable. And it is ALMOST Mother's Day. So Happy Mother's Day all you MOMS out there!
If you have any comments, questions, or words of encouragement, please feel free to email me at bobsadviceforstocks@lycos.com
Bob
Thursday, 6 May 2004
May 6, 2004 Diebold (DBD)
Hello Friends! It is NOT a very pretty day on the street today. For the record, as I write, the DJIA is trading at 10,220.82, down 90.13 points (0.87%), and the NASDAQ is trading at 1,931.76, down 25.50 points (1.30%). Nothing much to write home about I guess unless you are short the market.

Diebold (DBD) is having a nice day today. It is interesting that the latest news on Diebold has been marginal at best in the "media" with stories running about problems with their voting machines in California. However, their business is otherwise doing just fine, and hopefully they will get the bugs out of the electronic machines and still get the business without any lawsuits, etc. This is certainly a potential risk for this firm.

As I am writing, DBD is trading at $46.95, up $1.26 on the day or 2.76%.
On April 20, 2004, Diebold announced
first quarter 2004 results. Revenue grew 21.5% to $498.3 million, diluted earnings per share grew 11.1% to $.40/share compared to $.36/share in the first quarter of 2003.
Taking a look at
"5-Yr Restated" financials on Morningstar.com, we can see that revenues have grown steadily from $1.3 billion in 1999 to $2.1 billion in the trailing twelve months. Earnings, however, have been a bit erratic, with $1.85 reported in 1999, climbing to $1.92 in 2000, dropping to $.93 in 2001 and then climbing steadily since then to $2.40 in the trailing twelve months. DBD has also raised its dividend each year from $.60/share in 1999 to $.68 in the trailing twelve months.
Free cash flow has also been solid, increasing from $86 million in 2001 to $137 million in 2003.
The balance sheet is also very clean with $176.1 million in cash and $929.1 million in other current assets, more than enough to cover both the current liabilities of $618.7 million and the long-term liabilities of $133.6 million.
What about valuation? If we take a look at
"Key Statistics" on Yahoo.com, we can see that DBD has a market cap of $3.42 Billion, a trailing p/e of 19.28 and a forward p/e of 15.44. These numbers are not overly inflated especially in light of latest quarterly results. However, the PEG at 1.74 is under 2.0, but I would prefer to see it closer to 1.00 to say that the stock is cheap. Price/sales also at 1.52 isn't bad but not actually cheap.
Yahoo reports 72.91 million shares outstanding with 71.30 million of them that float. There are 1.65 million shares out short, which is pretty high at 2.31% of the float or 3.233 trading days...as of 4/7/04...and is up from the prior month's level of 1.19 million shares out short. Is suspect that a lot of investors are betting on the voting machine problems becoming a true fiasco!
The company does pay a small dividend of $.74/share yielding 1.62%, and the latest stock split reported on Yahoo was a 3:2 split in February, 1997.
What about technicals? Taking a look at a recent "Point and Figure Chart" on DBD:
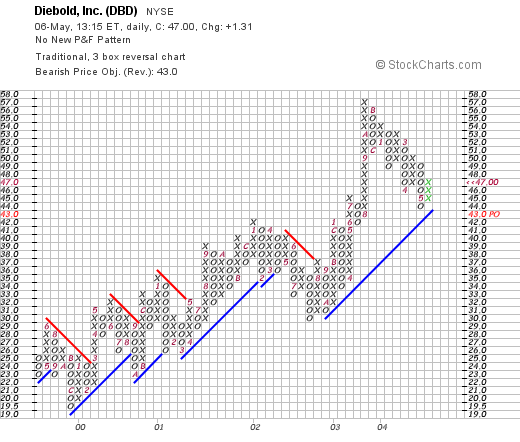
we can see that the company is still trading above its support level and unlike some of the stocks we have looked at, really appears not to be over-extended...at least in my humble opinion!
Where does that leave us? I guess the big question on this stock is the voting machine question. However, this is a company that is big in ATM's and likely will benefit from a large voting machine business in the future as the quirks get figured out. Meanwhile, the valuation isn't bad, the earnings are nice, and the company even pays a dividend! I do not own any shares or have any leveraged positions in this issue. As always, please discuss this and all stock market investment ideas with your investment advisors and do your own investigation as I am an amateur investor!
Thanks again for stopping by! If you have any questions, comments, or words of encouragement, please feel free to email me at bobsadviceforstocks@lycos.com
Bob
Newer | Latest | Older
 Hello Friends! Thanks so much for stopping by! The weekend is the time for me to review my past selections: The "good, bad, and the ugly." (apologies to Clint Eastwood.) As always, please remember that I am an amateur investor and that you should do your own investigation on all of the stocks discussed here and consult with your investment advisors to make sure investments are suitable and timely for your investment needs!
 The first stock picked on Stock Picks Bobs Advice (whatever am I going to do about THAT missing apostrophe...oh well...) was St Jude Medical (STJ) which was selected for the blog on 5/12/03 at $55.30. STJ closed on 5/14/04 at a price of $74.74 for a gain of $19.44 or 35.2%.
 On May 14, 2003, J2 Global Communications (JCOM) was selected for the blog at $32.60. They had a 2:1 split so the adjusted pick price was $16.30. JCOM closed at $22.96 on 5/14/04 for a gain of $6.66 or 40.9%.
 HealthExtras was selected for Bobs Advice on 5/14/03 at a price of $5.70/share. HLEX closed on 5/14/04 at $14.00/share for a great gain of $8.30 or 146%.
 AMN Healthcare Services (AHS) was posted on Bob's Advice on 5/15/03 at a price of $10.05. AHS closed at $15.21 for a gain of $5.16 or 51.3% during this period.
 On May 16, 2003, I picked Agree Realty (ADC) for the blog at a price of $23.41. ADC closed 5/14/04 at $23.05 for a loss of $(.36) or (1.5)%.


 As I write, PNRA is trading at $35.63, up $2.18 or 6.52% on the day. According to Yahoo, PNRA "...operates a retail bakery-cafe business and franchising business under the concept names Panera Bread Company and Saint Louis Bread Company."

 MapInfo is having a fairly nice day today trading at $10.50, up $.56 or 5.63% as I write. According to Yahoo.com, MapInfo "...is a global software company that designs, develops, licenses, markets and supports location-based software and data products, application development tools and industry-focused solutions." I guess the key to all of that 'jargon' is the term "location-based". Sort of like a map!
 We can see that MAPS was trading lower throughout 2002, bottoming out in January, 2003, at about $3/share, Since that time, it has moved higher, breaking through a resistance level at about $12 in August, 2003, to its current level around $10.
 in my humble opinion, this 1890 level appears to be a critical area that may determine whether more selling will develop. I do not claim to be a brilliant technician, but what do you think? It looks like if this level holds, this would represent some sort of "double bottom" and we may see some upside from here. Otherwise, look out below!
 looks like it has broken through the prior support level, so I am not sure what to make of it except where is the next level of support?
 Rayovac (ROV) made the lists today for one of the top performers on the NYSE. This stock is not a "perfect" fit on this blog, but I like it better than most of the others on the gainers list today. ROV closed today at $27.20, up $2.10 or 8.37% on the day in a market that rebounded from the past week's correction. According to Yahoo, Rayovac "...is a global branded consumer products company with market positions in two product categories: consumer batteries and electric personal care products."
  acquisition of the Remington acquisition. Net income for the quarter ended March 28, 2004, came in at $2.6 million compared to $300,000 the prior year. (Pro forma net income came in at $6.7 million vs. last year's $4.5 million). Pro format earnings per share came in at $.19/share, a 36% increase over $.14/share the prior year. This is a more accurate result than the reported eps of $.08/share vs $.01/share the prior year. Pro forma, as I understand it, takes into consideration acquisitions in comparing results to give a more realistic review of the results. In either case, earnings and revenue were up nicely!
 It is interesting that Hewitt Associates (HEW) made the list earlier today with a gain of $.61 or 2.06% at $30.26 as I write. But the numbers look nice so here goes! According to Yahoo, HEW "...is a global provider of human resources outsourcing and consulting services." I do not own any shares nor do I have any leveraged positions.
 we can see that HEW has been trading recently above its support level but longer-term mostly moving in a rather horizontal fashion (how is that for a 'sophisticated' technical analysis...lol)....moving sideways...but NOT looking overextended to me!
 I came across Provide Commerce (PRVD) today while scanning the lists of greatest % gainers on the NASDAQ. I do not own any shares nor do I have any leveraged or option positions. PRVD is currently trading at $20.16, up $1.95 or 10.71% on the day. According to Yahoo, Provide "...operates an e-commerce marketplace for perishable goods that delivers products direct from the supplier to the customer." I guess that includes flowers...and not to remind anyone or anything but guess what is coming up this next Sunday....Mother's Day!...so this is our Mother's Day stock :)
 We really do not have much of a chart to hang our hats on but overall the stock price is appreciating, but currently under a resistance level. Maybe you can get a better take on this one.
 Diebold (DBD) is having a nice day today. It is interesting that the latest news on Diebold has been marginal at best in the "media" with stories running about problems with their voting machines in California. However, their business is otherwise doing just fine, and hopefully they will get the bugs out of the electronic machines and still get the business without any lawsuits, etc. This is certainly a potential risk for this firm.
 we can see that the company is still trading above its support level and unlike some of the stocks we have looked at, really appears not to be over-extended...at least in my humble opinion!