


Hello Friends! Thanks for stopping by! As always, please remember to do your own investigation of stocks and consult with your financial advisors before acting on any information discussed on this website.
The market is acting anemic but at least it is not plummeting as I write. In fact, in my trading account, I have not hit any sell points. In some ways, this has been a problem as I have had to "pony-up" some cash to deal with the high margin level. Today Panera Bread (PNRA) hit the list of top gainers.
 As I write, PNRA is trading at $35.63, up $2.18 or 6.52% on the day. According to Yahoo, PNRA "...operates a retail bakery-cafe business and franchising business under the concept names Panera Bread Company and Saint Louis Bread Company."
 On May 13, 2004, Panera reported 1st quarter 2004 results. Company revenue jumped 29% to $130 million from $101 million in 2003. (Franchise revenue jumped 25% from $199 million to $248 million in the same period). Earnings per diluted share increased 24% to $.31/share for the 16 weeks ended April 17, 2004. On a comparable store basis, sales jumped 1.8% during the period. An interesting note on this company, is the fact that it was formed in 1981 under the name Au Bon Pain Co. In 1993, Au Bon Pain purchased the Panera Bread assets. By 1999, the Au Bon Pain division was sold and the name of the company was switched to Panera Bread.

Reviewing Morningstar.com "5-Yr Restated" financials, we can see that the revenue was dropping through 2000 from $249.7 million in 1998 to a bottom of $151.4 million in 2000. At this time, the company was transitioning to the Panera Bread Concept, and revenues have grown steadily since then to the current $334.2 million in trailing 12 month revenue.
Earnings, which also bottomed at $(.03)/share in 1999, have improved steadily each year since with $.91 reported in the trailing twelve months.
Free cash flow has improved from a break-even $0 in 2000, to $29 million in the trailing twelve months. Looking at the balance sheet on the same Morningstar site, we can see that the company has $45.1 million in cash and $34.0 million in other current assets, enough to pay off BOTH the $34.7 million in current liabilities and the $6.7 million in long-term liabilities.
Looking at "Key Statistics" from Yahoo, we can see that the Market Cap is a mid cap $1.06 Billlion, the trailing p/e is 32.86 with a forward p/e of 21.44 (fye 27-Dec-05). The PEG on this stock is very nice at 0.87, with a price/sales of 2.60.
Yahoo reports 30.11 million shares outstanding with 23.10 million of them that float. There ARE 7.09 million shares out short which is a BIG short level, representing 8.96 trading days or 30.68% of the float as of 4/7/04. The move upwards in the stock price today MIGHT be due to all of this pent up demand for shares by the shorts! No cash dividend is paid, and the last stock split reported by Yahoo was in January, 2002.
If we look at the stockcharts.com point & figure chart:
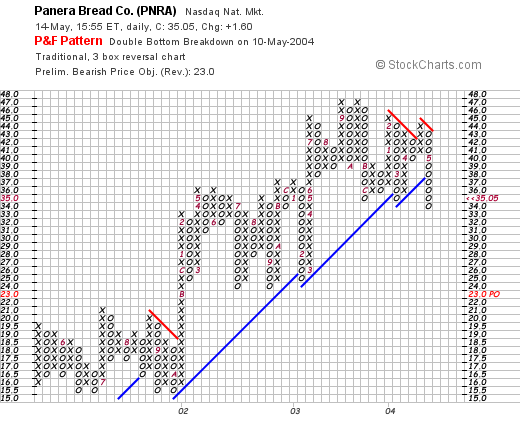
We can see that the stock HAS actually demonstrated some weakness lately...having broken through the support level at $38.
What do I think? First of all, I do NOT own any shares nor do I have any options or leveraged positions. That being said, PNRA actually looks pretty interesting to me. The valuation is nice with a PEG under 1.0. I would rather have a bit stronger level of same store sales...better than the 1.8% reported. However, with all of the short interest chasing shares, we may just see a nice price rise!
Thanks so much for stopping by! If you have any questions, comments, or words of encouragement, please feel free to email me at bobsadviceforstocks@lycos.com.
Bob