Stock Picks Bob's Advice
Sunday, 25 July 2004
"Looking Back One Year" A review of stock picks from the week of July 14, 2003

Hello Friends! The weekend is almost over and I haven't done my homework. Well here it is, so let's take a look at the week of July 14, 2003, and see how the stock selected would have performed if we had employed a "buy and hold" strategy. Of course, our results would have been affected by 8% loss stops and sales on gains, but for simplicity, let's just see what has happened to the stock prices since posting. As always, please remember that I am an amateur investor, so please consult with your professional investment advisors before taking any action based on information on this website.

On July 14, 2003, I
posted Echelon (ELON) on Stock Picks at a price of $17.05. ELON closed at $7.39 on 7/23/04, for a loss of $(9.66) or (56.7)%.
Echelon
reported 2nd quarter 2004 results on July 15, 2004. Revenues for the quarter ended June 30, 2004, were $28.3 million, compared to revenues of $31.3 million for the same period in 2003, a decline of about 10%. Earnings came in at $1.5 million or $.04/share for the quarter ended June 30, 2003, compared to a loss of $(6.3) million, or $(.16)/share last year. The improving earnings picture is encouraging (did I pick this stock last year with a loss?), but the declining revenue is of some concern, as is the stock price!

On July 14, 2003, I
posted Fidelity National Financial (FNF) on July 14, 2003, when it was trading at $33.66. FNF closed at $36.29 on 7/23/04 for a gain of $2.63 or 7.8%.
FNF
reported 2nd quarter 2004 results on 7/22/04. Net earnings for the quarter ended June 30, 2004, came in at $222.1 million or $1.26/diluted share down from $248.3 million or $1.62/diluted share last year. These are not the kind of results I would like to see in stocks picked on this blog!
 Capital One Financial (COF) was posted
 on
Stock Picks Bob's Advice on 7/14/03 at $55.00. COF closed at $67.97 on 7/23/04 for a gain of $12.97 or 23.6%.
On July 21, 2004, COF
reported 2nd quarter 2004 results. Revenues for the quarter rose to $2.11 billion from $1.99 billion last year. Quarterly earnings came in at $407.4 million or $1.65/share up from $286.2 million or $1.23/share a year ago. In addition, they exceeded the $1.50/share that analysts were looking for, so this was a nice result for COF!

On July 15, 2003, I
posted Harley Davidson (HDI) on Stock Picks at $43.68. HDI at $59.75 on 7/23/04 for a gain of $16.07 or 36.8%.
HDI
reported 2nd quarter results on July 14, 2004. Revenue in the quarter grew 8.9% to $1.33 billion from last year's $1.22 billion. Net income came in at $247.2 million or $.83/share up from $202.2 million or $.66/share last year. These were solid results for Harley-Davidson.

I
posted EPIQ Systems (EPIQ) on Stock Picks at $19.62 on 7/15/03. EPIQ closed at $14.33 on 7/23/04 for a loss of $(5.29) or (27)%.
On April 27, 2004, EPIQ
announced 1st quarter results. For the quarter ended March 31, 2004, revenue increased 85% to $26.0 million from $14.1 million. Net income, however, dropped to $2.0 million from $2.7 million with diluted earnings per share coming in at $.11 vs. $.15/share. Would rather see robust earnings to go along with the strong revenue growth!

On May 26, 2004, Pharmaceutical Resouces was
renamed Par Pharmaceutical Companies, Inc. (PRX). PRX was
selected for Stock Picks on 7/16/03 at a price of $52.83. PRX closed on 7/23/04 at $33.19 for a loss of $(19.64) or (37.2)%.
On April 29, 2004, PRX
announced 1st quarter 2004 results. Revenues grew 99% to $211.8 million and net income rose 35% to $30.2 million with diluted earnings per share rising 27% to $.85. These were great results. However, on July 7, 2004, PRX
announced an adverse court decision that it lost against Pfizer (PFE) on the issue of Latanaprost. Latanaprost is the #1 medication world-wide for the treatment of glaucoma.

On July 17, 2003, I
picked Closure (CLSR) for Stock Picks at $23.40. CLSR closed at $17.90 on 7/23/04 for a loss of $(5.50) or (23.5)%.
On July 22, 2004, CLSR
announced 2nd quarter 2004 results. For the quarter ended June 30, 2004, revenue increased 33% to $11.3 million from $8.5 million the prior year. Net income jumped 52% to $2.5 million or $.17/share vs. $.12/share the prior year. Within this apparently GREAT news story, was a comment that the next quarter should see revenue in the range of $9.5-$10.5 million, and per share diluted earnings of $.12-$.15. This is a decrease from the current quarter and the "streeet" didn't like what it heard!
Hang in there! Just three more to go!

ITT Educational Services (ESI) was
posted on Stock Picks on 7/17/03 at $36.13. ESI closed at $33.43 on 7/23/04 for a loss of $(2.70) or (7.5)%.
On July 21, 2004, ESI
reported 2nd quarter 2004 results. Revenues increased 20.9% to $150.9 million from $124.8 million in 2003. This was done with an 18.4% increase in student enrollment. Net income increased 42% to $14.0 million from $9.8 million. Fully diluted Earnings per share increased 42.9% to $.30 from $.21 the prior year. Unfortunately, ESI continues to be subject to a Department of Justice and SEC investigation. This is depressing the stock price!

On July 18, 2003, I
selected Hansen Natural (HANS) for Stock Picks at $5.38. On 7/23/04, HANS closed at $18.71, for a gain of $13.33 or 248%. (This one selection SAVED the week for me for this review!).
On May 6, 2004, HANS
reported 1st quarter 2004 results. Gross sales increased 39.9% to $38.7 million from $27.7 million a year earlier. Net income for the quarter ended March 31, 2004, increased 244.9% to $2.2 million from $633,000 last year, or on a per share basis $.19/share vs. $.06/diluted share last year.
These were GREAT results!

On July 18, 2003, I
selected Bio-Rad Laboratories (BIO) for Stock Picks at $60.15. BIO closed at $53.00 on 7/23/04 for a loss of $(7.15) or (11.9)%.
On May 6, 2004, BIO
reported 1st quarter 2004 results. For the quarter ended March 31, 2004, net sales were $266.6 million, up 8.4% compared to $246.0 million the prior year. This was largely due to currency effects, so sales were actually flat. Net income for the quarter was $22.0 million, compared to $26.4 million the prior year. On a fully diluted basis, earnings came in at $.83/share this year compared to $1.01/share last year. These are not very exciting results and the stock price reflects this.
So how did we do during this week a little over a year ago? Of these ten stocks, there were 6 stocks declining and four rising over the one-year period. The HUGE gain of 248% of HANS pulled up the averages for an average gain of 15.2%.
Thanks so much for stopping by! If you have any questions, comments, or words of encouragement, please feel free to email me at bobsadviceforstocks@lycos.com .
Bob
A Reader Writes, "I'm still struggling with stock selections and exits."
Hello Friends!
I have my review to look forward to this afternoon, but first I went and checked my mailbox, and was delighted to find that there was mail on Sunday! I love getting letters. I figure it shows that those statistics on "hits" on my counter are real people and not just robots wandering by. Please DO remember that I am an amateur investor, so please check with your professional investment advisors before acting on any information on this website.
Gus writes,
Hi Bob,
I'm still struggling with stock selections and exits. Nearly all my stocks have blown up on me for every reason you can name. I have lost confidence in holding a stocks and take profits on a 5-10% gain , thereby losing the real winners. Your comments would be appreciated.
Do you use any technical analysis for entry or exits, If so which ones?
When do you enter as soon as you identify a stock that meets your criteria or next day open?
Do you use market orders?
stocks that you have sold after a huge gain would you be buying them back after they base on another breakout.?
All your stocks meet IBD rating system. Do you use IBD in your stock selections?
Do you select only from strong groups?
I feel that you must have a very good knowledge of market trends and cycles to be able to hold your stocks through several pullbacks. How do you manage to hold on? Do you use a market timing method/service?
Is there a way to screen/prequalify a list of stocks and place on a watch list to buy on break out?
You have the best stocks in your portfolio. There are many choices it still comes down to picking the one. What has the final say when several that meet your criteria are breaking out daily?
So many break outs that I entered on have been the high even on stocks that had a good base.
Do you buy all the stocks in your picks list?
Do you short?
Any time you carry to spare in answering these questions is appreciated,
Gus Now THAT was a lot of questions. I will try to answer all of them or at least comment on your questions. Please remember that I am NOT a professional investment advisor so am not qualified to give you individual advice, but I can give you my opinions on the questions you raise.
1)
"Do you use any technical analysis for entry or exits, if so which ones?" There are two things I do when picking an actual stock to purchase that might be described as technical analysis, including looking at stocks with strong price momentum that day....I scan the lists of top percentage gainers for candidates, and I like to look at a point & figure chart from stockcharts.com. Quite frankly, I am not much of a technician. I would just rather purchase stock simply in a company which has a stock price which appears to be moving higher. I do not use moving averages or trading bands to time purchases or sales.
2.
"When do you enter as soon as you identify a stock that meets your criteria or next day open?" When I identify a stock I wish to purchase I generally enter the order as a market order online with Fidelity. I do not use limit orders.
3.
"Stocks that you have sold after a huge gain would you be buying them back after they base on another breakout?"Fortunately, I do own some stocks that have made huge gains (although they have been giving back much of their gains lately). I do not have a plan of ever unloading a stock on a big gain. That is not my strategy. I sell small portions of a stock on pre-set sell-points as the stock rises. Like so many investors, I try to pull the cost of my initial investment out of a swiftly climbing stock, but I do this very slowly so as not to penalize a stock that is performing for me. I like to sell 1/4 on a 1/3 gain....(1/4 of 4/3 is 1/3, leaving 3/3..or original investment $'s still invested), and sell 1/4 again for four consecutive times at each 30% gain (30, 60, 90, 120). After that I plan to sell 1/4 on 60% gain sites allowing the investment to start growing. If I do sell a stock on fundamental bad news or on a decline (again I have sell-points on the downside, (8)% if I have never sold any at a gain, 0% if I have sold once, 30% if have sold at 60%, and then selling points would be at 1/2 of the highest % gain point. This allows a 50% retracement, giving greater lee-way for the strongest performing stocks in the portfolio.
I certainly would consider rebuying a stock if I sold it on some bad news or a pull back if it hit the top percentage gainers list, I was in the market for a new purchase, and it made sense. But generally, I have been buying new stocks that I have not owned before.
4.
"All your stocks meet IBD rating system. Do you use IBD in your stock selections?"As I have mentioned elsewhere in this blog, I have been greatly influenced by IBD and William O'Neill's CANSLIM techniques. I have adapted some of these ideas to what I am doing. I use the 8% loss limit that O'Neill discusses. However, O'Neill generally recommends adding to existing positions to concentrate your holdings when you identify a performing stock. I tend to be a bit more conservative and like to sell a little bit as it rises. I share O'Neill's views that stocks that will perform the best ultimately are a function of their underlying earnings performance. I do subscribe to IBD and enjoy reading some of their articles, but my lists of stocks come from my own investigations. I have been pleased to see that many of the stocks discussed have shown up on the IBD list of 100 top stocks each Monday. I think I am doing something right!
5.
"Do you select only from strong groups?"Not intentionally :). That is, when I am in a position to purchase a new stock for my portfolio, which occurs after I have sold a portion of an existing position at a gain, I apply my criteria to the lists of stocks making nice moves THAT day. After I have found a couple of candidates, I use my "seat of the pants" judgment to pick my stock to purchase. I may be using groups strength intuitively, but I do NOT check group strength when selecting a stock to purchase.
6. "How do you manage to hold on? Do you use a market timing method/service?" This Market Timing thing concerns me greatly. One of the books I have read, was "How to Make $1,000,000 in the Stock Market Automatically!" by Robert Lichello. I am sure you can find a copy cheap on Amazon. Mr. Lichello started me thinking about market timing. I do NOT use any service but am trying to have my portfolio direct me how to behave in relation to the market.
Mr. Lichello thought it wise to have two funds, equity and cash, and to move funds back and forth between these two accounts automatically as a function of the market activity. Now I don't do that. But I very much want to avoid compounding my losses as much as possible. If the market is declining I would like to have a system in place which will gradually reduce my exposure to equities. At the same time, if the market is improving, I want to do the opposite.
What I do is very simple and is actually far too slow to respond adequately. I think I might be able to do better (?).
Simply put, I have a portfolio of stocks. You can see what I own on my trading portfolio. I need to update it. My profits have SHRUNK these past two weeks...and my paper gain is down to $20,000 from $30,000 just a few weeks ago...so I am not immune to the market action. Now what I do is try to LISTEN to my portfolio. That is something O'Neill points out in his book. Your portfolio is talking to you :). When I sell a stock at a loss, I do NOT replace the stock (I used to jump right back in with another issue). I WAIT, I sit on my hands, until another stock in my portfolio has had a portion sold at a GAIN. Thus, as the market declines, I gradually sell off positions, and wait until the market is strong enough to provide me with gains.
I have been using margin which is just TERRIBLE in a declining market and WONDERFUL in a climbing market. If I use 50% equity as fully invested (50% margin), then I would consider 50% cash to be my fully "dis-invested" level. That is, continuing to reduce exposure 'automatically' until down to 50% cash and 50% equity. I figure that will mean a portfolio of 6 positions as a MINIMUM. At that point, I WILL replace issues if they are sold at a loss.
7.
"Is there a way to screen/prequalify a list of stocks and place on a watch list to buy on a break out?"That is a good question. I am sure there is a way....and I do review LOTS of stocks on my blog. What these review do is to familiarize myself with these "players" in the market. When I AM in the market to purchase a new position, and one of them shows up on the top % gainers lists, I tend to buy what I am familiar with. It doesn't always work out as my recent experience with DJ Orthopedics shows... But this pre-screened list and break-out technique is simply not what I do. It doesn't mean it isn't a good idea...it might be. I just don't do it.
8.
"You have the best stocks in your portfolio." Thank you. I consider this a form of "investment natural selection", or survival of the fittest :). I sell LOTS of stocks from my portfolio. Just look at all the footnotes on my trading portfolio. Thus, for a stock to stay, it cannot decline much after the purchase. That they may have a large gain, is indicative that the homework I did before making a purchase was on the mark.
9.
"There are many choices it still comes down to picking the one. What has the final say when several that meet your criteria are breaking out daily?"Now THAT is an excellent question. First of all I don't buy ANYTHING no matter how pretty it looks unless my "market timing system" tells me it is ok to purchase a stock. (Meaning I just recently sold a portion at a gain!). When there are several, I tend to try to buy the stock that I have heard of before, or perhaps have posted before on the blog. I like stocks over $10, I like the MOST CONSISTENT earnings and revenue grower. If they have INCREASING free cash flow, and have an excellent balance sheet all the better. If they pay a dividend too why not. And I would like to see a nice point & figure graph. I go through all of these things, but when it comes right down to it, I have to be "intuitive". Sometimes I make a good pick, but I don't worry too much, if it pulls back EVEN THE NEXT DAY....out if goes.
10.
"So many break outs that I entered on have been the high even on stocks that had a good base."The failure of the market to follow through on stock moves recently is indicative of a poor investment climate right now. Do not fight the market. Sit on your hands. Wait. Increase you cash and maintain some level of equity until the market tells you to add positions.
11.
"Do you buy all the stocks in your picks list?"Absolutely not. I wish I had bought TASER when I listed it...but I literally have reviewed hundreds of stocks and only purchased a handful of them for my trading portfolio.
12.
"Do you short?"There have been many brilliant people that have made fortunes going short on issues. However, I do not short. I go long. I have invested in options in the past and lost my shirt. I am concentrating on what I think I know, identifying strong stocks for potential capital gains.
Good luck Gus, I hope this answers your questions. If you have any other questions, please feel free to email me at bobsadviceforstocks@lycos.com .
Bob
Friday, 23 July 2004
"Trading Transparency" GPRO
Hello Friends! The BEAR is growling and I can feel it gnawing on my portfolio!

A few moments ago, my shares of Gen-Probe (GPRO) hit and went past the 8% loss limit and out the shares went. I had purchased 300 shares of GPRO at $41.30 on 5/27/04, and now just sold my 300 at $37.567 for a loss of $(3.733) or (9)%. That puts me down to 20 positions...down 2 in the last 2 days. I will not be purchasing any new positions until I sell a portion of my existing holdings at a gain.
How many positions will I go down to in the worst scenario. I was thinking about this today. Since my goal is 25 positions, and currently am using margin, in the current situation, I would go down to about 12 positions to eliminate margin and to 6 positions to go to 50% cash. Thus, 6 will be the bottom limit. Hopefully, I will not get there! However, if I do, I will replace my positions to maintain a 50% exposure to equities.
Thanks so much for stopping by! If you have any comments or questions please feel free to email me at bobsadviceforstocks@lycos.com and please remember that I am an amateur investor and you should consult with your professional investment advisors prior to taking any action based on information on this website.
Bob
Thursday, 22 July 2004
"Trading Transparency" LWAY
Just a quick note to update you on Lifeway Foods (LWAY). A few moments before the close of trading today, I reviewed the holdings and realized that LWAY was moving into the loss column. Since I had already sold a portion of my holdings at a gain, I needed to avoid allowing the remaining position to move into a loss situation and it was sold a couple of cents below the purchase price. Details to follow.
Thanks so much for stopping by! If you have any questions or comments, please feel free to email me at bobsadviceforstocks@lycos.com .
Bob
Wednesday, 21 July 2004
"Handling Bad News" HIBB
Hello Friends! I usually don't post much before the market opens but we have a problem child in the
Current Trading Portfolio.

Yesterday, after the close of trading, Hibbett (HIBB)
announced reduced expectations for the 2nd quarter. They said, per the article, that "a sluggish June period, along with a slowdown in sales of fitness equipment and licensed apparel, would cut into profits." They announced that they would soon be reporting same store sales growth of 2-3% (instead of 5-6% earlier expectations) and $.13-$.15/share for the quarter (instead of the $.18-$.20 earlier expected). The stock is NOT doing well in after-hours trading, apparently trading at least at one point down almost 16%. (Based on the prior close of $22.56, this would amount to an almost $3.50 loss BEFORE it even opens. What should we do?
First, let's see what the current holdings are and out situation with this company. As of yesterday's close, I own 172 shares of HIBB that were acquired on 3/6/03 for a cost basis of $9.74/share for an unrealized gain of $2,204.43 or 131.54%. I don't want to lose all of my gain, but then again, I do not want to panic and sell prematurely.
The strategy that I utilize is to sell stocks slowly when we have made gains. I have been doing this all along with HIBB. On 2/7/03, I made my first purchase of HIBB, buying 100 shares at $22.10 for a cost of $(2,224.95). On 3/6/03, I purchased 100 shares of HIBB at $21.71 for a cost of $(2,185.95). Thus, my total cost for all of my HIBB shares was originally $(4,410.90.)
HIBB has had two stock splits since I have owned these shares, the first a 3:2 on July 16, 2003, and a 3:2 on August 19, 2004. I have sold my HIBB shares multiple times already: 50 shares 5/30/3 for proceeds of $1,423.48, and a gain of $311.00, 50 shares 9/4/03 for $1,256.94 with a gain of $515.29, 40 shares 10/15/03 for $1,072.74 and a gain of $483.44, and finally 20 shares 4/5/04 for proceeds of $766.58 and a gain of $475.12. Thus I have already SOLD $4,519.74 of HIBB (remember, my COST was $4,410.90), and have taken gains of $1,784.85. I am not at very much risk of losing ANY principle as I have taken OUT my original investment after four sales as planned.
Still what do I do? If my last sale was at a 120% gain target (presumably), I should sell HIBB if my gain gets to a 60% level....allowing it to retrace 1/2 of the gain...that is my strategy at least.
With a current cost basis of $9.74, a 60% gain would be 160% of $9.74 or $15.58. This is my new sale target on the downside.
Now THAT was a long analysis. If the stock is indeed trading down 15% in after-hours that would get us to about $19/share. We have a little room to go before I pull the plug!
Thanks so much for stopping by! Always remember that I am an AMATEUR investor, so please consult with your professional investment advisors prior to taking any action on stocks discussed on this website. If you have any questions, comments, or words of encouragement, please email me at bobsadviceforstocks@lycos.com .
Bob
Tuesday, 20 July 2004
A reader writes "Try Bloomberg"
Hello Friends! This is a short note for the evening. Oscar wrote a little earlier today:
"
Try Bloomberg.com - look at the symbol of your stock and read thru the boxes"

Here is the link for the
Bloomberg Website. I am quite honestly not real familiar with this website, but it appears to work a lot like Yahoo Finance. I guess the bottom line is that it doesn't really matter which financial information provider you have, as long as it is reputable (as Bloomber is!)...and it provides you with enough data to make a decision.
Thanks so much for your comments. If you have any other questions or comments, please feel free to email me at bobsadviceforstocks@lycos.com .
Bob
July 20, 2004 Florida Rock Industries (FRK)
Hello Friends! Thanks so much for stopping by. I got caught by the JUNO sell-off today....sometimes better to avoid those micro-cap stocks that are overly-volatile. (Some day I may learn I hope.) Please remember that I am an AMATEUR investor, so please consult with your professional investment advisors prior to making any decisions based on things you read on this website. Also please do your own investigation of all stocks discussed to verify information posted.

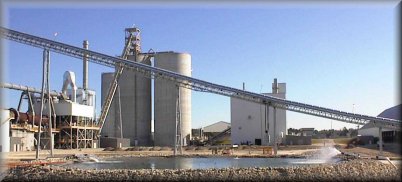
Florida Rock Industries (FRK) is having a very nice day today trading currently at $42.21, up $2.04 or 5.08% on the day. I do not own any shares nor do I have any options in this stock. According to the
Yahoo "Profile" on FRK, they operate "...principally in three business segments: construction aggregates, concrete products and cement and calcium products." I believe this is our first "rock" stock.
On April 20, 2004, FRK announced their second quarter 2004 results. (I do not have a link for this as it came off of their website). Consolidated total sales for the quarter increased 40% to $228.6 million from $163.6 million the prior year. Net income came in at $24.5 million or $.56/share up from $16.3 million or $.37/diluted share a more than 50% increase. These are very nice results.
If we look a bit longer-term at
"5-Yr Restated" financials on Morningstar.com, we can see that revenue has steadily increased from $597 million in 1999 to $988 million in the trailing twelve months (TTM).

Earnings per share have shown a nice progression from $1.07/share in 1999 to $2.60/share in the TTM. Also nice, the company DOES pay a small dividend and it has been increasing it from $.16/share to $.61/share in the TTM...and increasing it EACH year since 1999. Free cash flow has also been excellent and INCREASING from $54 million in 2001 to $104 million in the TTM.
Looking at the balance sheet on Morningstar.com, we can see that the company has $42.5 million in cash and $162.7 million in other current assets. This is plenty to cover the $106.5 million in current liabilities and make a big dent in the $190.3 million in long-term liabilities reported.
How about valuation? Looking at
"Key Statistics" On Yahoo, we can see that this is a mid-cap stock with a Market Cap of $1.83 Billion. The trailing p/e is nice at 17.89 with a forward (fye 30-Sep-05) of 14.86. Thus the PEG is downright cheap at 0.99 with a Price/Sales of 1.99 which isn't too rich either.
Yahoo reports 43.25 million shares outstanding with 31.30 million of them that float. Of these shares, 1.33 million shares are out SHORT, which is a LOT for this company (as of 6/7/04), and thus, the short ratio is 7.319 trading days. As you know, I like to use 3.0 days to assign any significance to this number. This is a lot of trading days....and with good results, and a bit of an upward move, we might see a bit of a squeeze. I like this figure.
The company, as noted above, pays a $.66/share dividend yielding 1.66% which isn't too bad in today's low money-market rate environment. Yahoo does not report any stock split.
How about technicals? Looking at stockcharts.com, one of my favorite free websites for basic charting, we can see with a Point & Figure chart:
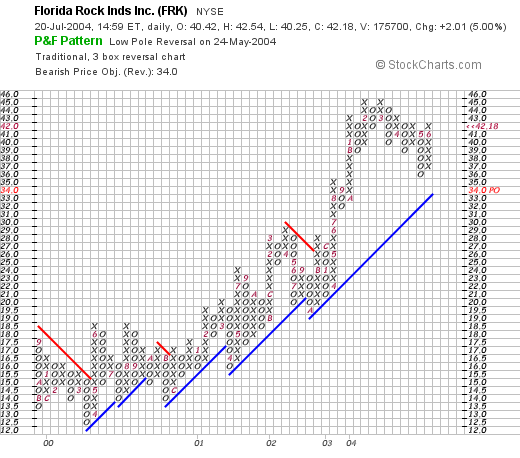
this stock has been trading very nicely above its support levels since it was about $12 in April, 2000. It does not appear over-extended. I don't see much I don't like about this chart imho.
Well what do I think? Well, I am not much into rock stocks :), but this stock looks very nice. We have a GREAT recent earnings report, the past five years shows steady growth in revenues and earnings, the company pays a small and GROWING dividend, the free cash flow is strong and growing, the balance sheet is fine, the valuation looks excellent with a PEG under 1.0, and why we even have a bunch of short-sellers out there WAITING to buy shares! Technically the chart looks just fine. If I wasn't WAITING for a stock to sell at a gain, I might just be nibbling on this cement stock (is that a mixed metaphor or what?)....but you know the same old problem...I don't have any money to buy stock now!
Thanks so much for stopping by. If you have any questions, comments, or words of encouragement, please feel free to email me at bobsadviceforstocks@lycos.com .
Bob
"Trading Transparency" JUNO
Hello Friends! Just a quick note to catch you up. The market has turned around nicely today but my Juno Lighting (JUNO) which I only had 100 shares in my trading account has NOT been performing well and hit a 13% loss. Out it went. A few moments ago I pulled the plug at $28.53. I had purchased the shares on 4/7/04 at $33.37. Will keep you posted!
Bob
Monday, 19 July 2004
July 19, 2004 Stryker (SYK)
Hello Friends! The market has closed and there is one stock I would like to review with you. I actually reviewed this once before on a MSN site, but haven't posted it yet here as it just made the
list of top % gainers on the NYSE. Stryker Corporation (SYK) closed at $47.95, up 4.15% on the day. As always, please remember that I am an amateur investor, so please consult with your own professional investment advisor prior to making any investment decisions based on information on my
blog, Stock Picks Bob's Advice or elsewhere on the website.

According to the
money.cnn.com "Snapshot", Stryker Corporation's "...principal activities are to develop, manufacture and market surgical and medical products. The Group operates in two segments: Orthopaedic Implants and MedSurg Equipment." I do not own any shares or options in this company.
Stryker
reported 2nd quarter 2004 earnings on July 15th. Total second-quarter sales rose to $1.04 billion from $891.7 million last year. Second quarter net earnings rose to $152.7 million or $.37/share from $107.5 million or $.26/share last year. They also announced they had paid down virtually all of their debt during the quarter.
In addition, on the same day, SYK
upped their earnings outlook for fiscal 2004 to $1.42/share up from its previous forecast of $1.40. Although the revision is small, it is the direction and the fact that there was a revision that is significant.
If we look at a
"5-Yr Restated" financials on Morningstar.com, we can see that revenue has steadily grown from 1999 when it was $2.1 billion to the $3.8 billion in revenue in the trailing twelve months.
Earnings/share have also grown strongly during this period from $.05/share in 1999 to $1.19/share in the TTM. A cash dividend is paid, rising from $.03/share to $.06 in 2002. (Per Yahoo, the company has paid $.07/share yielding 0.15% in the TTM).
Free cash flow is excellent increasing from $311 million in 2001 to $453 million in the TTM. This company is spinning off almost 1/2 of a billion dollars each year in free cash flow!
Balance sheet wise, SYK has $48.9 million in cash and $1.4 billion in other current assets, enough to easily pay off both the current liabilities of $798.3 million and the $145.5 million in long-term liabilities combined. From the latest quarterly report, apparently they HAVE paid off virtually all of their debt and are looking into acquisitions.
How about valuation? If we look at
"Key Statistics" from Yahoo, we can see that this is a Large Cap stock with a market cap of $19.19 billion. The trailing p/e is 40.26, the forward p/e is 28.54 (fye 31-Dec-05), and the PEG is 1.94 with a price/sales of 4.65. This stock is not a cheap stock at all!
There are 400.19 million shares outstanding with 272.20 million that float. Currently there are 5.99 million shares out short, for a short ratio of 4.904 as of 6/7/04. This is significant, and may account for the price rise today in the face of an overall declining market.
Yahoo shows that SYK does pay a dividend of $.07/share (even though Morningstar does not show any dividend for 2003), yielding 0.15%. The stock recently split 2:1 in May, 2004.
How about the "technicals"? If we look at a Point & Figure chart from Stockcharts.com:
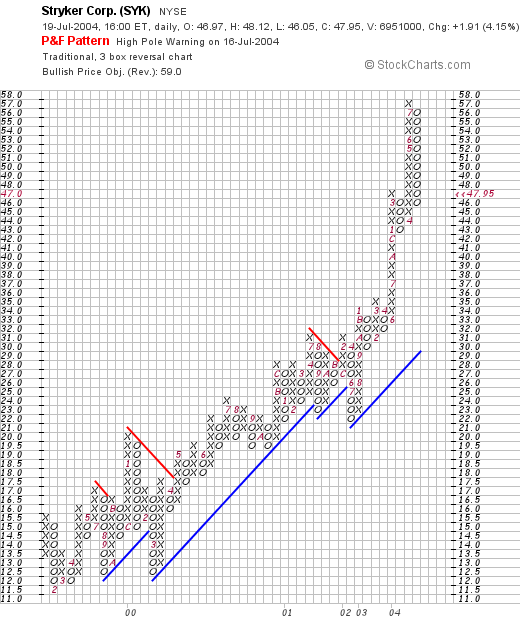
we can see what appears to be one of the strongest graphs on this blog with a nice ascent from February, 2000, to the current level. The stock has pulled back from its lofty $57 level recently, but the price chart, in my opinion, while a bit ahead of the support line, has not broken down at all.
 So what do I think? I really like this stock....but I do not have any money available to buy shares :). The latest quarterly report was strong, they have announced an increase in their own estimates for 2004, the record on Morningstar is impeccable with a steady growth in revenue, earnings, and even dividends. The free cash flow is excellent. The balance sheet is nice, and the current quarterly report points out they have paid off their debt, the valuation IS a bit steep with a PEG over 2.0, but sometimes you just GOT to pay for quality, but this is a draw-back. And the graph looks very strong. Looks like a winner to me!
Thanks so much for stopping by! If you have any questions, comments, or words of encouragement, please feel free to email me at bobsadviceforstocks@lycos.com .
Bob
Posted by bobsadviceforstocks at 6:31 PM CDT
|
Post Comment |
Permalink
Updated: Sunday, 1 August 2004 2:42 PM CDT
A Reader Writes
Hello Friends! Happy Monday everyone. Checking the mail this morning, Paul writes:
"
Bob - a wonderful site and thanks for your time consumming
analysis - could you tell me how to find "shorts" for any particular company - thanks, paul"
Thanks Paul for writing! I have found that the level of short interest is an interesting statistic which may be indicative of future price movement. This serves two purposes, raising the question that somebody may actually know something bad about a company...and maybe the individual investor should be cautious. Or perhaps on a more encouraging note, if there is a large short interest, then maybe these shares, which need to be covered eventually, will drive the price higher in a "squeeze".
I use Yahoo.com for most of my data. Unfortunately, it is always a little stale...and if somebody has a better place to look, well then let me know. However, it is adequate for my purposes. If you go to
"Key Statistics", which for illustration purposes, I am using SANDISK...which can be found along the left hand side of the main quote section:
on the "Summary" section of each Yahoo finance quote, you can find "Key Statistics" under "Company"....then looking in the second column of the "Key Statistics" you will see the number of shares out short, the date of that statistic, and the short ratio which is the number of days of current average trading volume that it would take to cover. For my purposes, I use 3 days as a cut-off of significant short interest!
Thanks again for your inquiry. I hope that was helpful and answers your question. If you have any other questions or anyone else for that matter, please feel free to email me at bobsadviceforstocks@lycos.com . Please remember that I am an AMATEUR investor, so please consult with your professional investment advisors before making any investment decisions based on information contained on my website.
Bob
Posted by bobsadviceforstocks at 9:22 AM CDT
|
Post Comment |
Permalink
Updated: Sunday, 1 August 2004 2:41 PM CDT
Newer | Latest | Older


