Stock Picks Bob's Advice
Saturday, 1 October 2005
A Reader Writes "Can you tell me a little about it (Stock clubs)?"

Hello Friends! Thanks so much for stopping by and visiting my blog,
Stock Picks Bob's Advice. As always, please remember that I am an amateur investor, so please remember to consult with your professional investment advisors prior to making any investment decisions based on information on this website.
I very much enjoy receiving email from all of you readers! As I have mentioned earlier, I read all of the notes I get and try to respond to as many as possible. If any of you have comments or questions, please feel free to post them right here on the blog or email me at bobsadviceforstocks@lycos.com.
Matt P. responded to my JDSU comments posted earlier on the blog with another question. Matt wrote:
Bob,
I'm quite impressed with what you wrote about JDSU, what you said
made good sense. I'm going to start using more of your analysis
techniques. I'm a little wet behind the ears when it comes to stock
investing. I haven't had much luck with it since I don't have a ton
of time to devote to doing real research. You mentioned in your blog
that you belong to a stock club. Can you tell me a little bit about
it? I'd be interested in looking into something like that.
Thanks again!
Matt
PS: I read your article after I placed my trade! Haha, looks like
your advice so far is right too! Its down about 9 cents a share from
when a bought it.
Now
that is a whole new discussion!
I can tell you a little bit about my club and I will point you over to the
Better Investing Website which is a good place to start in learning about stock clubs. Our club is not actually a NAIC member, but they have a great strategy for newbies in the stock club arena.
My stock club is a group of about 9 members. We have eight guys and one gal, although I would really like to see us get a bit more diverse :). I hate to use stereotypes, but I think women and men seem to overall have slightly different perspectives in stock evaluation and management.
I joined about nine years ago, and I 'bought in' with a several thousand dollar investment to become a partner in the club. We hire H&R Block to get our taxes done each year, and do this out of the assets of the club. Since the buy-in is becoming a discouragement for new members, we have made this a stock type arrangement, with individual members owning different % of the club. In this way, we can offer new members the opportunity of buying in with only $1,000 instead of the larger amound if they had to buy a full "partnership."
Each month, we sit down after work and review the current holdings, kick in another $100, which is our monthly contribution, and decide if we want to buy or sell anything. One of the members is a treasurer and another monitors our holdings with some excellent spread sheets. It helps if you have a memember with a good accounting, or computer background.
We have tried to develop a schedule of presentations. Each month a member usually (?) presents a stock and another a topic to discuss in regards to investing. We have been using "Point & Figure" charts in the club and this was my first introduction to this way of recording price movement, which I now feel is quite helpful in understanding stock charts.
Originally, we used a traditional broker to make transactions. That became quite costly, and when we realized we could get all the charts we wanted on Stockcharts.com, we switched over to Fidelity.com where we save substantially on commissions.
Let me know if that answers your question! I would visit that Better Investing website and look further into stock clubs on the web as there are many resources available.
Bob
Posted by bobsadviceforstocks at 12:36 PM CDT
|
Post Comment |
Permalink
Updated: Saturday, 1 October 2005 12:42 PM CDT
"Looking Back One Year" A review of stock picks from the week of July 26, 2004

Hello Friends! Thanks so much for stopping by and visiting my blog,
Stock Picks Bob's Advice. As always, please remember that I am an amateur investor, so please consult with your professional investment advisors prior to making any investment decisions based on information on this website.
I hope you all are having a wonderful weekend! It is getting a bit
Oktoberfest-crazy crazy this weekend.

Instead of downing a brewski, how about a little "blogski" :)?
As I like to do on weekends on the blog, is to review past stock "picks". These are the lists of picks throughout this website that I have decided fit my approach for "investable" stock market ideas. Alongside this, I have a real "trading portfolio", consisting of a maximum of 25 positions chosen from among the many "picks" I have discussed on this website. This weekend discussion is devoted to the "picks", the prior discussion was about a stock in the trading portfolio, which this week was Coach (COH).
If you would like to review the many stock picks that I have discussed on this website, you will locate them scanning through the dates along the left side of the main website. Also, to see if I have discussed a stock, simply enter the stock symbol alongside with words "Stock Picks Bob's" in the Google search engine. Usually works!
Now back to the review!
 On July 27, 2004, I posted L-3 Comms Hldgs (LLL) on Stock Picks at a price of $59.24/share. L-3 closed at $79.07 on 9/30/05 for a gain of $19.83 or 33.5% since posting.
 On July 26, 2005, L-3 reported 2nd quarter 2005 results. For the quarter ended June 30, 2005, sales grew 23.5% to $2.08 billion, from $1.68 billion for the same quarter last year. Net income climbed 35.5% to $119.4 million compared with net income of $88.1 million for the same quarter in the prior year. Diluted EPS grew by 26.9% to $.99/share vs. $.78/share last year. A solid quarter.
 On July 28, 2004, I posted National Instruments (NATI) on Stock Picks at a price of $27.89. NATI closed at $24.64 on 9/30/05 for a loss of $(3.25) or (11.7)%.
On July 26, 2005, NATI reported 2nd quarter 2005 results. Revenue for the quarter ended June 30, 2005, came in at $141 million, an 11% increase over the same quarter last year. Net income came in at $15.0 million, up from $11.4 million last year or $.19/diluted share, up from $.14/diluted share last year.
 On July 29, 2004, I posted Flowserve (FLS) on Stock Picks at $23.90. FLS closed on 9/30/05 at $36.35 for a gain of $12.45 or 52.1% since posting.
 As reported yesterday, FLS is in the process of restating financial results from 2000 to 2003. Since I can't do much with that information, that gets a 'thumbs down' from me :).
So how did we do with those three stocks that week in July last year? In a word, superb. Two stocks made solid gains, and one a modest loss. The average performance for the three stocks was a gain of 24.6% in a little over a year!
Please remember that these stock picks assume a buy and hold strategy. I do not own any of these three stocks and that future performance of these stocks may well be quite different than past performance!
Thanks again for stopping by! If you have any comments or questions, please feel free to leave them on the blog or email me at bobsadviceforstocks@lycos.com. I cannot respond to all of the emails that I receive, but you can rest assured that I read them all and that I try to answer as many as possible...usually right on the blog :).
Bob
"Weekend Trading Portfolio Analysis" Coach (COH)

Hello Friends! Thanks so much for stopping by and visiting my blog,
Stock Picks Bob's Advice. As always, please remember that I am an amateur investor, so please remember to consult with your professional investment advisors prior to making any investment decisions based on information on this website.
It is hard to believe that it is the weekend already, but there you have it! About a month ago, believing it would help me to better keep track of my own actual investments and also help you understand better what I am actually purchasing, I started reviewing my actual holdings in my Trading Account. I currently have 25 positions in that account, and I have been going alphabetically down the list, reviewing the stock and reviewing my trading history. Last week
reviewed CalDive (CDIS). Next alphabetically in my portfolio is Coach (COH).

Coach (COH) is one of the top performer in my entire portfolio! On February 28, 2003, I purchased 200 shares of Coach at $33.25/share. Since that time, Coach had a 2:1 split on 10/2/03, and another 2:1 split on 4/5/05. Thus, adjusting for the stock splits, my purchase of Coach was at $8.31.
As you may know if you read my blog, I have what I would have to call an idiosyncratic approach to owning stocks! I like to sell portions of my stocks slowly as they rise in price, leaving most of my "principle" intact, and sell quickly on the downside. My current strategy calls for selling 1/4 of my remaining holdings at the following sale points: 30, 60, 90, and 120%; 180, 240, 300, and 360%; 450%, 540%, etc.
I have sold shares of COH seven times, with my last sale on 6/16/05 when I sold 34 of my remaining 136 shares at a price of $33.01 representing a gain of $24.70 or 297.2% (approximately at my 300% gain goal.) Since 2/25/03, my total proceeds from my small sales of Coach have totalled $11,162.61...all from my original purchase of $6,650 worth of Coach stock!
Since I only sell 1/4 of my remaining shares at each of these targeted prices, I still own 102 shares of Coach (COH) which closed at $31.360 on 9/30/05. This represents a gain of $23.05 or 277.4% over my initial purchase price.
So when would I sell next? Well, since I have hit the 300% gain point, my next goal on the upside would be at the 360% point or $38.23 or if the stock declines, having sold shares at the 300% level, I would sell when I hit 50% of that gain going lower, that is when the stock hit the 150% gain point or $20.78, in which case I would be unloading all of my remaining shares.
Well back to the stock!

According to the
Yahoo "Profile" on Coach, the company "...engages in the design and marketing of American classic accessories in the United States and worldwide. Its primary product offerings include handbags, women's and men's small leather goods, business cases, weekend and travel accessories, outerwear, and related accessories."
On August 2, 2005, Coach
reported 4th quarter 2005 results. During the fourth quarter ended July 2, 2005, net sales grew 24% to $419 million. Net income increased 49% to $98 million or $.25/diluted share, up from $66 million or $.17/diluted share beating consensus of $.24/share for the quarter. Coach also went ahead and raised guidance for fiscal 2006 to sales of nearly $2.1 billion, a 22% increase over 2005. Earnings guidance was also lifted to at least $1.24, ahead of previous estimates of $1.21. All-in-all a solid report!
How about the latest Morningstar? Looking at the
"5-Yr Restated" financials, we can see the still-uninterrupted growth in revenue from $.6 billion to $1.7 billion in 2005.
Earnings have increased steadily from $.24/share in 2002 to $1.00 in 2005. Free cash flow has grown smarly from $165 million in 2003 to $450 million in 2005. The balance sheet is still solid with $383.1 million showing, more than enough to pay off both the current liabilities of $265.8 million and the long-term liabilities of $48.6 million combined! In addition, COH reports $326.3 million in
other current assets!
How about the chart? Looking at the
Stockcharts.com "Point & Figure" chart on COH:
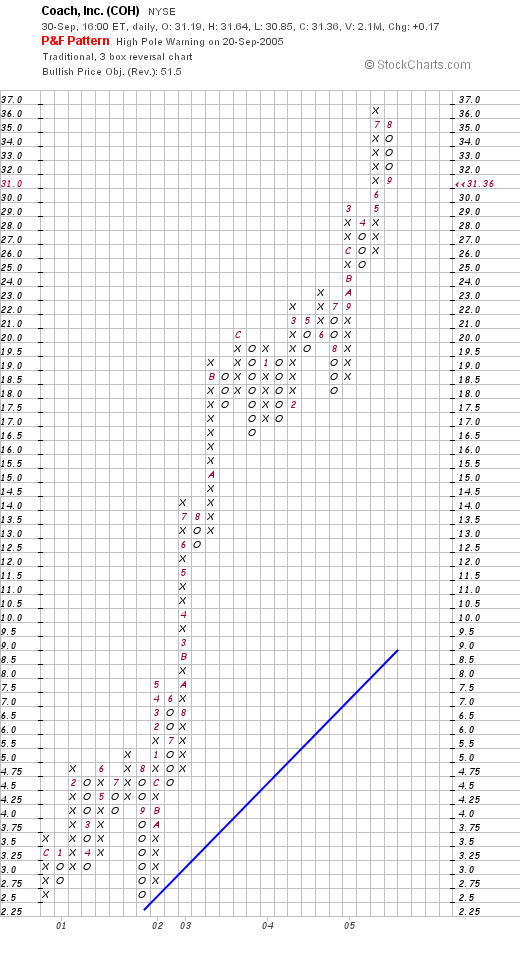
We can see an absolutely fabulous chart as the stock moves strongly higher. If anything, the stock price may be getting ahead of itself (?) with the stock climbing rapidly above the "support line".
What about valuation? Looking at Yahoo "Key Statistics" on Coach, we can see that the stock is a large cap stock with a market capitalization of $11.92 billion. The trailing p/e is a bit rich at 31.49, but the forward p/e (fye 02-Jul-07) is a bit better at 21.33. With the strong growth anticipated, the PEG really isn't that bad at 1.11.
Using Fidelity.com eresearch, we can see how expensive this stock really is! In fact, in the "Textile-Apparel Footwear/accessories" industrial group, Coach tops out the other companies with a price/sales ratio of 7.1. This is followed by Nike (NKE) at 1.6, Timberland (TBL) at 1.5, Wolverine (WWW) at 1.2, and Reebok (RBK) at 0.9. Quite frankly, I am a bit leary of this particular analysis on Fidelity, as all of the other companies are shoe companies (except maybe Nike), and I am not sure how useful this particular comparison is. But the stock is certainly not any screaming bargain with this price/sales ratio of over 7.0.
So what do I think? Well, COH has certainly been a great stock for me. Since I actually owned it back in early 2003, I believe my early sales were a bit more than 25% sales, leaving me a smaller position than my original purchase.
Please remember that past performance is NOT any kind of guarantee of future performance. In fact, that is exactly why I sell portions of my stocks as they appreciate!
Thanks again for stopping by! If you have any comments or questions, please feel free to leave them right here on the blog or email me at bobsadviceforstocks@lycos.com.
Bob
Friday, 30 September 2005
"Trading Transparency" Sybron Dental (SYD)
Hello Friends! Thanks so much for stopping by and visiting my blog,
Stock Picks Bob's Advice. As always, please remember that I am an amateur investor, so please remember to consult with your professional investment advisors prior to making any investment decisions based on information on this website.
A few moments ago, I realized that my Sybron Dental shares (SYD) hit a sale "target price." Before selling 37 shares, I had 150 shares remaining in my SYD position, and I sold 37 a few moments ago at $41.57. These shares were purchased 11/18/03, at a cost basis of $25.84/share, so I had a gain of $15.73/share or 60.9% gain. This was my second sale of shares of SYD. I had originally purchased 200 shares and sold 50 shares 1/16/04 at $31.31 which represented a gain of $5.47/share on those shares or a gain of actually only 21.2% (thus, I pulled the plug on those shares a bit early...normally selling at 30% gain level.)
Anyhow, since I am at 25 positions in my actual trading portfolio, I shall be sitting on my hands, not adding any new positions, and continuing to work at paying down my sizeable, but fortunately shrinking, margin level!
If you have any questions or comments, please feel free to leave them on the blog or email me at bobsadviceforstocks@lycos.com.
Bob
Thursday, 29 September 2005
"Revisiting a Stock Pick" Cantel Medical (CMN)
Hello Friends! Thanks so much for stopping by and visiting my blog,
Stock Picks Bob's Advice. As always, please remember that I am an amateur investor, so please remember to consult with your professional investment advisors prior to making any investment decisions based on information on this website.

Looking through the list of
top % gainers on the NYSE today, I came across an old "favorite" of mine, Cantel Medical (CMN) which I have owned in the past, but no longer have any shares or options, and have also
posted this stock previously on Stock Picks (3/2/04). Cantel is having a nice day today, trading, as I write, at $22.37, up $2.61 or 13.21% on the day.
When I posted Cantel on this blog on 3/2/04, the stock was trading at $18.40. Since the stock underwent a 3:2 stock split on 1/13/05, the effective pick price for the blog was actually $12.27, so we actually have an appreciation in stock price of $10.10 or 82.3% on this stock pick since originally listing it early last year! I purchased shares of CMN in 6/04, and
sold my remaining shares on 6/05 after the stock pulled back to a selling position. (retracing 50% of the greatest percentage gain that I had 'experienced'.)
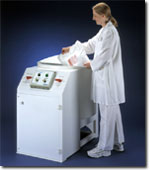
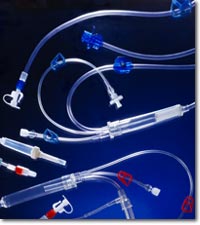
According to the
Yahoo "Profile" on CMN, the company "...through its wholly owned subsidiaries, provides infection prevention and control products, and technical maintenance services internationally. The company designs, develops, markets, and distributes disinfection and sterilization reprocessing systems, sterilants, and other supplies. The company also markets and distributes medical equipment, scientific instruments, and industrial equipment."

What drove the stock higher today, was the release of earnings. Cantel
reported 4th quarter 2005 results just prior to the opening of trading this morning. For the quarter ended July 31, 2005, sales came in at $52.0 million, a 15% increase over sales of $45.2 million the prior year same period. Net income came ina $4.7 million, up 48% from net income of $3.2 million last year. On a diluted per share basis this worked out to $.29/diluted share, up 45% from $.20/diluted share last year. All-in-all a solid report, and the street responded accordingly!
How about longer-term? What does the Morningstar.com report look like? Well, looking at the
Morningstar.com "5-Yr Restated" financials, we can see a beautiful progression of revenue growth from $41.3 million in 2000 to $190.6 million in the trailing twelve months (TTM). During this period, earnings have grown steadily from $.28/share in 2000 to $.88/share in the TTM.
Free cash flow has
also been steadily increasing from $10 million in 2002 to $20 million in the TTM.
The balance sheet is solid with $24.7 million in cash and $59.5 million in other current assets, as opposed to the $28.5 million in current liabilities and the $25.4 million in long-term liabilities.
Looking at
Yahoo "Key Statistics" for some valuation numbers, we find that the company is a small cap stock with a market capitalization of only $331.86 million.
The trailing p/e is moderate at 25.49 and the forward p/e (fye 31-Jul 06) is nicer at 20.35. The PEG is a bit over 1.0 at 1.16 so valuation isn't bad.
Using
Fidelity.com eresearch, we can see that Cantel is downright cheap in the industrial group of "Medical Instruments/Supplies". Leading this group in price/sales ratio is Alcon (ACL) at 9.6, Guidant (GDT) at 6.1, Stryker (SYK) at 4.4, Boston Scientific (BSX) at 3.1, and Baxter (BAX) at 2.5. Cantel 'brings up the rear' at a price/sales ratio of only 1.7.
Looking back at Yahoo, we find that there are only 14.96 million shares outstanding. Currently (7/12/05) there are 684,970 shares out short representing 5.80% of the float or 3 trading days. This doesn't look too significant to me.
There are no cash dividends, and as I mentioned above, the company last split 3:2 on 1/13/05.
What about the chart? Taking a look at the
"Point & Figure" chart on CMN from Stockcharts.com:
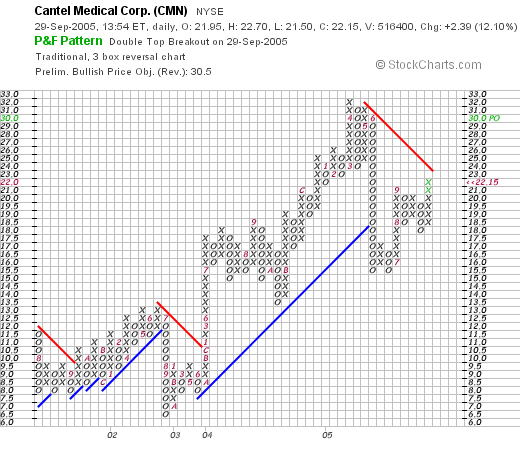
We can see that the stock has had a bit of a volatile move higher. The stock broke down once in June, 2002, when it dropped from $13 down to $6.50, and then resumed climbing higher. I got "shaken out" of the stock in June, 2005, when the stock plummeted from $32 down to $15 level. The stock consolidated, started moving higher, and is poised to break through resistance at $23. The chart looks fine to me. Not overwhelming in strength but I am sold!
So what do I think? Well, this company appears to be back on track after a gross over-reaction to a penny miss on earnings earlier this year. The last quarterly report (issued today) was superb, the Morningstar.com analysis looks fantastic with steady revenue and earnings growth, increasing free cash flow, and a solid balance sheet. To top this off, the p/e isn't bad in the mid 20's (imho), with a PEG just over 1.0. The price/sales is also a nice indicator suggesting the stock is reasonably priced within its industrial group! Now, if I just needed a new position :). Oh well, still sitting on my hands for now!
If you have any comments, or questions, please feel free to leave them right on the blog, or email me at bobsadviceforstocks@lycos.com. Happy trading everyone!
Bob
Wednesday, 28 September 2005
September 28, 2005 Paychex (PAYX)
Hello Friends! Thanks so much for stopping by and visiting my blog,
Stock Picks Bob's Advice. As always, please remember that I am an amateur investor, so please remember to consult with your professional investment advisors prior to making any investment decisions based on information on this website.

Looking through the
list of top % gainers on the NASDAQ today, I came across Paychex (PAYX) which closed at $37.25, up $3.16 or 9.27% on the day. Even though my stock club has owned some shares of this stock, I do not personally own any shares or options on this company.
According to the
Yahoo "Profile" on PAYX, the company "...provides computerized payroll, as well as integrated human resource and employee benefits outsourcing solutions for small and medium sized businesses in the United States. It offers payroll processing; tax filing and payment; employee payment; time and attendance solutions; regulatory compliance, such as new hire reporting and garnishment processing; retirement services administration; employee benefits administration; workers' compensation insurance; and human resource administrative services."
On September 27, 2005, (after the close of trading yesterday), Paychex
announced 1st quarter 2006 results. Total revenue for the quarter ended August 31, 2005, came in at $403.7 million, a 17% increase over the $345.0 million reported in the same period last year. Net income came in at $115.0 million for the quarter or $.30/diluted share, a 31% increase over net income of $87.7 million or $.23/diluted share last year. In addition, the company raised revenue growth guidance for 2006 to be in the range of 13% to 15%. Overall, a
very satisfactory report!
What about a longer-term view of the company? Looking at a
"5-Yr Restated" financials from Morningstar.com, we can see a steady picture of revenue growth from $.9 billion in 2001 to $1.4 billion in 2005. Earnings have also steadily grown from $.68/share in 2001 to $.97 in 2005. The company also pays a dividend has raised it each and every years since at least 2001 when it was $.33/share, increasing to $.51/share in 2005.
Free cash flow has been positive and growin from $313 million in 2003 to $397 million in 2005.
In addition, the balance sheet looks solid with $707.6 million in cash and $3.0 billion in other current assets, as balanced against a sizeable $2.9 billion in current liabilites and only $51.6 million in long-term liabilities. Overall, current assets favor liabilities, but it isn't an overwhelming ratio.
Taking a look at
Yahoo "Key Statistics" on PAYX, we find that the market cap is a large cap $14.11 billion. The trailing p/e is rich at 38.36 with a forward p/e just a bit better at 28.01. Demonstrating the rich valuation, we find PAYX with a PEG of 1.71.
Looking at
Fidelity.com "eresearch", we find that Paychex is in the "Staffin/Oustsourcing Svcs" Industrial Group. Also, by this parameter, Paychex is priced rather richly. The company leads this group in valuation with a price/sales ratio of 9.0, this is followed by Robert Half (RHI) at 2.0, Gevith HR (GVHR) at 1.1, Administaff (ASF) at 0.9, and Manpower (MAN) at 0.2.
Other key statistics on Yahoo document the 378.71 million shares outstanding. As of 8/10/05, there were 8.72 million shares out short representing 2.6% of the float or 5 trading days of volume. Using my arbitrary 3 day rule, this level of short interest does look significant and may be driving the stock higher (?).
As noted previously, the company does pay a small dividend currently at $.52/share yielding 1.5%. The last stock split reported on Yahoo was a 3:2 split on May 23, 2000.
What about a chart? Looking at a
Paychex "Point & Figure" chart:
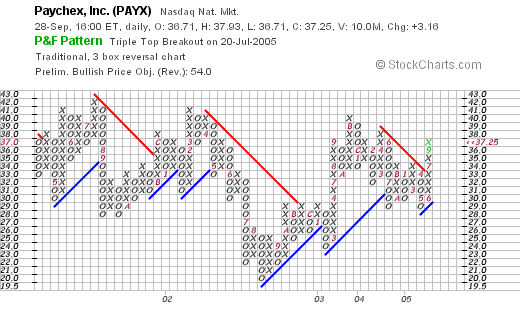
The chart is rather unimpressive with basically a sideways move in the stock price from April, 2001, to the current level at $37.25. The stock certainly does not look overextended and the recent price action above the support line also looks promising as the stock broke through resistance at the $32 level.
What do I think? I actually like the stock. The earnings have been solid, the Morningstar information is impressive with steady reven, earnings, and free cash flow, and the balance sheet looks nice.
On the downside, the valuation is rich with a p/e in the 30's and the forward p/e only in the 20's with a PEG over 1.5. And a price/sales ratio that is way ahead of its peers in the same industrial group.
Anyhow, thanks so much for stopping by! If you have any questions or comments, please feel free to email me at bobsadviceforstocks@lycos.com or leave them right here on the blog!
Bob
A Reader Writes "I wanted to get your opinion on it (JDSU)"
Hello Friends! Thanks so much for stopping by and visiting my blog,
Stock Picks Bob's Advice. As always, please remember that I am an amateur investor, so please remember to consult with your professional investment advisors prior to making any investment decisions based on information on this website.
Checking the mail yesterday, I was pleased to see a letter from Matt P. who wrote:
Hey, I'm considering a JDSU play. I've been looking for a low priced
growth stock and I'm about to pull the trigger on this one. They're
going to do a reverse split of 1:8 or 1:10 in the next few months.
Jim Cramer raved about it yesterday on his radio show, and it made
quite a bit of sense. I wanted to get your opinion on it.
Thanks,
Matt
First of all, I am not really qualified to tell you whether or not JDSU is a good investment for you. I truly
am an amateur investor. On top of this, I would not argue with Jim Cramer, who is bright and well-informed about stocks, on a pick he has made.
All I can tell you is whether a stock more or less "fits" into what I use to pick stocks. That doesn't mean it won't climb higher and it doesn't mean that I am always correct. This is just my idiosyncratic method of looking at stocks. It appears to be working for me, so I shall be keeping it for the time being!
But let's take a look at JDSU. By the way, I don't own any shares of JDSU, but several years ago, I was a shareholder of SDL which was later acquired by JDSU and for a period of time
did own some of this stock. The things I like to review when picking stocks include the latest price move, the latest quarterly report, the Morningstar.com financials and a "point & figure" chart from Stockcharts.com. Please bear with me as I go through this review. Please remember, this is just an assessment on how this stock either "fits" or not in my scheme of things :).
First of all, JDSU closed at $2.13 today, down $.05 or 2.29% on the day. In general, I have taken to avoiding stocks under $10. Simply too volatile for my approach, and generally of 'lower quality'.
Latest quarter? On September 1, 2005, JDSU
reported 4th quarter 2005 results. Net revenues came in at $170.9 million, compared with revenues of $166.3 million the prior year. Growing revenue passes the test for that part of the report.
What about earnings? The company is
losing money, in fact the net loss was $(145.7) million compared with a net loss of $(21.7) million last year, or $(.10)/diluted share this quarter this year, vs. a loss of $(.02)/share in the same quarter the year earlier. Not only does the company pass my requirement that they be profitable, showing earnings and not losses, but the losses are mounting.
Again, this doesn't mean that Jim Cramer is wrong. It simply means that it doesn't fit into the subset of stocks that fulfill my own particular criteria!
What about Morningstar.com? Looking at the
"5-Yr Restated" financials on Morningstar.com, we can see the following: revenue peaked in 2001 at $3.2 billion, and has been falling each and every year since, except for a slight pick-up in revenue from $636 million in 2004 to $716 million in the trailing twelve months (TTM).
Since 2001, the company has lost money each and every year. It appears that losses have generally been shrinking which is a plus, but I am looking for
profits and not losses!
Free cash flow? Again, this company is
burning up its free cash flow with $(47) million in 2002, and $(179) million in the trailing twelve months. Again, not exactly what I am looking for in a stock!
Balance sheet? Fortunately, this company is LOADED with cash, with $1.38 billion in cash and $306.7 million in other current assets. This is compared with $269.4 million in current liabilities and $474.7 million in long-term liabilities per Morningstar.
How about a chart? Looking at a
JDSU "Point & Figure" chart from Stockcharts.com:
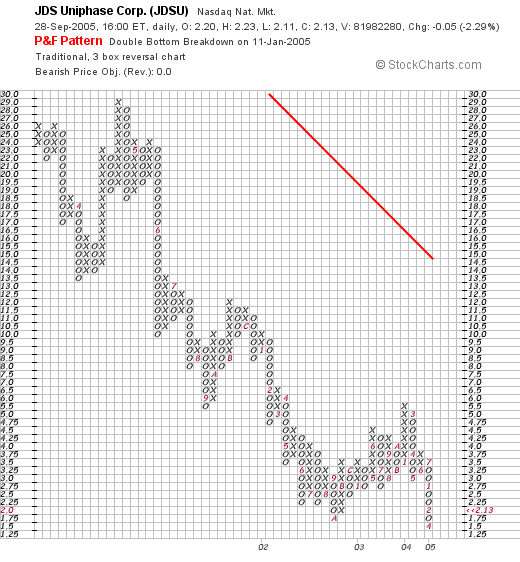
I see what appears to be no let-up of an awful chart! The company has declined from the $28 level in March, 2001, to the current $2.00 level. All of the time trading below the red resistance line.
So what do I think? Well Cramer may be brilliant, I just try to be successful. He is speculating that the price level is way overdone and the stock is a fabulous buy. He may be right. And you might make a load of money by buying the stock in here.
But let me tell you what I don't like about JDSU. I want a stock of a company that is profitable, that is first growing both the revenue (JDSU does), and earnings (JDSU isn't), with a steady 5 year revenue growth (not JDSU), growth in profits (JDSU is reducing losses), positive free cash flow (JDSU is burning up its cash), and a nice balance sheet (JDSU has a solid balance sheet).
Furthermore, I am not a technician, but I like to see a graph that is generally appreciating in price before jumping in. JDSU is continuing to decline on the chart I examined. Simply put, JDSU might be the greatest investment since sliced bread right in here at this price. But it is far too speculative for my style of investing. Give me the steady and profitable gainer any day!
I hope that this discussion was helpful. Cramer might turn out to be brilliant on this stock. Hit himself a home run right out in the bleachers. As for me, I will take my "base hits" any day. Just how I like to invest!
Thanks so much for stopping by and participating on the blog. If you or any other reader has questions or comments, please feel free to leave them on the blog or email me at bobsadviceforstocks@lycos.com.
By the way, here is an Ida Kohlmeyer painting to enjoy. She was one of New Orleans most famous artists and is a favorite of mine!
Bob
Tuesday, 27 September 2005
"Trading Transparency" ResMed (RMD)
Hello Friends! Thanks so much for stopping by and visiting my blog,
Stock Picks Bob's Advice. As always please remember that I am an amateur investor, so please remember to consult with your professional investment advisors prior to making any investment decisions based on information on this website.
A few moments ago, I sold 30 shares of ResMed (RMD) in my actual trading portfolio at $78.01/share. This was a 1/4 position of my previously held 120 shares. I like to sell a 1/4 position at previously set targets, which for me are at 30, 60, 90 and 120% gains, and then 180, 240...etc.
I had purchased these shares 2/4/05 with a cost basis of $59.74/share, so this was a $18.27/share gain or a 30.6% appreciation from my purchase price.
Since I am at my goal of 25 positions, I shall be using the proceeds to continue to try to pay down my significant margin level. If I were under 25 positions, this would be a signal to add a new position to the portfolio.
Thanks so much for stopping by! If you have any comments or questions, please feel free to leave them on the blog or email me at bobsadviceforstocks@lycos.com. I cannot get to every letter but I shall try to answer as many as I can....usually in the blog! Have a great day!
Bob
Monday, 26 September 2005
September 26, 2005 Rocky Mountain Chocolate Factory (RMCF)
Hello Friends! Thanks so much for stopping by and visiting my blog,
Stock Picks Bob's Advice. As always, please remember that I am an amateur investor, so please remember to consult with your professional investment advisors prior to making any investment decisions based on information on this website.

I was looking through the
list of top % gainers on the NASDAQ today and came across Rocky Mountain Chocolate Factory (RMCF) which is trading at $15.34, up $1.57 or 11.38% on the day, as I write. I do not own any shares nor do I have any options in this company.
According to the
Yahoo "Profile" on RMCF, this company "...engages in the manufacture of confectionery products, as well as in the operation and franchising of confectionery stores in the United States, Canada, Guam, and the United Arab Emirates. It offers approximately 300 chocolate candies and other confectionery products, including clusters, caramels, creams, mints, and truffles."
On July 12, 2005, Rocky Mountain Chocolate Factory
reported 1st quarter 2006 results. For the quarter ended May 31, 2005, revenues increased 13% to $5.4 million from $4.7 million in the same quarter last year. Just as important, the "same-store sales" at franchised retail outlets climbed 4.1%. Net earnings for the first quarter increased 27% to $753,000 compared with $592,000 in the prior year same period. Fully diluted earnings per share increased 22% to $.11 compared with $.09 last year.
Looking longer term at the
"5-Yr Restated" financials on Morningstar.com, we can see a nice picture of revenue growth except for a dip from $22.6 million in 2001 to $19.4 million in 2002. Otherwise, since then, revenue has grown steadily to the $25.2 million level in the trailing twelve months (TTM).

Earnings have also been a bit erratic, dropping from $.33/share in 2002 to $.14/share in 2003. However, since then they also have climbed steadily to $.53 in the trailing twelve months.
Free cash flow has stayed positive with $3 million reported in 2003, and $2 million in the TTM. Looking at the balance sheet, we find that ther is $1.7 million in cash and $6.8 million in other current assets, plenty to cover both the $2.1 million in current liabilities and the $.7 million in long-term debt, three times over.
Reviewing
Yahoo "Key Statistics" on RMCF, we find that this is a small, virtually a micro cap stock with a market capitalization of only $95.21 million. The trailing p/e is moderate (imho) at 28.81, but the forward p/e (fye 28-Feb-07) is better at 19.62. No PEG is reported.
According to
Fidelity.com, Rocky Mountain Chocolate Factory is in the "Confectioners" industrial group. Within this group, the Price/Sales figure of 3.7 is no bargain. Wrigley (WWY) tops the group with a price/sales of 4.1, followed by Rocky Mountain (RMCF) at 3.7, Tootsie Roll (TR) at 3.6, Hershey (HSY) at 3.0, and M&F Worldwide (MFW) at 3.0. Imperial Sugar (IPSU) is a relative bargain with a price/sales ratio of only 0.1.

Looking at some other numbers from Yahoo, we can see that there are only 6.22 million shares outstanding with 4.95 million of them that float. Currently as of 8/10/05, there are only 121,510 shares out short (up from 67,200 the prior month) but still representing only 2.20% of the float or 1.3 trading days of volume. Not significant in my book!
The company
does pay a small dividend of $.27/share yielding 2.00%. Yahoo reports the lates stock split recently, a 4:3 split on 6/14/05.
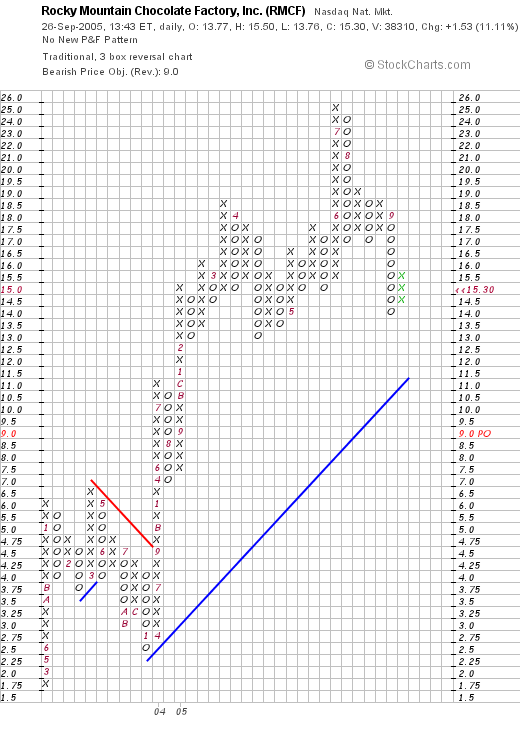
What about the chart? If we look at a
"Point & Figure" chart on RMCF from Stockcharts.com, we can see that the stock has been a fairly volatile issue but has been climbing fairly steadily from the $1.75 level in February, 2002, to the $16 level today. The stock broke through resistand at around $4.75 in September, 2005, and has moved higher since, with a pullback to the current level, still above the support line, but well below the recent price high of $25. The graph looks positive, but not over-extended:
So what do I think? Well I sure love their chocolate! But seriously, the recent earnings report is solid, the Morningstar.com looks pretty strong to me with fairly steady growth in both earnings and revenue. (I find that these tiny companies tend to have much more volatile results!) Free cash flow is positive, and the balance sheet is strong. In fact, the company even pays a cash dividend.
On the downside, valuation is a bit rich with a p/e in the high 20's, and a price/sales ahead of all but one stock in its group. However, if you wanted to get into a small company with a large potential growth, this might be the answer!
Thanks again for stopping by! If you have any comments or questions, please feel free to leave them right here on the blog or email me at bobsadviceforstocks@lycos.com.
Bob
Sunday, 25 September 2005
Some thoughts on a Sunday evening!
This is a
reproduction of a Coignard painting "Perturbation"

I wanted to share some thoughts with you this evening on investing. This is not about any particular stock but about the whole process of selecting stocks, making decisions, and reducing the tremendous stress in the process.
Needless to add, as I always like to do, I am an amateur investor, so please consult with your professional investment advisors before making any investment decisions based on information on this website!
I chose this picture tonight because I want to comment about the thinking process that goes into decisions. After many years of guessing about what stock is likely to rise and what stock may fall, and when to sell, and when to add more, I have decided that the best approach is to 'put your ear to the ground' and listen to what the market is telling you.
I have many friends who dabble in the market. They give it a great deal of thought and try to anticipate the next big move. Sometimes they are right, and I wish them well. But after years of doing the same thing, I stop "trying" to make decisions. I let the decisions come to me.
I have written before about this "Zen" approach to investing. And I believe it is a very important part of a successful investor. Avoiding the anticipation but being in touch with investment sentiment.
Some years back I read a book by Edwin Lefevre, called
Reminiscences of a Stock Operator, and I would like to share with you an excerpt on "watching the tape":
"That is how I first came to take an interest in the message of the tape. The fluctuations were from the first associated in my mind with upward or downward movements. Of course there is always a reason for fluctuations, but the tape does not concern itself with the why and wherefore. It doesn't go into explanations. I didn't ask the tape why when I was fourteen, and I don't ask it to-day, at forty. The reason for what a certain stock does to-day may not be known for two or three days, or weeks, or months. But what the dickens does that matter? Your business with the tape is now--not to-morrow. The reason can wait. But you must act instantly or be left."
What this book tells us is that studying the market entails observation. It doesn't make you less smart that I am not asking you to anticipate. I think it is enough that we learn to observe. To "read the tape" so to speak.
It is that reason why I start with the % gainers looking for the stocks on the move. I don't always know why they are moving, but I start there and try to sort through them to find the ones that have fundamentals that might warrant continued strength.
I believe it is a good approach.
That doesn't mean there aren't better ways to pick stocks. You could study market trends and be an astute technician, but I don't think that is necessary. Just being a good observer is strong medicine. After starting there, pitch in your intellect and sort through the candidates to find the stocks that are working.
In the same way, it is wise to listen to your own portfolio talking to you! When stocks begin to be sold on bad news, sit on your hands, don't re-invest, avoid compounding your losses. But as stocks do well and hit sales on good news, it is wise once again to expand your exposure to equities and add positions to your portfolio.
Just some thoughts on investing tonight that I wanted to put down on paper and share with you the reader. Listen to your fellow investors, they will tell you about the next sure thing, the investment that will rocket higher, and consider that this might not be the rational approach to investing. Instead, sit yourself down and observe, watch the market, see what stocks are moving higher, and selectively pick from among those!
Have a great week investing everyone! And to all of the victims of Rita and Katrina, and I include my own family and friends among them, my thoughts are with you.
Bob
Newer | Latest | Older


