Stock Picks Bob's Advice
Saturday, 13 January 2007
J2 Global Communications (JCOM)
Hello Friends! Thanks so much for stopping by and visiting my blog, Stock Picks Bob's Advice! As always, please remember that I am an amateur investor, so please remember to consult with your professional investment advisors prior to making any investment decisions based on information on this website.

Last month I started a new discussion called "Long-Term Review", which was my way of doing a really long-term review of past stock picks, in fact going back to my first picks in 2003. I would like to continue to go through my early picks discussing each one that is still publicly traded (many have been acquired by other companies). I will try to go through the same regimen as I have with other stock discussions, pointing out what the company does, what the stock price closed at, how the longer-term financials appear, and some valuation information as well as a chart. All of these analyses again depend on 'buy and hold' strategies, instead of the disciplined trading approach that I employ and advocate for in my blog.
 On May 14, 2003, writing up my second stock selection for this blog, I wrote about J2 Global Communications:
"May 14, 2003 j2 Global Communications
Scanning those most active lists again today...not much luck until we got to j2 Global Communications. I do not at this time own any share of this stock. It is about 11:30 am Central time here in Wisconsin. Last quarter revenues rose 47% to $15.2 Million (a small company!) Net Income rose to $5 million up from $1.5 million the year earlier. According to CNN.money....j2 Global Communications "provides outsourced messaging and communications services to businesses and individuals throughout the world." I am not sure exactly what they do (!) but they are making money and this is certainly NOT a Peter Lynch approach of I 'saw it at the mall'.
Looking at Morningstar.com, under 5 year financials, this choice is clinched. We see revenue of 0.7 Million in 1997, 3.5 million in 1998, 7.6 million in 1999, 13.9 million in 2000 and 33.3 million in 2001. Trailing 12 months is 43.8 million. These bar graphs are a beauty to behold! In the past 12 months the company has turned profitable. They have sequential earnings and revenue growth...and are starting to generate free cash flow. Thus, the choice to be posted today! Good luck investing....Bob"
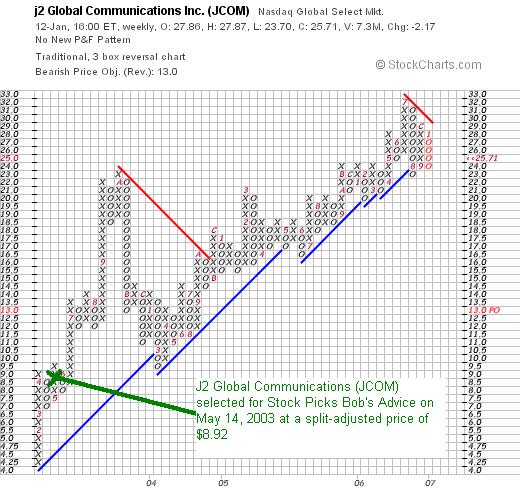
Looking through this post, you can see how 'green' I was, and didn't even record the price. The highest price for that day can be found on Big Charts and was $8.92. JCOM closed at $25.71 on 1/12/07, for an effective stock pick price appreciation of $16.79 or 188.2% since posting almost 4 years ago. Unfortunately, I don't own any shares or options on this stock and haven't participated in this stock rise by owning shares.
What does this company do?
According to the Yahoo "Profile" on JCOM, the company
"...provides outsourced, value added messaging and communications services to individuals and businesses worldwide. It offers an array of faxing solutions, including Web-based fax and fax broadcasting at eFax.com; and a suite of unified communications services, including fax, Web-based voicemail, and conference calling at j2.com; as well as a conference calling service to its business services at consensus.com and a unified communications service through Onebox.com."
How did they do in the latest quarter?
On August 1, 2006, the company reported 2nd quarter 2006 results. Quarterly revenue rose 27% to $44.4 million vs. $34.9 million. Earnings came in at $13.1 million up from $11.7 million last year or $.26/share, up from $.23/share in the prior year. More recently, the stock has been under some dark clouds for being late with filing 3rd quarter results and recently reported that they would be taking a $3.5 million charge related to stock option grants and that revenue forecasts would be slightly under expectations.
How about longer-term?
Looking at the latest Morningstar.com "5-Yr Restated" financials on JCOM, we can see that the growth in this stock is still unchecked. They had revenue of $33.3 million in 2001, increased this to $143.9 million in 2005 and $153.7 million in the trailing twelve months (TTM).
Earnings, which were a loss of $(.17)/share in 2001, turned profitable at $.30/share in 2002, and have more than tripled to $1.00/share in 2005 and $1.04/share in the TTM. (all of these results are subject to some small revisions due to accounting issues noted above.)
The company has a fairly stable number of shares outstanding with 45 million reported in 2001, increasing to 48 million in 2005 and 50 million in the TTM. This is about an 11% increase in outstanding shares during a period in which revenue increased almost 400% and earnings were up over 200%. This is certainly what I would call a compeltely acceptable level of earnings dilution.
Free cash flow has been positive and growing with $29 million in 2003, increasing to $55 million in 2005 and $63 million in the TTM.
The balance sheet is absolutely gorgeous with $139.8 million in cash, enough to cover both the $21.8 million in current liabilities and the $.2 million in long-term liabilities combined about 6x over! The actual current ratio, including the $13.9 million in other current assets works out to a very strong (one of the strongest figures on this entire blog!) of 7.05.
What about valuation?
Looking at the Yahoo "Key Statistics" on J2 we find that JCOM is a mid cap stock with a market capitalization of $1.27 billion. The trailing p/e is a moderate 24.10 with a forward p/e estimated (fye 31-Dec-07) at 18.50. With the rapid growth in earnings expected the PEG ratio is reported (5 yr expected) at 0.96. Valuation between 1 and 1.5 is nice. Below 1 is excellent in terms of valuation for a growth investor.
According to the Fidelity.com eresearch website, the company has a Price/Sales (TTM) of 7.67, well below the industry average of 12.16. The company is also more profitable than the average company in its industry with a Return on Equity (TTM) of 25.75% compared to the average of 10.94% in its industry.
Finishing up with Yahoo, we find that there are 49.35 million shares outstanding with 47.75 million that float. Currently there are 6.14 million shares out short (12/12/06) representing 12.8% of the float or 15 trading days of average volume (the short ratio). Using my own particular '3 day rule', this is quite significant, and if the company can get some good news, there well could be a bit of a squeeze of the shorts. However, further 'bad news' could confirm the shorts negative views.
No dividends are paid and the last stock split was a 2:1 on May 25, 2006.
What does the chart look like?
If we review a "Point & Figure" chart on JCOM from StockCharts.com we can see that the stock has been a fairly steady and strong performer increasing from a low of $4.25 in January, 2003, to a high of $32 in July, 2006. The stock has consolidated since and is threatening to break through support levels on the downside where it is trading at this time.
Summary: What do I think?
This sure was a great second stock pick for the blog! I am currently concerned about some of the clouds regarding accounting issues before I could advocate adding a position of JCOM to my own portfolio. The Morningstar.com report is impressive, especially the strong financial position reported. The graph and valuation numbers are also excellent with a PEG under 1.0, Price/Sales low for its group, and ROE high for its group.
Thanks so much for stopping by and visiting my blog. If you have any comments or questions, please feel free to leave them on the blog or email me at bobsadviceforstocks@lycos.com. Please always remember that I am an amateur and that past performance is no guarantee for future stock price performance! Have a great weekend everyone!
Bob
"Looking Back One Year" A review of stock picks from the week of September 5, 2005
Hello Friends! Thanks so much for stopping by and visiting my blog, Stock Picks Bob's Advice! As always, please remember that I am an amateur investor, so please remember to consult with your professional investment advisors prior to making any investment decisions based on information on this website.

It is the weekend (at last!) and time to look back at stock picks from the past. I have been asked why I say looking back a year and then go back and review a year and a quarter or so.....well the answer is obvious. I am an amateur, and although I started out reviewing each weekend, well you know how that goes....some weekends I really do get so busy I cannot blog! And then it is a little more than a year. And so on.
While this blog is somewhat disorganized and virtually a flow of consciousness sometimes, there really is a method to all of this madness. If you are new to the blog, I apologize so bear with me. What I am trying to accomplish is to simultaneous present stocks that with my own peculiar screening techniques, appear to be 'investable'. I call these my 'vocabulary' of stocks. It is from these stocks that I am building my own portfolio.
And that is another task for me. Using my own techniques to build an actual trading portfolio that I share with you the reader. And sharing with you my thinking, my rationale, my successes and my failures.
Scattered among these posts and thoughts I have been developing a very disciplined trading strategy that allows me to decide when to buy, when to sell, and when to simply 'sit on my hands'. So all of these posts and comments are simultaneously being done on the blog. Please do email me at bobsadviceforstocks@lycos.com if you have any comments or questions. I try to read every email I receive and comment on most. But if you do write or comment, please be sure to give me at least a first name and a geographic area. It makes everything more personal and interesting.
But back to today's post. Last week I reviewed the stocks from the week of August 29, 2005. Going to the next week, let's spend some time looking at the ideas I was generating here on the blog during the week of September 5, 2005.
This review assumes a "buy and hold" strategy with equal $'s being invested in each of the stocks discussed. However, in practice, I employ a very disciplined selling technique that cuts losses quickly at 8% levels and directs me to sell portions of my existing holdings as they appreciate and reach pre-set targeted levels. This certainly would affect actual performance but for the sake of this analysis, it is easier to simply evaluate past stock picks without assuming any trading response to price change at all.
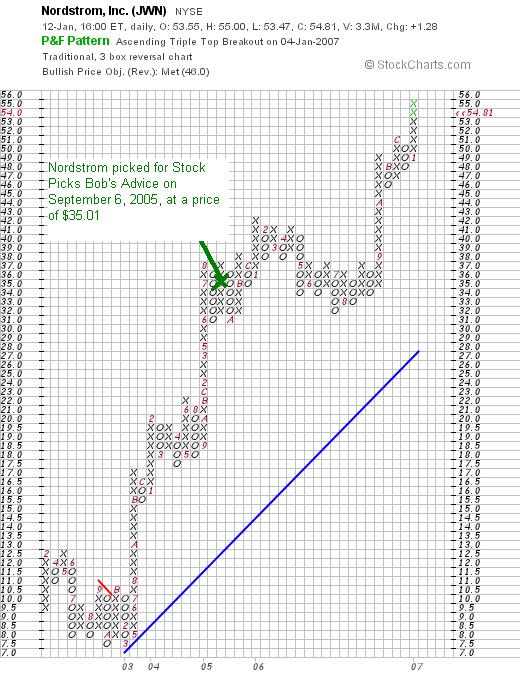
 On September 6, 2005, I posted Nordstrom (JWN) on Stock Picks Bob's Advice when it was trading at $35.01. Nordstrom closed at $54.82 on January 12, 2007, for a gain of $19.81 or 56.6% since posting.
 On November 20, 2006, Nordstrom reported 3rd quarter 2006 results. Total sales for the third quarter of 2006 ended October 28, 2006, increased 12.4% to $1.9 billion, compared to sales of $1.7 billion in the same quarter last year. Same-store sales for the quarter climbed a strong 10.7%. Net earnings came in at $135.7 million or $.52/diluted share up from $107.5 million or $.39/diluted share last year. This was a very strong report!
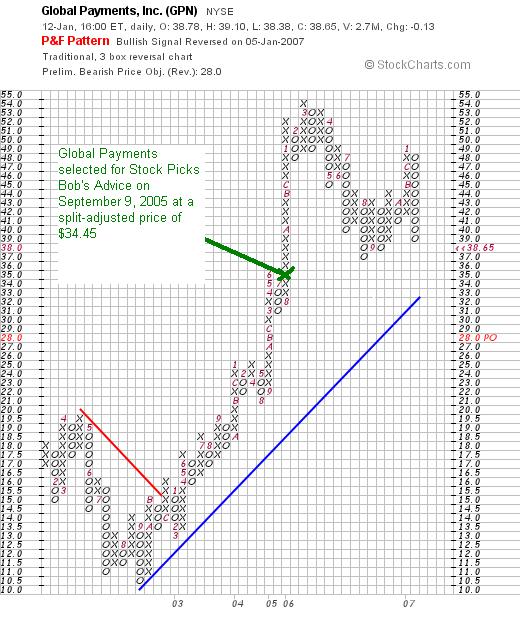
 On September 9, 2005, I posted Global Payments on Stock Picks Bob's Advice when the stock was trading at $68.89. Global Payments (GPN) had a 2:1 stock split on October 31, 2005, giving me an effective 'pick price' of $34.45. GPN closed at $38.65 on January 12, 2007, for a gain of $4.20 or 12.2% since posting.
On January 5, 2007, GPN reported 2nd quarter 2007 results. For the quarter ended November 30, 2006, revenue increased 19% to $260.7 million from $219.7 million in the prior year same period. GAAP earnings per share came in at $.42/share, up from $.37/share the prior year. The company spent some time sorting out the effect of accounting for options expenses which otherwise would have had the company coming in at $.44/share, but I shall stick with GAAP (generally accepted accounting principles) for the purpose of this blog.
The company did put a damper on future expectations, a bearish inclusion, stating:
"Based on our first half results and our second half expectations, we are reaffirming the low end of our annual fiscal 2007 revenue guidance of $1,057 million, and reducing the high end of this guidance to $1,069 million. This revenue guidance reflects an expected 16 percent to 18 percent growth versus $908 million in fiscal 2006."
The stock price sold off with this announcement which lowered rather than raised guidance.
So how did I do for these two stocks during that week in September, 2005? In a word 'great'! Both stocks appreciated with Nordstrom showing the stronger gain. The average performance for the two stocks was a gain of 34.4%.
Thanks again for visiting! Please remember that I am an amateur and that past performance is certainly no guarantee for future performance! If you have any comments or questions, I look forward to receiving them at bobsadviceforstocks@lycos.com and also feel free to leave them right on the blog! If you get a chance, be sure and visit my Stock Picks Podcast Site.
Bob
Friday, 12 January 2007
Mesa Laboratories (MLAB)
CLICK HERE FOR MY PODCAST ON MESA
Hello Friends! Thanks so much for stopping by and visiting my blog, Stock Picks Bob's Advice! As always, please remember that I am an amateur investor, so please remember to consult with your professional investment advisors prior to making any investment decisions based on information on this website.
Earlier today I sold a sixth of my Coach (COH) holding and bought a new position in Bolt (BTJ). While I was looking for a new position, I came across Mesa Laboratories (MLAB) and I believe it would be an excellent pick for the blog. I chose to buy Bolt, probably because I had already written it up previously, and also because Mesa is medical stock, and quite frankly, I have quite a few medical stocks in my trading account already! I do not own any shares nor do I have any options on this stock.
Let's take a closer look at this small company which has some interesting findings making it a nice match for my blog and my own particular criteria on picking stocks!
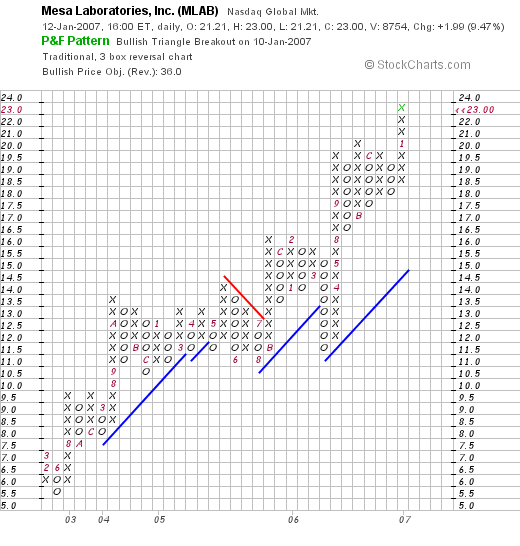
 Mesa (MLAB) made the list of top % gainers on the NASDAQ today. Mesa closed at $23.00/share, up $1.99 or 9.47% on the day.
What exactly does Mesa do?
According to the Yahoo "Profile" on Mesa, the company
 "...engages in the design, development, acquisition, manufacture, and marketing of instruments and disposable products used in industrial applications and hemodialysis therapy. It offers data logging systems, concentration analyzers, pipeline interface detectors, flow meter products, and raven biological indicators for pharmaceutical, food, and petrochemical applications."
How did the company do in the latest quarterly report?
On November 13, 2006, Mesa reported 2nd quarter 2007 results. Net sales grew 41% to $4.2 million from $3.0 million in the same quarter last year. Net income increased 14% to $912,000 or $.28/diluted share, up from $801,000 or $.26/diluted share the year earlier.
How about longer-term results?
Reviewing the Morningstar.com "5-Yr Restated" financials, we can see that revenue, which grew slowly between 2002 and 2004, increasing only from $9 million to $9.1 million, has steadily increased since to $12 million in 2006 and $14 million in the trailing twelve months (TTM).
Earnings/share have increased steadily from $.59/share in 2002 to $.92/share in 2006 and $1.02/share in the TTM. The company also initiated a dividend in 2004 at $.25/share and has increased the dividend steadily since to $.42/share in 2005, $.51/share in 2006 and $.53/share in the TTM.
This is a very small company with 3 million shares outstanding in 2002 and 3 million still in the TTM.
Free cash flow is positive although small at $3 million in 2004 and $2 million each year since.
The balance sheet is solid. As reported by Morningstar.com, the company has $2.9 million in cash, more than enough to pay off both the $.9 million in current liabilities and the $.3 million in long-term debt combined more than 2x over. If we combine the $2.9 million in cash with the $6.4 million in other current assets and compare it to the $.9 million in current liabilities, we can derive a current ratio of just over 10!
What about some valuation numbers?
Reviewing the Yahoo "Key Statistics" on Mesa, we can see that this stock is a micro cap stock, not even big enough to call a 'small cap'! The market cap is currently at $72.98 million. As defined, a micro cap stock is a stock with a market capitalization between $50 and $300 million. The trailing p/e is a moderate 22.59. No PET nor any forward p/e's are reported. With very small companies, there is often a small supply of analysts who report on and provide us with estimates.
According to the Fidelity eresearch website, Mesa carries a Price/Sales (TTM) ratio of 4.58, a bit richer than the industry average of 2.32. However, the company is more 'profitable' than average, at least as measured by the Return on Equity (ROE) (ttm), which for MLAB is reported at 18.67%, much higher than the industry average of 8.15%.
Reviewing some more numbers on Yahoo, the company has 3.17 million shares outstanding with 2.51 million that float. As of December 12, 2006 there were 335 shares out short representing an insignificant # of short sales. The company does pay a not so insignificant dividend of $.32/share going forward with a forward yield of 1.6%. The company does pay a significant portion of its earnings out in dividends with a Payout Ratio of 52% reported. No stock splits are reported on Yahoo.
What does the chart look like?
If we review a "Point & Figure" chart on Mesa Laboratories from Stockcharts.com we actually see a price graph that looks quite strong. the company, since bottoming at $5.50 in May, 2002, has moved fairly steadily higher, except for a bit of a correction in June to July in 2005 at around $11 to the current level of $23.
Summary: What do I think about Mesa?
This is a fascinating little company. I am sure the stock will be more volatile than others due to the small size (3 million shares and a market cap under $100 million). But actually the chart demonstrates the consistent strength in the stock price!
The latest quarterly report was solid. The Morningstar.com report is very nice with stead revenue growth the past few years. Steadier earnings growth and even a dividend that has been steadily increased. All while maintaining a very stable number of shares. Free cash flow, while small, is positive, and the balance sheet is beautiful.
Valuation-wise we don't have many numbers but a p/e in the low 20's for a stock like this that is growing and even pays a dividend appears reasonable imho. Finally the chart looks strong. Now, if only I had bought some Mesa instead of Bolt....lol. Oh well, I cannot own them all!
Thanks so much for stopping by and visiting. If you have any comments or questions, please feel free to leave them on the blog or email me at bobsadviceforstocks@lycos.com.
Bob
Posted by bobsadviceforstocks at 10:36 PM CST
|
Post Comment |
Permalink
Updated: Saturday, 13 January 2007 5:50 PM CST
Bolt Technology (BTJ) "Trading Transparency"
Hello Friends! Thanks again for stopping by and visiting my blog, Stock Picks Bob's Advice! As always, please remember that I am an amateur investor, so please remember to consult with your professional investment advisors prior to making any investment decisions based on information on this website.
If you read the prior entry, you will see how my Coach stock, a phenomenal performer for me, hit a sale point giving me a permission slip, so to speak, to add a new position. Looking through the list of top % gainers on the AMEX, I came across an old favorite of mine, Bolt Technology, that I have reviewed here on the blog. In fact, I first discussed Bolt on Stock Picks on January 19, 2006, almost exactly a year ago!
As I write, Bolt is trading at $17.36, up $.74 or 4.45% on the day. I purchased 300 shares of BTJ a few moments ago at $17.40. Wish me luck! On the downside, I plan on unloading all shares if the stock declines 8% or at or below .92 x $17.40 = $16.01. On the upside, I plan on selling 1/6th of my holding, or 50 shares, if the stock should rise to 1.30 x $17.40 = $22.62.
Thanks again for visiting! If you have any comments or questions, please feel free to leave them on the blog or email me at bobsadviceforstocks@lycos.com.
Bob
Coach (COH) "Trading Transparency"
Hello Friends! Thanks so much for stopping by and visiting my blog, Stock Picks Bob's Advice! As always, please remember that I am an amateur investor, so please remember to consult with your professional investment advisors prior to making any investment decisions based on information on this website.
A few moments ago my Coach (COH) stock hit its 9th targeted sale point (!). I just sold 14 shares of my remaining 85 shares at $45.82. These shares had a cost basis of $8.33, purchased 2/25/03, and thus I just had a realized gain of $37.49 or 450.1% on this purchase. I have previously sold small portions of my Coach stock at 30, 60, 90, 120, 180, 240, 300, and 360% appreciation levels! This has been a phenomenal ride!
When is my next sale targeted? This would be at a 540% level, going by 90% intervals at this point. Thus, of the remaining 71 shares, I would sell 1/6th or 11 shares if the stock should reach 6.40 x $8.33 = $53.31/share. On the downside, my new sell point, at which time I plan on selling all remaining shares, would be at half of my highest targeted point. Since my latest sale was at a 450% gain, then if the stock should retrace down to a 225% appreciation point, then all remaining shares would be sold. This price would work out to 3.25 x $8.33 = $27.07. All 71 shares would be sold at that point.
One other thing.
Since I only have 11 positions (of my targeted 25 position portfolio), this sale at an appreciation point gives me a 'signal' allowing me to add a new position. That nickel is already burning a hole in my pocket!
Thanks so much for stopping by and visiting! If you have any comments or questions, please feel free to leave them on the blog or email me directly at bobsadviceforstocks@lycos.com.
Bob
Thursday, 11 January 2007
H B Fuller Company (FUL)
Hello Friends! Thanks so much for stopping by and visiting my blog, Stock Picks Bob's Advice! As always, please remember that I am an amateur investor, so please remember to consult with your professional investment advisors prior to making any investment decision based on information on this website.
 I was looking through the list of the top % gainers on the NYSE this afternoon, figuring that for sure a new name would show up on the list with the strong gain in the market overall. Checking the fundamental data, I worked my way down to H. B. Fuller (FUL) which closed at $28.49, up $1.97 or 7.43% on the day. I do not own any shares nor any options on this stock. Let me share with you why I believe this stock deserves a place on the list.
I believe I first read about Fuller many years ago when it was written up in one of the early editions of 100 Best Stocks to Own in America by Gene Walden. Gene Walden influenced my thinking greatly with his "star system" of rating stocks based on several different factors; mostly, it was his observation about the consistency in financial results that was his measure of quality that influenced my thinking the most.
What exactly does this company do?
 According to the Yahoo "Profile" on Fuller, the company
"...together with its subsidiaries, engages in the manufacture and marketing of adhesives and specialty chemical products worldwide. It operates in two segments, Global Adhesives and Full-Valu/Specialty. The Global Adhesives segment produces and supplies industrial and performance adhesives products for applications in various markets, including assembly; converting, including packaging, corrugated, tape and label, tissue and towel, and graphic arts; nonwoven, including disposable diapers, feminine care, and adult incontinence products; automotive; and footwear. The Full-Valu/Specialty segment produces and supplies specialty chemical product lines for ceramic tile applications, HVAC insulation, powder coatings applied to metal surfaces, specialty products and consulting for packaging solutions, consumer products, and products for the insulated glass market applications, as well as liquid paint sold through retail outlets in Central America."
How did Fuller do in the latest quarter reported?
On September 26, 2006, FUL reported 3rd quarter 2006 results. For the quarter ended September 2, 2006, net revenue grew 8.6% to $388.9 million over the same quarter last year. Net income increased over 50% to $24.2 million or $.40/share vs. $15.5 million or $.26/share in last year's same period. In the same announcement, the company went ahead and raised guidance for fiscal 2006 to $1.44 to $1.46, amounting to $.45 to $.47 for the fourth quarter. The company beat expectations for the quarter of revenue of $369 million.
What about longer-term results?
Looking at the Morningstar.com "5-Yr Restated" financials on H B Fuller, we can see that revenue, which dipped from $1.27 billion in 2001 to $1.256 billion in 2002, has subsequently steadily increased to $1.51 billion in 2005 and $1.54 billion in the trailing twelve months (TTM).
Earnings also dipped from $.79/share in 2002 to $.49/share, then rebounded to $1.06/share in 2005 and $1.39/share in the TTM.
Dividends came to $.21/share and were raised to $.22/share in 2003, $.23/share in 2004, $.24/share in 2005 and $.25/share in the TTM.
The company has kept its shares outstanding fairly stable with 56 million in 2001, growing to 58 million in 2005 and 60 million in the TTM. While shares did rise a bit under 10%, earnings during the period were up nearly 100% and revenue increased by 25%.
What about valuation?
Reviewing the Yahoo "Key Statistics" on H B Fuller, we can see that this is a mid cap stock with a market capitalization of $1.7 billion. The trailing p/e is a moderate 20.63, with a forward p/e of 17.48 (fye 03-Dec-07). Yahoo reports Fuller with a PEG of 1.99, a bit rich from my perspective.
According to the Fidelity.com eresearch website, Fuller has a Price/Sales (TTM) ratio of 1.02, with an industry average of 1.63. In terms of profitability, again according to Fidelity, Fuller has a Return on Equity (TTM) (ROE) of 13.01% just about at the industry average of 13.88%.
Some additional numbers from Yahoo: 59.63 million shares outstanding with 59.02 million that float. As of 12/12/06, there were 3.09 million shares out short representing 5.20% of the float or 7.6 trading days of volume. Using my arbitrary 3 day rule, this 7.6 trading day figure looks a bit heavy, and the move higher today might well have been putting a bit of pressure on the short-sellers.
The company, as noted, pays a dividend with a forward rate of $.25/share, yielding 0.90%. The last stock split was a 2:1 split paid out on August 7, 2006.
What does the chart look like?
Examining the "Point & Figure" chart on FUL from StockCharts.com, we can see that the stock, which seemed to trade sideways between 2002 and 2004, broke out to the upside in March 2005 at $14. Thje stock broke out once again in January 2006 to the $27 level, and appears once again to be challengin the old highs for a newer price now.

Summary: What do I think?
Let me summarize some of the things I have written above. First of all, Fuller, a stock that I do not own any shares, made a ncie move higher today. Most recently, the company reported a 3rd quarter earnings result which beat expectations on revenue and they also raised guidance for the subsequent quarter and full year 2006 results.
Valuation appears reasonable, although the PEG is a bit rich at just under 2.
The company is steadily growing revenue, earnings and increasing free cash flow. They pay a small dividend and have increased the dividend. Finally, there are a lot of shares out short which may well result in a 'short squeeze' if the upcoming quarter is strong. In addition, the chart looks good, if just a tad overextended. This is the kind of stock I would be buying today if I were buying anything; I am close to a buy signal with my Coach (COH) but will have to wait for some more trading to see if it is going to hit a sale point.
Thanks so much for stopping by and visiting my blog. If you have any comments or questions, please feel free to email me at bobsadviceforstocks@lycos.com or just leave them on the blog. If you get a chance, please drop by and visit my Stock Picks Podcast Site.
Bob
Wednesday, 10 January 2007
A Reader Writes "I was wondering....."
Hello Friends! Thanks so much for stopping by and visiting my blog, Stock Picks Bob's Advice! As always, please remember that I am an amateur investor, so please remember to consult with your professional investment advisors prior to making any investment decisions based on information on this website.
I have been trying to accomplish many things simultaneously on this blog.
Above all, it is a way for me to examine my own ideas about what makes a good investment. It is also a way for me to look back at my own ideas and find out how successful they have been. Besides 'picking' stocks, I am trying very hard to determine the best way for me to manage my own portfolio. When should I sell a stock? How much of that position? And what to do with a stock that does well and what to do with a stock that disappoints and declines in price.
 Along that line, a regular reader, and I should hope friend has written another nice letter.
Let me share with you his inquiry as well as my response. If you or anyone else have any comments or questions, please feel free to email me at bobsadviceforstocks@lycos.com. If you could, I would appreciate if you could give me a first name and a general location. It makes inquiries and responses a bit more personal and that I think is what makes this blog interesting.
William S. writes:
" Hi Bob,
Hope all is well. I was wondering how you handle a stock that goes up a little bit after you buy it, say 4%-5%, and then heads into a loss? If I remember correctly, you will allow a profit to retrace 50% before selling it if it heads down. Does a stock you hold have to go up a certain amount to apply that rule, or does it hold for small gains like the one I suggested as well. Thanks, and have a good week!
Bill"
Thanks so much for writing Bill! Since I haven't gone over this too much lately, let me share with you my own approach to selling stocks on what I like to call "bad news". I will discuss sales on "good news" elsewhere, but generally those are the sales at targeted appreciation levels: 30, 60, 90, 120, 180, 240, 300, 360, 450% gains, etc. At those points, I sell 1/6th of my remaining holding in that particular stock and use that as a "signal" to add a new position.
But let's get back to selling on bad news.
There are only a few different cases I need to discuss.
First of all, after a stock has been first purchased but has not ever reached a sale at a gain, I will allow the stock to decline to an 8% point before selling...unless there is news that I believe is fundamentally bad for the company and then of course I reserve the right to sell shares at any point.
Thus, if a stock I first purchased either ranges between a (7)% loss, and a 29% gain, I shall never have hit that 30% target and I will allow that holding to decline to an (8)% loss before selling all of my shares.
Next case, if I have sold the stock once at the approximately 30% appreciation point.
In that case, much along William O'Neil's strategy of not allowing a stock that you have had a gain ever get into a loss position....I like to sell all of my remaining shares if the stock price retraces to a break-even point. Thus, the stock could have had a 'partial sale' at a 30% appreciation point, even appreciated up to a 59% appreciation point, but I will allow it to go to break-even if I have only had one partial sale.
All of the other cases are those holdings in which I have had more than one partial sale at appreciation targets. In those cases, I plan on selling all of my remaining shares if the stock drops to 50% of the highest partial sale level.
For example, if I have sold a 1/6th of remaining shares three times: at the 30, 60, and 90% appreciation levels, then I will sell all remaining shares if the stock declines back to the 45% appreciation point--1/2 of the highest (90%) appreciation target. This would include shares that only climbed to a 91% appreciation level all of the way up to a 119% appreciation point, because they never hit the fourth or 120% appreciation point.
This strategy appears to be working for me. This gives me a framework (if you saw my current diet regimen you would know I needed a framework!) and answers my own questions about when I need to sell in virtually all situations. It doesn't mean it is the best way to go about it. You may well develop a better approach, but this is the way that has been effective in 'advising' me on sales of stocks that I own in my portfolio!
Thanks so much for visiting and writing! Please keep me posted on how things are working out for you and any ideas or strategies you have been employing.
Bob
Saturday, 6 January 2007
Kyphon (KYPH) "Weekend Trading Portfolio Analysis"

Hello Friends! Thanks so much for stopping by and visiting my blog, Stock Picks Bob's Advice! As always, please remember that I am an amateur investor, so please remember to consult with your professional investment advisors prior to making any investment decisions based on information on this website.
One of the things I like to do on this website is to share with you investing ideas that meet my own criteria for stocks. In addition, I invest in some of the many stocks I discuss. I try very hard to provide transparency about what I own and what I am just discussing. I do try to select my own investments from the stocks that are discussed on this blog. As part of this transparency, about a year ago I started discussing the stocks that I actually own on weekends. Currently with 11 stocks in my own trading portfolio, I have been reviewing one stock at a time going alphabetically down my list of holdings.
Two weeks ago, I reviewed my holding in Cytyc. Going alphabetically, my next stock to discuss is Kyphon (KYPH). Let's take a closer look at this company and my experience with it! I first discussed Kyphon Stock Picks Bob's Advice on October 30, 2003, when the stock was trading at $29.15. I "revisited" Kyphon on May 20, 2005, when the stock was trading at $28.81.
 Currently, I own 150 shares of Kyphon (KYPH) with a cost basis of $29.21/share purchased on May 20, 2005. (This is actually the second time that I have owned Kyphon, having purchased 300 shares back in 4/5/04 at a cost basis of $28.16, but selling it quickly thereafter on 4/13/04 at a price of $25.71 for a loss of $(2.45) or (8.7)%, triggering my sale after a holding period of 8 days!).
 Since my most recent purchase, I sold 1/4 of my holdings (my older 'strategy' which is now replaced by 1/6th of holdings) or 50 shares at $37.98 or at a gain of $8.77 or 30% on July 8, 2005. KYPH closed at $40.85 on January 5, 2007, giving me an unrealized gain of $11.64 or 39.8% on my remaining 150 shares.
When shall I be selling my shares next? On the upside, after a single sale at a 30% gain, my next targeted appreciation point would be at a 60% gain at which time I plan on selling 1/6th of my remaining shares or 25 shares at 1.60 x $29.21 = $46.74. On the downside, after a single sale at a 30% gain, all of my remaining shares will be sold either on fundamental 'bad news' or when the stock declines to break-even or $29.21 or lower.
Let's take another look at this stock and see if it still deserves a place on the blog.
What exactly does this company do?
According to the Yahoo "Profile" on Kyphon, the company
"...engages in the design, manufacture, and marketing of medical devices to treat and restore spinal anatomy using minimally invasive technology. Its products include KyphX Bone Access Systems, which is used to create a working channel into fractured bone; KyphX Xpander, Elevate, Exact, and Express inflatable bone tamps, which are disposable sterile devices that combine the functionality of a metal bone tamp with the engineering principles of medical balloon technologies. The company also offers KyphX Xpander Inflation Syringe that allows the surgeon to deliver a measured volume of the fluid that inflates the balloon; and KyphX Bone Filler Device that deliver bone filler materials into bone cavity. Its products also comprise KyphX Bone Biopsy Device, which takes a sample of bone for evaluation purposes; KyphX Curettes, to scrape or score bone in the spine; and KyphX HV-R polymethylmethacrylate bone cement and KyphOs calcium phosphate, which are bone filler materials used in kyphoplasty procedures."
How did they do in the latest quarter?
On November 1, 206, Kyphon reported 3rd quarter 2006 results. For the quarter ended September 30, 2006, revenue climbed 30% to $102.7 million, from $79.0 million in the same quarter in 2005. Net income, however, declined 19% to $9.5 million or $.21/diluted share, down from $11.8 million or $.26/diluted share in 2005. However, the decrease was due to a stock-compensation charge....and otherwise would have come in at $14.3 million or $.31/share. In general, I don't like any declines regardless of the explanation, however, since I already own the stock, I don't think this was substantial enough news for me to sell my shares. I wouldn't however be writing up the stock new on this report.
What does their longer-term financial results look like?
Reviewing the Morningstar.com "5-Yr Restated" financials on KYPH, we can see the steady and rapid growth in revenue from $36.1 million in 2001 to $306.1 million in 2005 and $357.3 million in the trailing twelve months (TTM).
Earnings, which were $.65/share in 2003, dipped to $.50/share in 2004, but have since increased to $.66/share in 2005 and $.73/share in the TTM.
The company has increased their shares modestly from 38 million in 2003 when revenue was $131 million to 44 million in the TTM when revenue was $357 million. Thus, the company has increased its shares by 16% while almost tripling its revenue. I can tolerate this sort of mild dilution of equity.
Free cash flow has been positive and growing with $9 million reported in 2003, $21 million in 2004, $60 million in 2005 and $63 million in the trailing twelve months.
The balance sheet is still quite nice with $231.3 million in cash, enough to pay off both the $66.7 million in current liabilities and the relatively small $8.7 million in long-term liabilities. And this without even adding in the $95.8 million in other current assets. Calculating the current ratio, we can see that the $327.1 million in total current assets, when divided by the $66.7 million in current liabilities yields a very strong 4.9 figure.
What about some valuation numbers?
Examining the Yahoo "Key Statistics" on Kyphon, we find that this company is a mid-cap stock with a market capitalization of $1.83 billion. The trailing p/e is rich at 60.43, the forward p/e is a bit better at 38.54. The PEG, which I would like to see between 1 and 1.5, also comes in a bit rich at 1.61.
The Fidelity.com eresearch website shows that the Price/Sales TTM comes in at 4.76, with an industry average of 21.12. The company has a Return on Equity (ROE) TTM of 10.93% compared to an industry average of 30.21%.
Yahoo shows that there are 44.75 million shares outstanding with 43.81 million that float. As of 12/12/06, there were 5.21 million shares out short representing 4.5 trading days (short ratio) or 11.70% of the float. This is a bit significant using my own 3 day rule for the short ratio. With the relatively rich valuation of this stock, it is relatively easy to see why some people might want to go short, betting the stock price will decline. However, with any good news, we may see significant upward pressure as short-sellers scramble to cover their negative 'bets'.
What does the chart look like?
Reviewing the StockCharts.com "point & figure" chart on Kyphon, we can see that since 2003, although the chart has been a bit volatile, the stock has had steadily higher highs and higher lows. The stock has been consolidating the past 1 1/2 years, but appears to be above the support levels for now. Consolidation is probably reasonable in light of the relatively rich value of this stock.

Please excuse the complicated chart above, but I wanted to make a note at the different times I have purchased and sold, as well as written up this stock.
Summary: What do I think about this stock?
Let's summarize. First of all the company is trading above my purchase price and I have already sold one portion of my holding. Although I have previously owned and lost money on this fairly volatile security. The latest quarter was reasonable after factoring out the accounting expense of stock options. The Morningstar.com page looks outstanding with steady revenue and earnings growth, relatively stable shares outstanding, and impressive free cash flow as well as a solid balance sheet. Valuation is a bit rich, and the stock could be vulnerable to any shortfall in earnings or revenue if that should occur. However, at this point, I own the shares and shall stay with the stock as long as the price permits me except for any unexpected bad news.
Thanks so much for stopping by and visiting my blog! If you have any comments or questions, please leave them right on the blog or feel free to email me at bobsadviceforstocks@lycos.com. If you get a chance, please feel free to visit my Stock Picks Podcast site, where I discuss some of the many stocks I write about on my blog!
Have a great weekend everyone and a healthy and prosperous 2007!
Bob
"Looking Back One Year" A review of stock picks from the week of August 29, 2005
Hello Friends! Thanks so much for stopping by and visiting my blog, Stock Picks Bob's Advice. As always, please remember that I am an amateur investor, so please remember to consult with your professional investment advisors prior to making any investment decisions based on information on this website.
I had a very busy New Year's weekend! I hope you all have made and are still keeping your many New Year's resolutions. As for me, I have just started a new diet. (Is that the most common resolution or what?) Wish me well. The real secret will be whether I can keep off the weight I take off after getting there.
So I didn't get around to my usual reviews this weekend. I know it is Tuesday already, but the market is closed in honor of the recently deceased President Ford whose funeral is today in Grand Rapids. (I am a big fan of Grand Rapids, Michigan, as I lived there for two years, up on the Heritage Hill section for part of the time, and down by the airport in Kentwood, I believe the suburb was called for the other part of the time.) I am not sure if you all are interested in this kind of information, but isn't this what a blog is all about? More than just numbers I guess.
But let me get to the reviews.
There were three stocks I discussed on that particular week in 2005. My review assumes a "buy and hold" approach; in reality, I advocate, and practice a disciplined portfolio management strategy in which I sell my declining stocks quickly at 8% losses, and sell my gaining stocks slowly and partially at targeted price levels. This difference in strategy would certainly affect one's actual investing experience, and I would encourage all of you to of course take that into consideration.
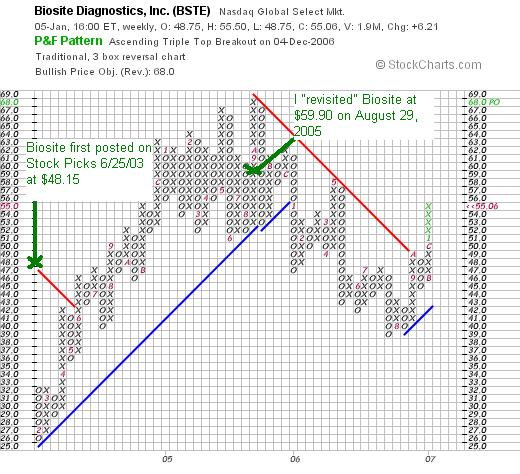
 I wrote up Biosite (BSTE) on Stock Picks Bob's Advice when it was trading at $59.90/share on August 29, 2005. BSTE closed at $55.06 on January 5, 2007, for a loss of $(4.84) or (8.1)% since posting. I first wrote up Biosite on this blog on June 25, 2003, when the stock was trading essentially at the same price as it is today, at $48.15/share.
 On October 26, 2006, Biosite reported 3rd quarter 2006 results. Revenues for the quarter ended September 30, 2006, totaled $74.6 million, up 7% from the $69.7 million reported in the same quarter in 2005. However, GAAP diluted earnings per share came in at $.49, compared with GAAP diluted earnings per share in 2005 of $.68. Net income came in at $9.04 million, down (28)% from the $12.6 million reported in the previous year.
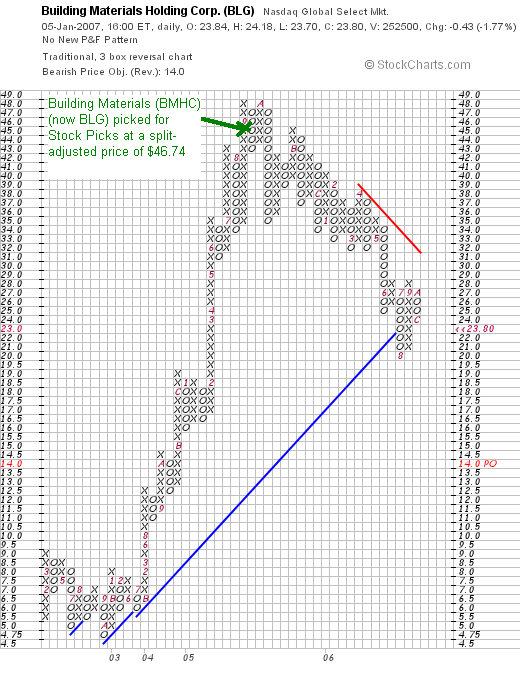
 On August 31, 2005, I posted Building Materials Holding (BMHC) on Stock Picks Bob's Advice when it was trading at $93.48. Building Materials (which now trades on the NYSE with a symbol of BLG split 2:1 on March 15, 2006, making my effective stock pick price actually $46.74. BLG closed at $23.80 on 1/5/07, for a loss of $(22.94) or (49.1)%.
On October 24, 2006, Building Materials reported 3rd quarter 2006 results. Sales for the third quarter increased 1% to $831 million from $820 million in the same quarter the prior year. Net income, however, came in at $35.3 million or $1.20/share, down from $41.6 million, or $1.40/share in the year-earlier same quarter.
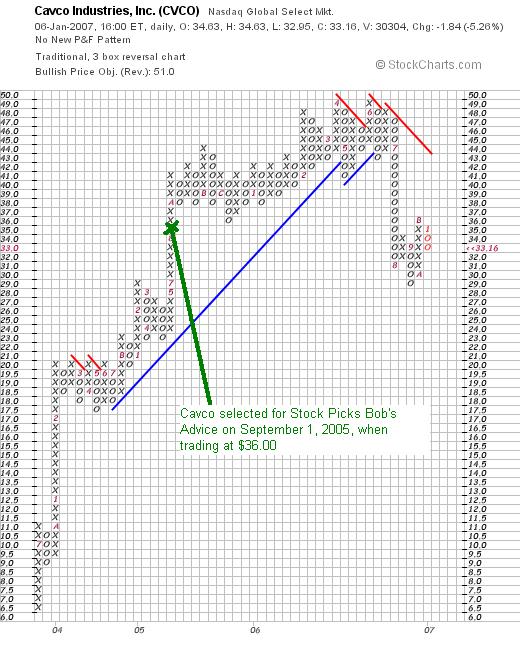
 The third stock I "picked" that week in 2005 was Cavco Industries (CVCO) which was posted on September 1, 2005, when it was trading at $36.00/share. CVCO closed at $33.16/share on January 5, 2007, for a loss of $(2.84) or (7.9)% since posting.
On October 19, 2006, Cavco reported 2nd quarter 2007 results. Net sales for the quarter ended September 30, 2006, declined 8.6% to $43.1 million down from $47.1 million in the same quarter in the second quarter of 2006 fiscal year. Net income was $3.2 million, down 8.5% from $3.5 million in the preceding year same quarter. Net income per diluted share was $.49 vs. $.52/share last year.
So how did I do that particular week in August and September, 2005? In a word, mediocre if not worse! ALL three stocks declined between original posting and today! Assuming an equal dollar purchase of each of the three stocks, and a buy-and-hold strategy, this would have resulted in an average loss of (21.7)% for the three stocks!
What can I say? Not much except that this posting is a good way to start out the New Year with a touch of humility! There is nothing magic about what I write about! It is important to always limit your losses to a small amount so as not to let them accumulate, it is important to be monitoring your holdings frequently, it is important to check with your professional investment advisors regarding all of the stocks discussed on this blog as I am an amateur investor!
Thanks so much for stopping by and visiting! If you have any comments or questions, please feel free to leave them on the blog or email me at bobsadviceforstocks@lycos.com. If you get a chance, stop by and visit my Stock Picks Podcast site wherre I discuss some of the many stocks and strategies I write about here on the blog!
Happy New Year everyone!
Bob
Posted by bobsadviceforstocks at 12:01 AM CST
|
Post Comment |
Permalink
Updated: Saturday, 6 January 2007 3:40 PM CST
Friday, 5 January 2007
Happy New Year!
I have taken a few days off from blogging. I read your comments and letters at bobsadviceforstocks@lycos.com, but one thing led to another and I haven't been posting for a few days now. But I am back and ready to go! As these entries appear to be getting longer and longer, one New Year's resolution for me is to write shorter posts with an occasional longer review. But then again, I am on a diet too :).
Hoping you all are doing well and shall enjoy good health and prosperity this year!
Bob
Newer | Latest | Older


