Hello Friends! Thanks so much for stopping by and visiting my blog, Stock Picks Bob's Advice. As I always remind you, please remember to check with your professional investment advisors prior to making any investment decisions based on information on this website. I am an amateur investor and cannot be responsible for any of your trading decisions!
 I first posted Kyphon (KYPH) on Stock Picks on October 30, 2003, wehn it was trading at $29.15. KYPH is currently trading at $28.85, as I write, up $1.85 on 6.85% on the day. The stock is still at virtually the same level as it was in 2003 when I first wrote the stock up!
Earlier today, KYPH made the list of top % gainers on the NASDAQ, but with the NASDAQ firming up, and the price of KYPH easing a bit, the current performance, trading at $28.81, up 6.70% on the day, is not quite a strong enough move to keep it on the list! As I wrote in the previous post, since I had sold some shares of HIBB at a gain, I was looking for a new position, and a few moments ago, I purchased 200 shares of KYPH for my trading account.
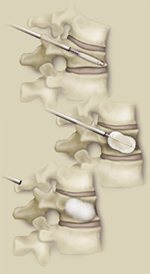
Let's take a closer look at this stock. According to the Yahoo "Profile" on KYPH, Kyphon "...is a global medical device company specializing in the design, manufacture and marketing of medical devices to treat and restore spinal anatomy using minimally invasive technology. The Company's devices are used primarily by spine specialists, including orthopedic surgeons and neurosurgeons, interventional radiologists, and interventional neuroradiologists who repair spinal fracture caused by osteoporosis, trauma, cancer or benign lesions through performing minimally invasive surgery known as kyphoplasty."
My first step, after finding a potential investment "candidate" in reviewing a company is to check the latest quarter results. Very simply, I am looking for revenue and earnings growth, and if the company can exceed expectations, all the more power to it!
 On April 27, 2005, KYPH reported 1st quarter 2005 results. Net sales for the quarter came in at $66.2 million, a 49% increase over the $44.4 million in net sales the same quarter the prior year. Net income came in at $6.4 million, up from $4.8 million the prior year, or on a diluted per share basis, this worked out to $.15/diluted share, up from $.11/diluted share last year.
For a 'longer-term' look at this company, I generally review the "5-Yr Restated" finances on Morningstar.com. Here we can see the beautiful ramp-up of revenue from $6.1 million in 2000 to $235.2 million in the trailing twelve months (TTM).
Earnings have been a bit more erratic, dropping from $.65/share in 2003 to $.50/share in 2004 and increasing to $.54/share in the TTM.
Free cash flow has improved from $(2) million in 2002 to $26 million in the TTM.
The balance sheet, as presented by Morningstar.com, is gorgeous, with $128.3 million in cash, easily covering both the $30.3 million in current liabilities and the smallish $4.1 million in long-term liabilities several times over. In addition, another $71.4 million in "other current assets" is reported!
 What about 'valuation' questions and other measurements on this stock? For this, I like to review the Yahoo "Key Statistics" on KYPH. Some facts from this page include the fact that this is a mid-cap stock with a market capitalization of $1.22 billion.
 The trailing p/e is a bit rich at 54.03, but the stock is growing quickly enough that the forward p/e (fye 31-Dec-06) isn't as bad at 30.32. Thus, with the quick growth, the "5 Yr Expected" PEG comes at at 1.12.
The Price/Sales ratio is reported at 4.86. Again, remembering Paul Sturm's article from Smart Money on Price/Sales ratios, we need to compare that ratio to other stocks in the same industry group.
Looking at the "Medical Instruments/Supplies" group, we see that KYPH is somewhere in the middle of the pack on this parameter. Alcon (ACL) tops the group with a price/sales ratio of 7.7, next is Guidant (GDT) at 6.3, Kyphon (KYPH) at 4.9, Stryker (SYK) at 4.4, Boston Scientific (BSX) at 4.1, and Baxter (BAX) at 2.4. Thus Kyphon sits in the middle on this valuation measurement.
Other facts on the Yahoo page of interest include 42.38 million shares outstanding with 28.40 million of them that float. Of these, there are a LOT of shares out short, according to Yahoo, at 5.89 million as of 4/8/05, representing 20.74% of the float or 18.123 trading days of average volume. If we use the 3 day rule, like I do, then this is quite a significant short interest and could be a bullish factor for stock performance if there is a bit of a rush to get out!
No cash dividends and no stock dividends are reported on Yahoo.
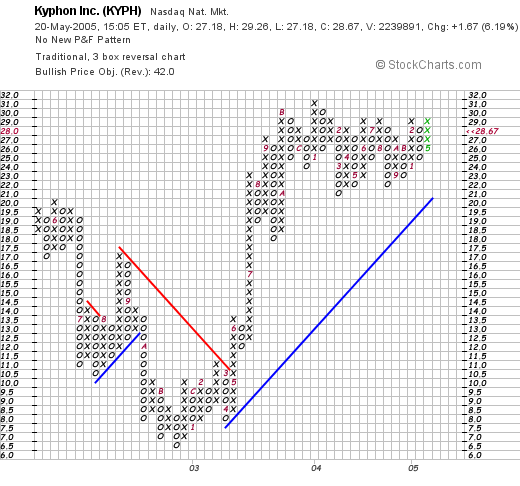
What about the chart? Looking at a "Point & Figure" chart from Stockcharts.com:

we can see that this stock was actually trading lower in 2002 from a high of $20 in June, 2002, to a low of $6.5 in late 2002. Since that point in time, the stock traded higher, breaking through resistance at $9.50 in May, 2003, and has moved to a trading range between $20 and $30 between late, 2003 and the present time. The stock has been consolidating for over a year, and may very well be "ready" to move higher!
So what do I think? Well I liked the stock enough to buy 200 shares! Seriously, the stock made a nice move today, the last quarter was great, the past five years have seen an explosive growth in revenue with a bit of inconsistency in the earnings picture. The company is generating increasing amounts of free cash and the balance sheet is gorgeous! Valuation appears a bit rich, although the Price/Sales is right in the middle of the pack. The P/E is steep but the PEG is ok. The chart appears solid to me and does not appear overextended.
Thanks again for stopping by! If you have any questions, comments, or words of encouragement, please feel free to email me at bobsadviceforstocks@lycos.com.
Bob


