Stock Picks Bob's Advice
Saturday, 23 December 2006
"Looking Back One Year" A review of stock picks from the week of August 22, 2005

Hello Friends! Thanks so much for stopping by and visiting my blog, Stock Picks Bob's Advice! As always, please remember that I am an amateur investor, so please remember to consult with your professional investment advisors prior to making any investment decisions based on information on this website.
I am trying to get things together to go out to a Christmas party this evening, but let me see if I can get this review up before I head out :). And by the way, once again let me wish all of my friends a Merry Christmas, a Happy Hanukkah, and Seasons Greetings....my best for 2007 for all of you!
This review assumes a "buy and hold" strategy. In practice, I advocate and utilize a disciplined portfolio management approach that requires me to sell my positions completely on small losses and partially at targeted appreciation points. This difference would certainly affect the performance of any investor. I employ this "buy and hold" approach for the review simply because it is the easiest and most practical way for me to review my past stock selections.
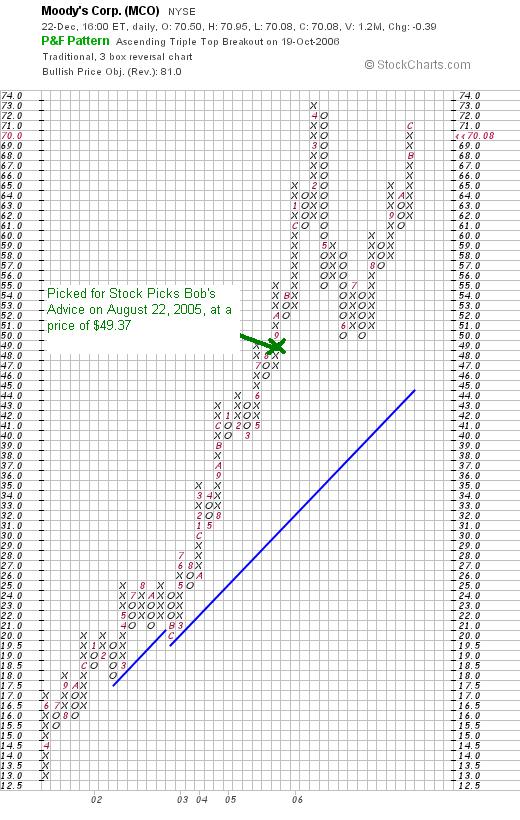
 On August 22, 2006, I posted Moody's (MCO) on Stock Picks Bob's Advice when it was trading at $49.37. Moody's closed at $70.08 on December 22, 2006, for a gain of $20.71 or 41.9% since posting.
 On October 25, 2006, Moody's reported 3rd quarter 2006 results. For the quarter ended September 30, 2006, revenue came in at $495.5 million, an increase of 18% from the $421.1 million in the same quarter in 2005. Net income came in at $157 million, up from $146.6 million last year, or $.55/diluted share, up from $.48/diluted share a year ago in the same period. This quarterly result beat analysts' expectations of revenue of $471.8 million for the quarter and earnings of $.52/share.
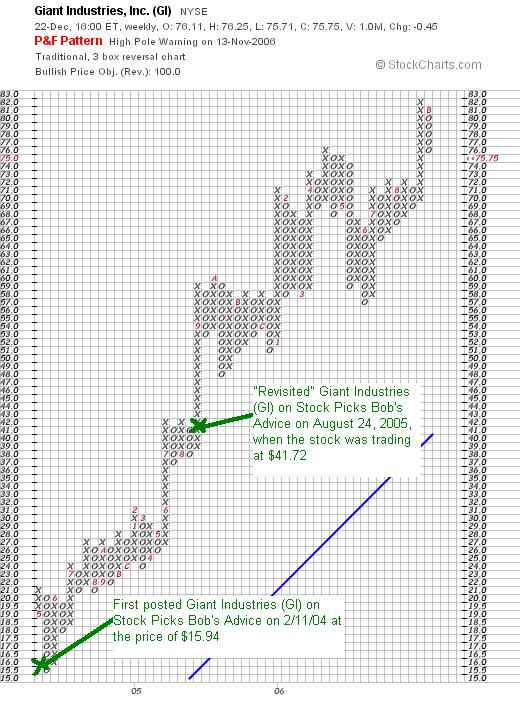
 On August 24, 2005, I posted Giant Industries on Stock Picks Bob's Advice when it was trading at $41.72. Giant Industries (GI) closed at $75.75 on December 22, 2006, for a gain of $34.03 or 81.6% since posting. It should be noted that I first posted Giant on Stock Picks Bob's Advice on February 11, 2004. Unfortunately, I didn't list the price that day, but using Yahoo "historic quotes" we can find past stock prices, and adjusted for any stock splits, GI closed at $15.94 on February 11, 2004, which would give us an effective gain of $59.81 or a 375.2% gain since that original post in 2004! I did own some shares for a short period of time but did end up getting shaken out of that position. Too bad!

Giant Industries reported 3rd quarter 2006 results on November 14, 2006. Sales for the quarter rose slightly to $1.17 billion from $1.09 billion in the same quarter last year. Net income, however, dropped to $44 million or $3/share, down from $46.6 million or $3.38/share last year. However, this reduced earnings exceeded analysts expectations of $2.47/share.
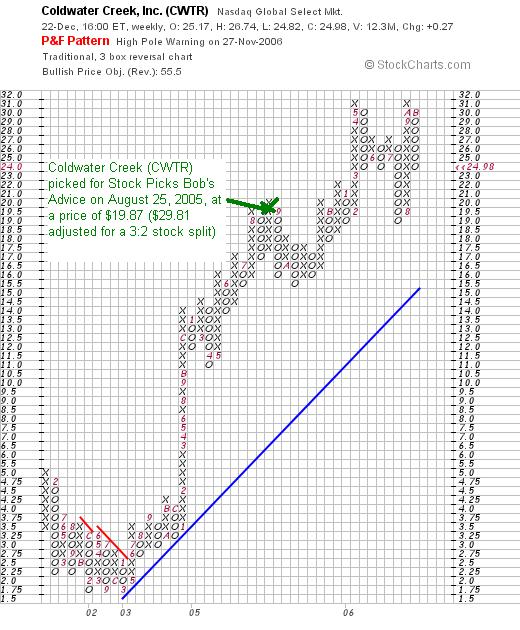
 On August 25, 2005, I posted Coldwater Creek (CWTR) on Stock Picks Bob's Advice when it was trading at $29.81. CWTR split 3:2 on 1/17/06, making my effective stock pick price actually $19.87. CWTR closed at $24.98 on 12/22/06, for an effective stock pick appreciation of $5.11 or 25.7% since posting.
Coldwater Creek announced 3rd quarter 2006 results on November 21, 2006. Net sales for fiscal 2006 third quarter climbed 37.2% to $256.4 million from $186.8 million in the same quarter last year. Net income jumped 51.8% to $15.9 million in the quarter or $.17/diluted share, up from $10.5 million or $.11/diluted share in the same quarter last year. Comparable store sales during the quarter were quite strong growing 9.9% for the three months ended October 28, 2006. This demonstrated an acceleration in growth as same store sales had increased 6.8% in the prior-year same period.

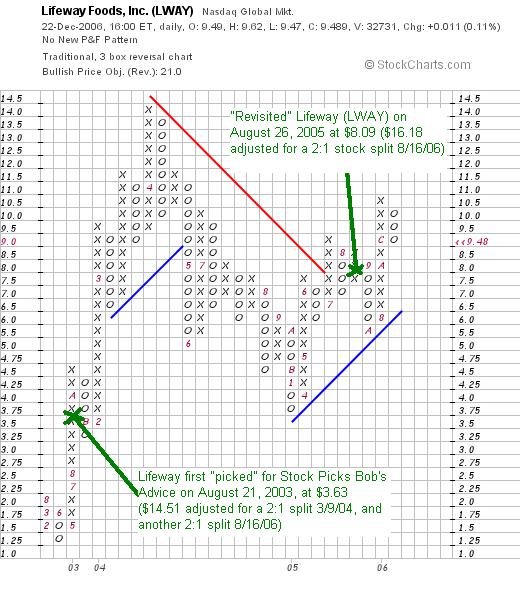
Finally, for the last stock pick that week, I selected Lifeway (LWAY) for Stock Picks Bob's Advice on August 26, 2006, when it was trading at $16.18. LWAY had a 2:1 stock split on August 16, 2006, making my effective stock pick price actually $8.09. With Lifeway closing at $9.49 on December 22, 2006, this makes my effective pick appreciation actually $1.40/share or 17.3% since posting. (The 2005 Lifeway "pick" was actually a "revisit" as I first posted Lifeway on Stock Picks Bob's Advice on August 21, 2003, when the stock was trading at $14.51/share. Adjusting that pick price for two subsequent 2:1 stock splits, gives me an effective price of actually $3.63/share. Thus, with the $9.49 close on 12/22/06, this makes that original stock pick showing an appreciation of $5.86 or 161.4% since the original post in 2003!)
On November 14, 2006, Lifeway reported 3rd quarter 2006 results. Third quarter revenues (without Helios Nutrition results) climbed 26% to $6.56 million, from last year's revenue of $5.20 million. Operating income climbed 22% in the third quarter compared with prior year operating income. No per share amounts were noted in the report.
So how did I do with these four stocks from that week in August, 2005? In a word, TERRIFIC! All four showed appreciation with an average gain of 41.6%. Now, if only I had
purchased and held on to all four of those stocks!
Thanks so much for stopping by and visiting my blog! If you have any comments or questions, please feel free to leave your feedback right on the blog or you can email me at bobsadviceforstocks@lycos.com. Also, be sure and visit my Stock Picks Podcast Website where I talk about many of the same stocks and issues I address in the blog.
Wishing all of you a very happy and healthy holiday season and New Year!
Bob
Buckle (BKE) "Revisiting a Stock Pick"
Hello Friends! Thanks so much for stopping by and visiting my blog, Stock Picks Bob's Advice! As always, please remember that I am an amateur investor, so please remember to consult with your professional investment advisors prior to making any investment decisions based on information on this website.
 Stocks sold off yesterday. Profit-taking, I guess, before the Christmas Holiday. But that didn't stop me from looking around the list of top % gainers on the NYSE where I found an old favorite of mine, Buckle (BKE), which closed at $50.90, up $1.20 or 2.41% on the day.
One of my practices here on the blog, is to avoid repeating too many stock picks without waiting a reasonable time. For me, I try to wait about a year before reposting a stock that makes the top % list of gainers again. I first posted Buckle on Stock Picks Bob's Advice on April 8, 2005, a little more than a year and a half ago when the stock was trading at $35.60. With Friday's close at $50.90, this represents an appreciation of $15.30 or 43.0% since posting.
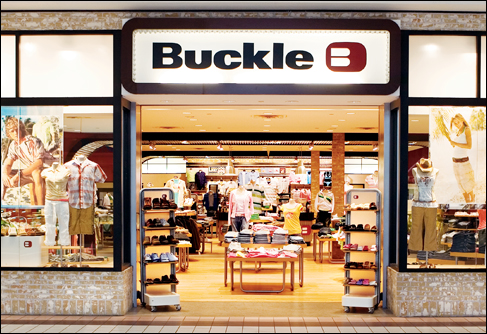
Let's take another look at this stock and I will show you why I believe it still deserves a spot on this blog!
What exactly does this company do?
According to the Yahoo "Profile" on Buckle, the company
"...operates as a retailer of casual apparel, footwear, and accessories for young men and women in the United States. It offers a selection of casual apparel, including denims, other casual bottoms, tops, sportswear, outerwear, accessories, and footwear. As of April 11, 2006, the company operated 341 stores at 4 downtown locations, 11 strip centers, 16 lifestyle centers, and 310 shopping malls in 38 states."
Is there any recent news to help explain the latest move higher?
As reported, the company recently announced a special $3 dividend to shareholders and a 3:2 stock split. Both of these are certainly bullish for the stock. Also, on November 30, 2006, the company announced sames-store sales growth of 4.2% for November. This was a reasonable figure for a retail firm, but more significantly, an improvement from the same-store sales decline of (1.5)% for the year to date.
How did the company do in the latest quarter?
On November 16, 2006, Buckle reported 3rd quarter 2006 results. As reported revenue rose 4% to $143.1 million from $138.1 million last year. Net income came in at $17.7 million or $.89/share, up from $16.6 million or $.82/share last year. Analysts had forecast $.76/share per Thomson Financial, thus the company beat expectations. While this same store sales report is of GREAT concern to me (!), the news that November sales were up 4.2% as I noted above, hopefully suggests that the company is turning around its fortunes!
How about longer-term results?
Reviewing the Morningstar.com '5-Yr Restated" financials, we can see that revenue has been steadily increasing from $387.6 million in 2002 to $501 million in 2006 and $508 million in the trailing twelve months (TTM).
Earnings, except for a dip between 2002 and 2003 when earnings dropped from $1.51/share to $1.47, have been increasing steadily to $2.54/share in 2006 and $2.64 in the TTM.
The company apparently initiated dividends in 2004 at $.20/share, and has increased that dividend steadily to $.61/share in 2006 and $.71/share in the TTM. And this does not count the one-time cash dividend recently announced.
The number of shares outstanding has been very stable with 21 million shares in 2002, dropping to 20 million in 2006 and 19 million in the TTM. The ability of a company to lower the number of shares through presumed share buybacks is a good indicator of its financial health. This can be contrasted by a company that is frequently issuing shares to maintain enough cash to continue operations.
Free cash flow has been positive and growing with $38 million in 2004 increasing to $51 million in 2006 and $59 million in the trailing twelve months.
The financial health of BKE also comes through on the balance sheet wherre the company reports $141.4 million in cash, enough to pay off both the $45.8 million of current liabilities and the $32.5 million in long-term liabilities combined almost two times over! (We can now see how the company is able to pay a special cash dividend, although we can debate whether this is indeed the best use of the cash instead of investing in its own operation.)
Calculating the current ratio, we combine the cash and other current assets, divide by the current liabilities and get a figure of 5.56. Generally, figures over 1.5 suggest reasonable financial health. This is a company that is rich in current assets.
What about some valuation numbers?
Reviewing the Yahoo "Key Statistics" on BKE, we find that this is a mid cap stock with a market capitalization of $980.94 million. The trailing p/e is a reasonable 19.25, with a forward p/e estimated (fye 28-Jan-08) at 17.20. There isn't a PEG listed on the Yahoo or the Fidelity website.
Looking at the Fidelity.com eresearch website for the Price/Sales (TTM) numbers, we can see that Buckle is a bit rich with a Price/Sales ratio of 1.90, compared with an industry average of 1.06. The company is also a little less than average on Return on Equity (ROE) with Fidelity reporting aq figure of 17.18% for the TTM, slightly below the industry average of 22.25%.
Yahoo reports Buckle with 19.27 million shares outstanding with 8.58 million that float. Of these, as of 11/10/06, there were 461,630 shares out short or 5.10% of the float. This represented 11.4 trading days of volume as of 11/10/06. With the announcement of a 3:2 stock split, and a special cash dividend, these developments could well have squeezed the shorts who may have been scrambling to buy back shares to cover their ill-conceived short-positions (?). As noted above, the company pays a 'forward' dividend of $.80/share yielding 1.6%. The last stock split was a 3:2 split in June, 1998. The upcoming split will be the first in eight years.
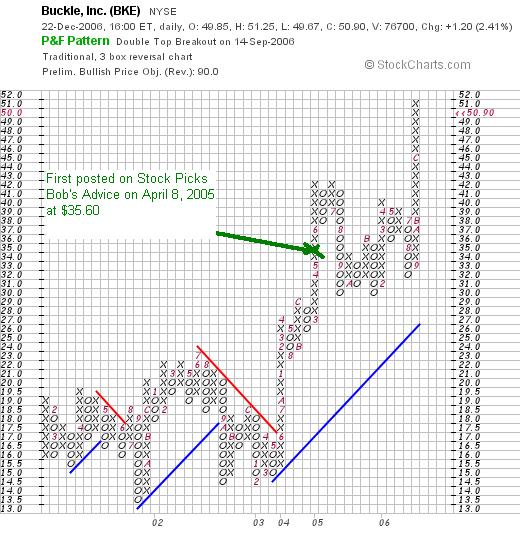
What does the chart look like?
If we review the "Point & Figure" chart on Buckle from StockCharts.com, we can see that the company was trading sideways through much of 2001 through 2003 in a range between $13.50 and $23. In June, 2003, the stock broke through resistance at around $17, and has been moving higher since. Recently, the stock broke out of the $42 range to higher levels. The stock does look a bit over-extended short-term, and may well correct short-term back to the $45 level.
Summary: What do I think about this stock?
Let's review some of the information I posted above. First of all, the company just announced a special cash dividend and a 3:2 stock split, both bullish for the price. Their latest quarterly report was good with growth exceeding expectations for earnings. Same-store sales have been anemic with a small negative figure that turned around for November. I would really like to see the company post strong figures for December as well. They are flush with cash and operating in a fashion generating additional positive cash flow. Nicely, they have been buying back shares, increasing shareholder equity. The significant short-interest is also bullish for share price.
Thanks so much for stopping by and visiting! If you have any comments or questions, please feel free to leave them on the blog or email me at bobsadviceforstocks@lycos.com. Also, if you get a chance, please feel free to visit my Stock Picks Bob's Advice Podcast Site. Have a happy holiday season, and be sure to be safe this week wherever you are traveling!
Wishing all of my friends a healthy and prosperous 2007!
Bob
Wednesday, 20 December 2006
Johnson Controls (JCI) "Revisiting a Stock Pick"
Hello Friends! Thanks so much for stopping by and visiting my blog, Stock Picks Bob's Advice! As always, please remember that I am an amateur investor, so please remember to consult with your professional investment advisors prior to making any investment decisions based on information on this website.
 I was looking through the list of top % gainers on the NYSE and was pleased to see one of my old favorites on the list, Johnson Controls (JCI). Johnson Controls closed at $86.50, up $3.06 or 3.67% on the day. My wife has some shares of JCI in her IRA and my son has some shares of JCI in his account. I do not own any shares or options of Johnson Controls.
 I write that this is an 'old favorite' because I have reviewed this stock previously on the blog. In fact, I first discussed JCI on Stock Picks Bob's Advice on July 9, 2004, when the stock was trading at $53.24. With today's stock close at $86.50, this represents a gain of $33.26 or 62.5% since posting.
I next "revisited" Johnson Controls on October 12, 2005, when the stock was trading at $63.60. Again, using today's closing price of $86.50, this still represents an increase of $22.90 or 36.0% since it was re-posted just over a year ago.
Let's take another look at this stock and I will try to share with you my thinking about why this stock may have been such a strong 'stock pick' here on the blog and why it still deserves a spot in my "vocabulary" of investment candidates.
What exactly does this company do?
According to the Yahoo "Profile" on Johnson Controls (JCI) the company
"...is an interior experience, building efficiency, and power solutions company. It operates in three segments: Building Efficiency, Automotive Experience, and Power Solutions."
How did they do in the latest reported quarter?
On October 25, 2006, Johnson Controls reported its 4th quarter 2006 results. For the three months ended September 30, 2006, sales totaled $8.2 billion, up 18% from $6.9 billion in the same quarter in 2005. Net income was $360 million, up strongly from $283 million in the same quarter last year. The company came in at $1.82/diluted share, up from $1.45/diluted share last year. The company actually missed expectations of $1.85/share on sales of $8.21 billion. On November 15, 2006, the company announced an 18% hike in its annual dividend to $.33/share, with an indicated annual rate of $1.32/share for 2007. This is the company's 32nd consecutive year of dividend increases!
What about longer-term results?
Reviewing the Morningstar.com "5-Yr Restated" financials on JCI, we see a steady picture of revenue growth from $17.4 billion in 2001 to $27.5 billion in 2005, and $31 billion in the trailing twelve months (TTM).
Earnings during this period have steadily increased from $2.52/share in 2001 to $3.90/share in 2005 and $4.90/share in the TTM.
Also, as noted above, the company pays a dividend and has been steadily increasing it! They paid $.62/share in 2001, increasing it annually to $1.00/share in 2005 and $1.09/share in the TTM.
The company has been issuing a few shares with 176 million shares outstanding in 2001, increasing to 192 million in 2005 and 196 million the TTM. This slightly greater than 10% increase in shares has been accompanied by an almost doubling of revenue and earnings. From my perspective, whenever a company can grow its revenue and earnings far faster than a small increase in shares, I can overlook this dilution.
Free cash flow has been strongly positive but slightly erratic with $205 million in 2003, $520 million in 2004, $263 million in 2005 and $572 million in the TTM.
The balance sheet is adequate, although a tad heavy on debt compared to some other stocks on this blog. They are reported to have $380 million in cash and $8,964 million in other current assets. The combined current assets of $9,344 million, when compared with the $8,683 million in current liabilities yields an adequate if tad anemic current ratio of 1.08. In addition, the company has $6,464 million in long-term liabilities.
What about some valuation numbers?
Checking the numbers on Yahoo "Key Statistics" on JCI, we find that this is a large cap stock with a market capitalization of $16.94 billion. The trailing p/e is a reasonable 16.54, with a forward p/e (fye 30-Sep-08) estimated at 12.39. The growth is estimated to continue strong as demonstrated by the '5 yr expected' PEG at 0.89. Stocks with PEGS beetween 1.0 and 1.5 are reasonable imho. Those under 1.0 are downright 'cheap'.
According to the Fidelity.com eresearch website, the Price/Sales (TTM) ratio for JCI is a cheap 0.51, compared to an industry average of 7.31. This puts the company at the 54th percentile in its industrial group in regards to its richness in valuation per this particular criterion.
Looking at the Return on Equity (TTM), we find that once again JCI exceeds its peers with a ROE of 15.42%, compared to an industry average of (64.05)%, putting JCI at the 72nd percentile in its industrial group.
Thus, the company is relatively cheap while relatively more profitable than comparable companies in its group.
Finishing up with Yahoo, we can see that there are 195.79 million shares outstanding with 194.85 million that float. As of 11/10/06, there were 1.89 million shares of JCI out short, representing 1% of the float or 1.9 trading days of volume (the short ratio). This is not very significant relative to my own '3 day rule' of short interest.
As I noted earlier, the company is paying a nice $1.32/share in dividends going forward with a forward yield of 1.60%. The last stock split was a 2:1 split that was paid out in January, 2004.
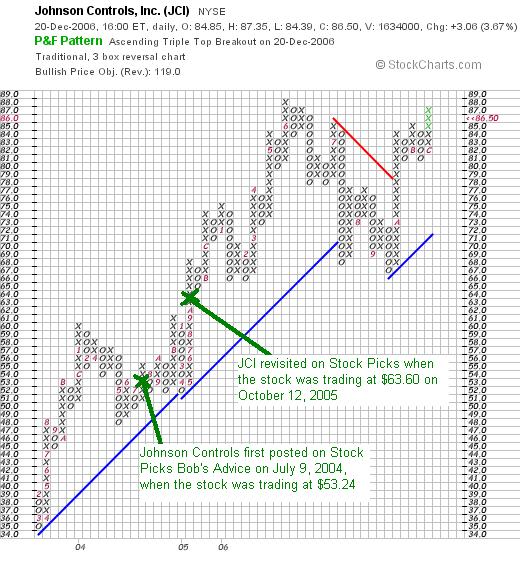
What does the chart look like?
If we examine a "Point & Figure" chart on Johnson Controls from StockCharts.com (see chart above), we can see that the stock, which was trading as low as $35 in March, 2003, moved sharply higher, to peak at $88 in June, 2006. The stock has corrected recently down to the $67 level, but now appears to have broken through resistance and is moving towards its previous record high. The stock looks strong to me!
Summary: What do I think?
Unfortunately, even though this is the third time I have reviewed this stock, and I have put a few shares in my wife's IRA, and even a smaller amound in my son's account, I still do not own any shares of this great WISCONSIN firm! (You know how loyal I am to these Badger State companies!). They moved higher today in a weak market. They reported superb earnings (although they did miss expectations by a cent or two). The Morningstar.com report is gorgeous with a steady growth in earnings, revenue and nice free cash flow.
The company does have some debt but this doens't appear to be a problem. Valuation-wise, the PEG is under 1.0, and the Price/Sales is cheap for its group, while the company is also profitable relative to other similar companies. On the downside is the fact that much of the company's business is tied up with the auto industry. However, on the upside, Johnson Controls is working on the increasingly popular hybrid auto business. While not requiring even the payment of dividends to find a stock suitable, this is an added plus, and the steady increase (32 years!) of dividends is quite impressive and another attraction to other investors.
Thanks again for stopping by and visiting! If you have any comments or questions, please feel free to leave them on the blog or email me at bobsadviceforstocks@lycos.com. Also, be sure and visit my Stock Picks Podcast Site where I discuss some of the stocks and issues I discuss here on the blog! Have a great week trading and a healthy and happy holiday season!
Bob
Monday, 18 December 2006
Joy Global (JOYG)
Hello Friends! Thanks so much for stopping by and visiting my blog, Stock Picks Bob's Advice! As always, please remember that I am an amateur investor, so please remember to consult with your professional investment advisors prior to making any investment decisions based on information on this website.
I have done several reviews of past picks this weekend and I hope you get a chance to look them over. While it may be helpful for me to review stock market investment ideas, the true test is whether these 'picks' will appreciate in price, or perhaps actually generate losses. Certainly the jury is out on the whole process that I follow, but I believe that I am onto something here!
 I was looking through the list of top % gainers on the NASDAQ today and came across Joy Global (JOYG), a stock that I believe deserves a place on my blog. As I write, Joy is trading at $48.69, up $4.46 or 10.06% on the day. I do not own any shares nor do I have any options on this stock.
Let me run through a few of the things I like to examine to explain why I like this particular company at this particular time.
 What exactly does this company do?
According to the Yahoo "Profile" on JOYG, the company
"...engages in the manufacture, servicing, and distribution of mining equipment for the extraction of coal, and other minerals and ores worldwide. It operates in two segments, Underground Mining Machinery and Surface Mining Equipment."
I like this company for an unrelated reason, it is a Wisconsin firm, and I am sure proud of some of the companies coming out of this great state. O.K., so I am a bit of a Packer Fan and a cheese-head as well :).
How did the company do in the latest quarter?
What drove the stock higher today was the announcement of 4th quarter 2006 results. Sales for the quarter ended October 28, 2006, increased 21% to $689 million, up from $568 million in the 4th quarter last year. Net income came in at $85 million or $.71/diluted share, up sharply from last year's $56 million or $.45/diluted share. Earnings beat expectations of $.66/share per Thomson First Call.
How about longer-term?
Reviewing the results from the Morningstar.com "5-Yr Restated" financials, we can see that revenue, which dropped from $1.148 billion in 2001 to $1.126 billion in 2002, has been subsequently been increasing steadily to $1.186 billion in 2003, $1.399 billion in 2004, $1.927 billion in 2005 and $2.281 billion in the trailing twelve months (TTM).
Earnings, which also dipped from $12.27/share in 2001 to a loss of $(.25)/share in 2002, turned profitable at $.16/share in 2003 and have climbed sharply to $1.20/share in 2005 and $3.13/share in the TTM.
The company also apparently initiated dividend payments at $.12/share in 2004, and have increased dividends since to $.28/share in 2005 and $.38/share in the TTM.
The company has slowly increased shares outstanding from 110 million in 2001 to 121 million in 2005, but in the TTM has reduced outstanding shares to 119 million.
Free cash flow has been positive and increasing recently with $77 million reported in 2003 increasing to $163 million in 2005 and $221 million in the TTM.
The balance sheet appears solid with $102.2 million in cash and $1.090 billion in current assets. This total of $1.192 billion in current assets, when divided by the $544.9 million in current liabilities yields a current ratio of 2.19. Generally, current ratios of 1.25 or higher are 'healthy', thus ratios over 2.0 are really quite strong imho. The company also has $456.6 million in long-term liabilities.
What about some valuation numbers?
Looking at Yahoo "Key Statistics" on Joy Global, we find that this is a large cap stock with a market capitalization of $5.77 billion. The trailing p/e is a cheap 15.59 with a forward p/e estimated (fye 29-Oct-07) at 16.51. I suspect the estimates are simply not keeping up with the 'good news'. The 5-Yr expected PEG works out to a reasonable 1.22.
The company has a Price/Sales ratio of 2.38 (TTM) according to the Fidelity.com eresearch website, which puts it ahead of the average 1.32 for the industrial group. This is at the 85th percentile of companies similar to it.
However, the company appears to be more profitable than similar companies with a Return on Equity (TTM) of 49.32%, ahead of its industry average of 22.35%. They are at the 88th percentile of their group in this regard.
Yahoo shows that there are 118.67 million shares outstanding with 118.18 million that float. Currently there are (as of 11/10/06) 3.85 million shares out short representing 3.3% of the float or 1.5 trading days of volume. This is well below my own 3 day trading volume rule. As I noted above, the company pays a small dividend yielding 1.40% going forward. The last stock split was a 3:2 split in December, 2005.
What about a chart?
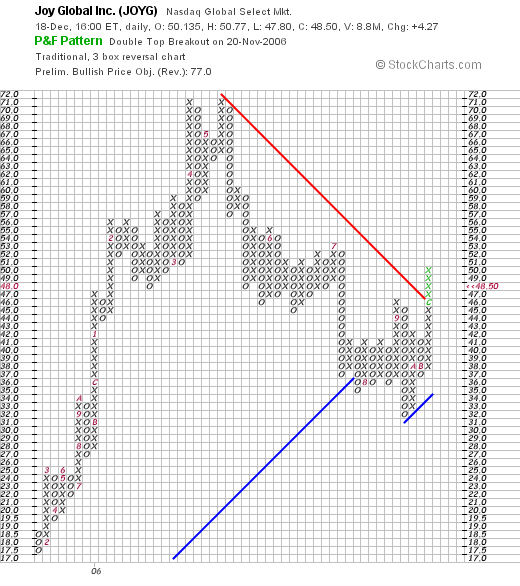
Examining the "Point & Figure" chart from StockCharts.com on JOYG, we can see that this company, we can see that this company had a shar increase in price from the $17.50 range in January, 2005, to a peak of $71 in May, 2006. The stock pulled back to the $36 range in July, 2006, and now once again appears to be moving higher, having broken through short-term resistance at the $46 level. The chart looks encouraging to me and not especially over-priced or over-extended.
Summary: What do I think about this stock?
I have to confess that I like Wisconsin firms! Well, not all of them, but this is an interesting company based out of Milwaukee! They made a nice move higher based on an earnings report with solid revenue growth, solid earnings, and that beat earnings expectations. The company has been growing its bottom line for the past several years, has initiated and increased a dividend, and is reducing its outstanding shares. Free cash flow has been steadily increasing and the balance sheet looks great. Valuation-wise we have a company with a p/e in the teens and a PEG under 1.5. They are quite profitable relative to other companies in their group and the chart looks encouraging as well.
Basically, I like this stock a lot.
But I do not have permission to be buying anything, so it shall be added to my 'vocabulary' of stocks for a future purchase possibility.
Thanks again for visiting my blog! If you have any comments or questions, please feel free to leave them on the blog or email me at bobsadviceforstocks@lycos.com. Also, be sure and visit my Stock Picks Podcast Site where I discuss many of the same stocks I write about here on the blog.
Bob
Sunday, 17 December 2006
St Jude Medical (STJ) "Long-Term Review" A New Entry in Stock Picks!

Hello Friends! Thanks so much for stopping by and visiting my blog, Stock Picks Bob's Advice! As always, please remember that I am an amateur investor, so please remember to consult with your professional investment advisors prior to making any investment decision based on information on this website.
This blog is now over 3 1/2 years old! It is walking and talking and I hope you enjoy my entries! I do a weekend review on the blog, and I am a bit over a year out from those reviews. It occurred to me that I needed to once again dig back into the early entries, and try to find out how these stocks are doing. I want to try to keep these reviews briefer (is it possible) and mostly just examine the price and the latest stock chart. Let's at least start out that way.
This blog commenced on May 12, 2003, when I wrote up St Jude Medical (STJ). I wrote:
"This is one I picked up today. STJ is the stock symbol. I do not as I write and publish this own any shares. Am thinking about suggesting this to my stock club. Company had a great day today with a nice move on the upside. Last Quarter was good and the past five years have been steady growth. Closed at $55.30 up $2.92. So the daily momentum helped it make the list."
Wouldn't it be nice if all of my entries were that short! You of course, can examine and review all of my entries by date by 'clicking' on the dates along the left side of the blog.
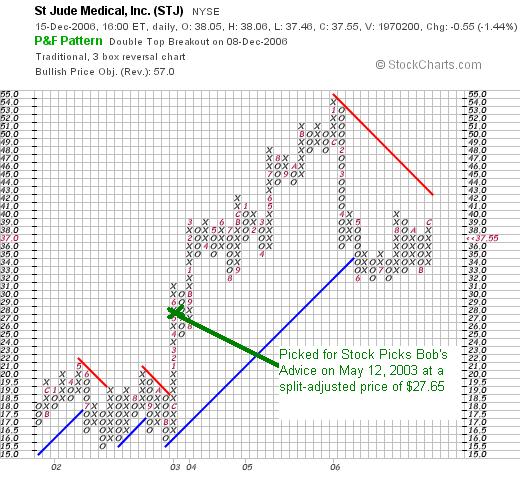
STJ actually had a 2:1 stock split on November 23, 2004, making my effective stock pick price actually $27.65. STJ closed at $37.55 on December 15, 2006, giving my first pick an appreciation of $9.90 or 35.8% since posting.
I hope these longer-term views of past stock picks....I shall try to do them in the order they are posted as long as they are still traded....and write them up on intervals.
Thanks again for visiting! If you have any comments or questions, please feel free to leave them on the blog or email me at bobsadviceforstocks@lycos.com. If you get a chance, be sure and visit my Stock Picks Podcast Site where I discuss many of the same stocks and investing issues that I review here on the blog!
Have a great week investing everyone!
Bob
Posted by bobsadviceforstocks at 10:12 PM CST
|
Post Comment |
Permalink
Updated: Monday, 18 December 2006 7:44 AM CST
"Looking Back One Year" A review of stock picks from the week of August 15, 2005
Hello Friends! Thanks so much for stopping by and visiting my blog, Stock Picks Bob's Advice! As always, please remember that I am an amateur investor, so please remember to consult with your professional investment advisors prior to making any investment decisions based on information on this website.
The weekend is almost over and I really need to get to the 'review'! I like to examine past stock picks and find out how they would have turned out if I had indeed purchased them. I occasionally do buy stocks for my trading portfolio, but when I do, I post a "trading transparency" entry! The overall performance is the average of each of the performances from the week selected. This assumes a 'buy and hold' strategy.
In practice, I advocate and utilize a disciplined portfolio management system that requires me to sell any stock which incurs a small (8%) trading loss. It also requires me to sell portions (1/6th of remaining shares) at targeted apprreciation points. Thus, this difference in portfolio management would certainly affect portfolio performance. However, for the ease of review, I have chosen to consider that I am employing a buy and hold strategy and have purchased equal-$ amounts of each stock discussed.
 On August 16, 2005, I "revisited" Fargo Electronics (FRGO) when it was trading at $17.76. This was the second time I had written up this stock, first writing up Fargo on October 6, 2003, when it was trading at $14.82/share. On May 24, 2006, Assa Abloy's HID Global Corporation was reported to have completed plans for the acquisition of Fargo (FRGO) at a price of $25.50/share. Based on the latest pick price of $17.76, this represents a gain of $7.74 or 43.6% since posting.
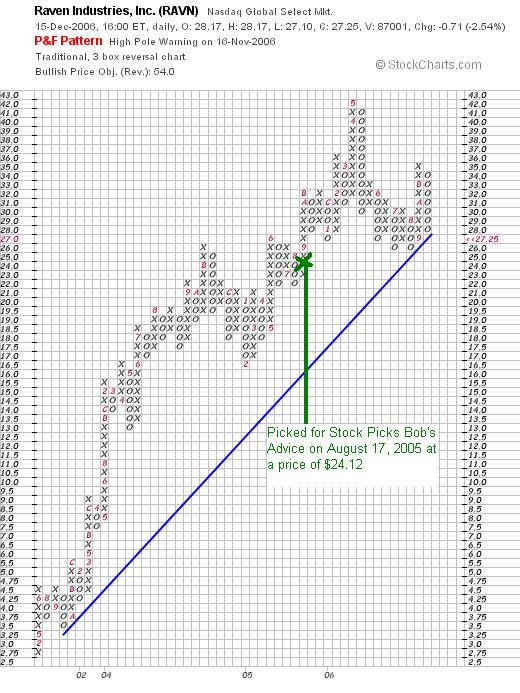
 On August 17, 2005, I posted Raven Industries (RAVN) on Stock Picks at a price of $24.12. RAVN closed on December 15, 2006, at a price of $27.25, for a gain of $3.13 or 13.0%.
On November 16, 2006, Raven Industries (RAVN) announced 3rd quarter 2006 results. For the quarter ended October 31, 2006, net sales rose 6% to $57.4 million from $54.1 million in the same quarter in 2005. Net income came in at $7.0 million, up slightly from $6.9 million or $.38/share, up from $.37/share last year.
As noted, the company also issued guidance for relatively 'flat' fourth quarter earnings compared to the prior year. So even though I give them a "thumbs-up" it isn't a very enthusiastic one at that!
On August 19, 2005, I picked LaBarge (LB) for Stock Picks when it was trading at $15.91. LaBarge closed at $13.30 on December 15, 2006, for a loss of $(2.61) or (16.4)% since being posted.
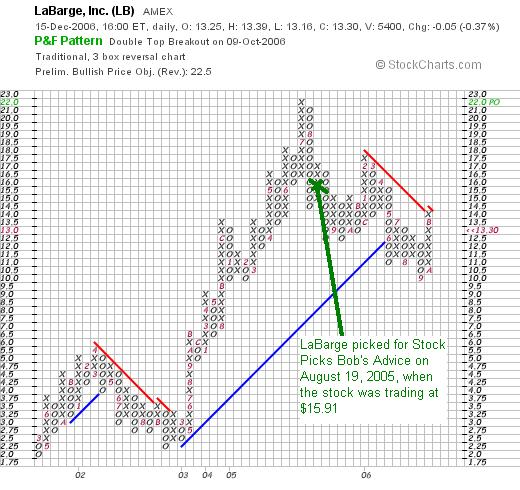
On November 2, 2006, LaBarge (LB) reported 1st quarter 2007 results. For the quarter ended October 1, 2006, net sales came in at $49.9 million, up 26% from the $39.6 million in the first quarter of 2006. Net earnings for the quarter increased 19% to $2.4 million or $.15/diluted share from $2.03 million or $.13/diluted share in the 2006 first fiscal quarter.
So how did I do picking stocks back in 2005 for the week of August 15th? I picked one stock (Fargo) that was acquired on a significant gain, one stock had a small gain another had a small loss for an average gain of 13.4%.
Thanks so much for stopping by and visiting! If you have any comments or questions, please feel free to drop me a line at bobsadviceforstocks@lycos.com or leave your comments right on the blog. If you get a chance, please visit my Stock Picks Podcast Website, where you can download sound files of me discussing many of the same stocks I write about herre on the blog!
Have a great week investing everyone!
Bob
A Reader Writes "I am intrigued by Zoltek (ZOLT)...."
Hello Friends! Thanks so much for stopping by and visiting my blog, Stock Picks Bob's Advice! As always, please remember that I am an amateur investor, so please remember to consult with your professional investment advisors prior to making any investment decisions based on information on this website.
 A few moments ago I was checking my email and saw a notice that my good friend George K. had written a note on the blog. George and I are both members of the same stock club and have gotten to be good friends over the last few years. George wrote:
"Hi Bob,
Again, thank you for your Blog...I really enjoy the way you have been editing the point/figure charts with your comments on buy/sell points...very insightful...
...Now my question...I am intrigued by Zoltek (ZOLT) and would really appreciate your comments...carbon fiber production has usually been in composite braking systems, but recently wind entergy, and sporting goods have near-term potential. I'd be very interested in your take.
Again, thanks for the fine blog
Geo"
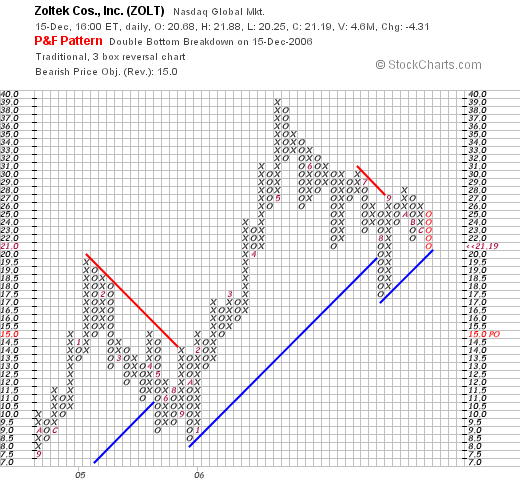
As I wrote right on the blog, I am very apprreciative of your continued support, interest, and participation on the blog. As transparency is my foremost concern on the blog, I did point out that you are in reality a good friend of mine and fellow stock club member! But that doesn't mean you can't participate here and write comments and make inquiries! Please continue George! Let me take a look at Zoltek (ZOLT) and I will give you my off the cuff 'take' on the stock today. ZOLT closed at $21.19 on 12/15/06, down $(4.31) or (16.9)% on the day.
My comments on Zoltek do not mean that I am 'picking' this stock for this blog. I frankly don't know if it meets my 'criteria', but I would be happy to review the company
 My own personal awareness of this Carbon Fiber company, came while still a subscriber to the Cabot Market Letter, a subscription that I have allowed to lapse. I did find the newsletter provocative and like everything that I read, I must assume that in some fashion it affected my own philosophy of investing. If so, for that I am thankful.
Several years ago, Zoltek (ZOLT) was a favorite of Timothy Lutts, the editor of the letter. You can read more about that episode here. I am sure that I was even a shareholder of Zoltek stock. I have not owned any shares of this company for at least several years and do not own any shares or options now.
What exactly does this company do?
According to the Yahoo "Profile" on Zoltek (ZOLT), the company
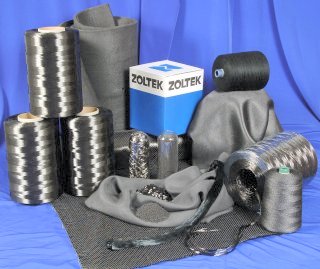 "...through its wholly owned subsidiaries, engages in the manufacture, marketing, and development of carbon fibers for various applications."
Is there any recent news of significance?
Apparently the biggest news story affecting this company was the fourth quarter 2006 results.
What were the latest quarterly results?
On December 14, 2006, Zoltek reported 4th quarter 2006 results for the quarter ended September 30, 2006. For the quarter, net sales increased 60% to $23.8 million from $14.9 million in the fourth quarter of fiscal 2005. However due to a litigation expense of $(23.1) million, the company reported a net loss of $(15.7) million from continuing operation, compared to a net loss of $(7.6) million in the same quarter last year. This works out to a net loss per diluted share of $(.89), compared to a net loss last year of $(.57)/diluted share.
These results failed to meet analysts' expectations of revenue of $31.3 million according to Thomson First Call. The company also reduced guidance on the upcoming first quarter with guidance of 'more than $30 million' suggested. Analysts are looking for revenue of $37.1 million in that quarter. In addition, the company is delinquent in its filings of its 2006 10-K as it works to 'complete documentation and other arrangements related to the funding of an appeal bond for its litigation.'
Briefly, let me just assert that in my perspective, I require a company to not only grow its revenue, as ZOLT did, but to be profitable and have growing earnings. Not only did the company lose money, but it expanded its loss year-over-year. If we take out that litigation expense, the company actually is profitable. However, revenue also failed to meet expectations and the company reduced guidance for the upcoming quarter. There are just too many questions about these results for me to endorse this one.
How about longer-term results?
Let's take a look at the Morningstar.com "5-Yr Restated" financials on this stock. First of all, a positive note is the revenue 'turn-around'. While dropping revenue from $43 million in 2001 to a low of $34 million in 2003, the company then did turn that around to $40 million in 2004, $60 million in 2005 and $88 million in the trailing twelve months (TTM). There isn't a single profitable year on this page :(. Losses initially declined from $(1.91) in 2001 to $(.48)/share in 2002. But get this: each and every year, losses have been GROWING and not shrinking or even turning profitable! The company lost $(.96)/share in 2003, $(1.40)/share in 2004, $(2.23)/share in 2005 and $(2.53)/share in the TTM.
To top this off, the company has been increasing its shares outstanding about as fast as it has been growing its revenue: 17 million shares in 2001 and 18 million in 2005, but 26 million reported in the TTM.
Free cash flow is NEGATIVE and growing increasingly poor the past few years. $(6) million in 2003, $(13) million in 2004, $(24) million in 2005 and $(29) million in the TTM.
The balance sheet looks find to me with $19.7 million in cash and $51.2 million in other current assets. Compared with the $22.4 million in current liabilities, this yields a current ratio of 3.17, about the strongest number on this page. The company is also reported to have $34.8 million in long-term liabilities.
What about the chart?
If we review the StockCharts.com "Point & Figure" chart on Zoltek, we can see a fairly strong couple of years of stock price movement from $7.50 in late 2004 to a recent high of $39 in May, 2006. The company has been under some pressure recently dropping to the $21 level, but still the chart shows relatively good strength for what appears to me to be very anemic fundamentals.
Summary: What do I think about this stock?
In general, in my Peter Lynch investing perspective, as you appear to be using in your letter, tells me that carbon fiber does have terrific potential. In fact, one potential use that you didn't discuss is in aviation, where the new Boeing 787 using this material in a very significant fashion. As has been reported:
"Commercial aerospace is considered a major driver of the capacity expansions: Each Boeing 787, for example, will use about 165,000 lb of carbon fiber composites; each Airbus A380 will use about 65,000 lb."
But you know that I am not a Peter Lynch investor, at least not in the sterotyped fashion. This is in no way a critique of his philosophy. It is just the usual 'buy what you know' type advice isn't my approach.
There are so many great stocks out there and I cannot buy them all! I stick with stocks with a certain profile that I write about over an over. I want them to have consistent revenue and earnings growth. I want them to be profitable and free-cash positive. With great balance sheets, valuation, and charts. I want it all!
ZOLT is losing increasing amounts of money. It is now issuing new shares of stock. It is burning up increasing amounts of free cash and is missing and lowering guidance on its revenue. They do have a decent balance sheet and a reasonable chart. But that simply isn't enough for me to include a stock on my list.
I do believe that the revenue growth was impressive year over year. And I like the potential for carbon fiber. But it isn't how I pick stocks.
Thanks again for writing and inquiring. ZOLT might turn out to be a TERRIFI investment, and I may have just panned the best stock for 2007. I can live with that possibility. I am just honing my own investing philosophy. Not to make a killing, but just to consistently make money.
See you next month at Stock Club where we can discuss this one further! If you or anyone else have any comments or questions, please feel free to leave them on the blog or email me at bobsadviceforstocks@lycos.com. If you get a chance, be sure and visit my Stock Picks Podcast Website! Have a great week investing everyone!
Bob
Thursday, 14 December 2006
InfraSource Services Inc (IFS)
Hello Friends! Thanks so much for stopping by and visiting my blog, Stock Picks Bob's Advice! As always please remember that I am an amateur investor, so please remember to consult with your professional investment advisors prior to making any investment decision based on information on this website.
It is getting rather late and I intend to be up early walking, so let me try, if I can, be as brief as possible about this stock. I was looking through the top % gainers list this afternoon, looking to see if I could come up with a new name. I have been revisiting lots of my past picks and I wanted to try to find some name I hadn't looked at previously, yet a stock that met the criteria that I set up for my blog. I believe I found one with Infrasourc (IFS). Let's briefly look at this stock and I will try to tell you why!
 First of all, Infrasource (IFS) closed at $22.64, up $1.14 or 5.30% on the day. That was enough, even in today's strong market, to make the top % gainers list on the NYSE. I do not own any shares of IFS nor do I have any options.
According to the Yahoo "Profile" on the stock, the company "...operates as a specialty contractor in the United States. It operates in two segments, Infrastructure Construction Services and Telecommunication Services. The Infrastructure Construction Services segment provides design, engineering, procurement, construction, testing, and maintenance services for utility infrastructure. The company offers its services to electric power utilities, natural gas utilities, telecommunication customers, and government entities, as well as heavy industrial companies, such as petrochemical, processing, and refining businesses."
I couldn't find any particular news to explain today's move.
On November 1, 2006, IFS reported their 3rd quarter 2006 results. Revenue for the quarter ended September 30, 2006, came in at $275.9 million, up 22% from the $226.6 million reported in the same period last year. Net income was $10.8 million or $.27/diluted share, up sharply from the $6.6 million or $.16/diluted share reported in the same quarter in 2005. They beat expectations as analysts had expected a profit of $.23/share on revenue of $270 million, 'according to a poll by Thomson Financial.'
For a longer-term view, we can review the Morningstar.com "5-Yr Restated" financials for IFS, which shows that from 2001 to 2003, revenue actually declined sharply from $609 million to $135 million, however, this turned around in 2004 and by 2005, revenue came in at $866 million with $977 million reported in the trailing twelve months (TTM).
Earnings were $.34/share in 2005 and $.60/share in the TTM.
Morningstar shows 39 million shares in 2005 and 40 million in the TTM.
Free cash flow which was $(3) million in 2004, $(11) million in 2005, turned positive at $61 million in the TTM.
The balance sheet appears solid with $15.8 million in cash and $275.3 million in other current assets, which easily covers both the $165.1 million in current liabilities and the $95.9 million in long-term liabilities combined. The 'current ratio' works out to be just under 2.
Checking Yahoo "Key Statistics" on IFS, we can see that this is a mid-cap stock with a market capitalization of $906.69 million. The trailing p/e is a bit rich at 37.18 and the forward p/e (fye 31-Dec-07) is estimated at 25.44. However, the '5 yr expected' PEG also is a bit rich at 2.41.
Yahoo reports 40.05 million shares outstanding with 25.57 million that float. As of 11/10/06, there were 1.15 million shares out short, working out to 3% of the float or 4.4 trading days of volume. No dividend is paid and no stock splits are reported.
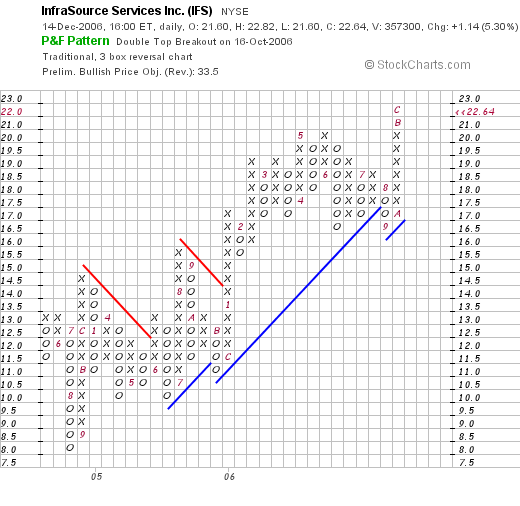
Looking at the "point and figure" chart on InfraSource from StockCharts.com, we can see a very nice graph going back to May, 2004, when the stock bottomed at $8.00. Since then, the stock has moved steadily higher and is currently pushing into new highs in the $22 range. At least for the last two or so years, the chart looks strong.
To summarize, this is a mid-cap stock that moved higher today. They had a great recent quarter and the company has been growing strongly the past few years turning itself around from a poor financial performance to strong results. Earnings have been growing nicely, the company beat expectations on its latest quarterly report, they have turned from negative cash flow to strongly positive free cash flow and the balance sheet looks nice.
This is an interesting company to consider. If I were in the market to be buying stocks today, this is the kind of stock I would be buying. Of course, I am waiting for my own "buy signal" that would be generated by a partial sale of one of my existing holdings at a targeted gain....and I don't have that yet. Meanwhile, I shall be adding this to my "vocabulary" and shall be ready to pick it up should it be on the top % gainers list again and I have 'permission' to buy!
Thanks again for stopping by. This was a bit abbreviated, but I wanted to get it recorded as I think it deserves attention. Have a great weekend!
Bob
Posted by bobsadviceforstocks at 11:42 PM CST
|
Post Comment |
Permalink
Updated: Thursday, 14 December 2006 11:43 PM CST
Tuesday, 12 December 2006
Greif (GEF) "Revisiting a Stock Pick"
Hello Friends! Thanks so much for stopping by and visiting my blog, Stock Picks Bob's Advice! As always, please remember that I am an amateur investor, so please remember to consult with your professional investment advisors prior to making any investment decisions based on information on this website.
 I was looking through the list of top % gainers on the NYSE and saw an "old favorite" of mine Greif (GEF) on the list. GEF closed at $115.75, up $6.01 or 5.48% on the day. I do not currently own any shares or options on this stock. I did own some shares for a few months, took my (8)% loss or so, and sold my shares. That is another story!
 I first wrote up Greif on April 5, 2005, on Stock Picks Bob's Advice when the stock was trading at $74.06. With today's close at $115.75, this represents a gain of $41.69 or 56.3% since posting about a year-and-a-half ago! Usually I bemoan the fact that 'only if I had purchased some shares...etc.'. In this particular case, I did purchase some shares.
In fact I did purchase 120 shares for my trading account on April 4, 2005, at a cost basis of $72.34. Unfortunately, this was a case of very bad timing, as the stock declined rather steadily to $65.42 where I sold my shares on June 3, 2005. I had taken a loss of $(6.92)/share or (9.2)%, and using my (8)% loss limit, out the shares went. Most of the time, these sales have worked well for me. But in this case, my stock picked rebounded and moved sharply higher without me :(. This only shows the limitations of any trading strategy. Overall, I am quite content with my disciplined approach, but there are times like this that I look back....well you know the feeling!
Anyhow, let me show you why I think that Greif still deserves a spot on the blog!
First of all, what does the company do?
According to the Yahoo "Profile" on Greif (GEF), the company
"...and its subsidiaries engage in the manufacture and sale of industrial packaging products, and containerboard and corrugated products worldwide. The company operates in three segments: Industrial Packaging and Services; Paper, Packaging, and Services; and Timber."
Was there any news to explain today's price jump?
Greif (GEF) is still apparently moving higher from the effect of last week's earnings report.
What was the latest earnings report?
On December 6, 2006, Greif reported 4th quarter 2006 results. For the quarter ended October 31, 2006, net sales climbed 195 to $735.6 million from $619.7 million in the fourth quarter of 2005. For the quarter, GEF reported GAAP net income of $41.7 million or $1.41 per diluted Class A share, vs. $22.0 million or $.75/diluted class A share in the same quarter in 2005.
How about longer-term?
Reviewing the Morningstar.com "5-yr Restated" financials on Greif, we can see the steady increase in revenue from $1.5 billion in 2001 to $2.4 billion in 2005 and $2.5 billion in the trailing twelve months.
Earnings, however, do not show the same steady rise. In fact, earnings dropped from $3.14/share in 2001 to a low of $.34/share in 2003 before turning sharply around to $1.66/share in 2004, $3.56/share in 2005 and $4.17/share in the TTM.
The company does pay a dividend and has been increasing it, with $.54/share paid in 2001, increasing to $.56/share in 2002, $.60/share in 2004, $.80/share in 2005 and $1.08/share in the TTM.
Nicely, the company shows 28 million shares outstanding in 2001, and has decreased this to 23 million in the TTM.
Free cash flow has been strongly positive with $34 million in 2003, increasing to $103 million in 2005 and $128 million in the TTM.
The balance sheet, as reported by Morningstar, looks adequate with $167.7 million in cash and $577.5 million in other current assets. This combined $745.2 million in current assets, when compared against the $447.6 million in current liabilities yields a strong current ratio of 1.66. The company does have an additional $786.6 million in long-term debt, but with the solid free cash flow, this doesn't appear to be much of a problem.
What about some valuation numbers?
Reviewing Yahoo "Key Statistics" on GEF, we can see that this company is a mid cap stock with a market capitalization of $2.68 billion. The trailing p/e is a moderate 27.91, but the forward p/e (fye 31-Oct-07) is estimated at a much more reasonable 17.46. With the rapid growth in earnings anticipated, the '5 yr expected' PEG is reported at a very nice 1.13.
The Fidelity.com eresearch website suggests that valuation is also reasonable with a Price/Sales (TTM) ratio of .96, with an industry average of .95, the company is sitting at the 69th percentile of its industrial group.
Besides being a 'good value' by the above measure, Fidelity also suggests it is one of the more profitable firms in its industrial group with a Return on Equity (ROE) (TTM) of 17.95%, compared to an industry average of 10.27%. This puts GEF at the 70th percentile of its group.
Returning to Yahoo, we find that there are only 23.11 million shares outstanding with 14.02 million that float. Pertinently, as of 11/10/06, there were 720,030 shares out short, which with an average trading volume of only 97,229 shares, works out to a 'short ratio' of 8 trading days. With my own peculiar 3 day rule for significance, we may well be witnessing some pressure on the short-sellers who may be feeling a bit of a squeeze as they scramble to buy shares to cover their previously sold shares in light of the sharp rise of the stock price on good news. That is just a hunch, but it probably has a bullish effect on the stock price currently.
As I noted above, the company is paying a dividend with the forward dividend rate being $1.44/share with a yield of 1.30%. No stock splits are reported on Yahoo.
What does the chart look like?
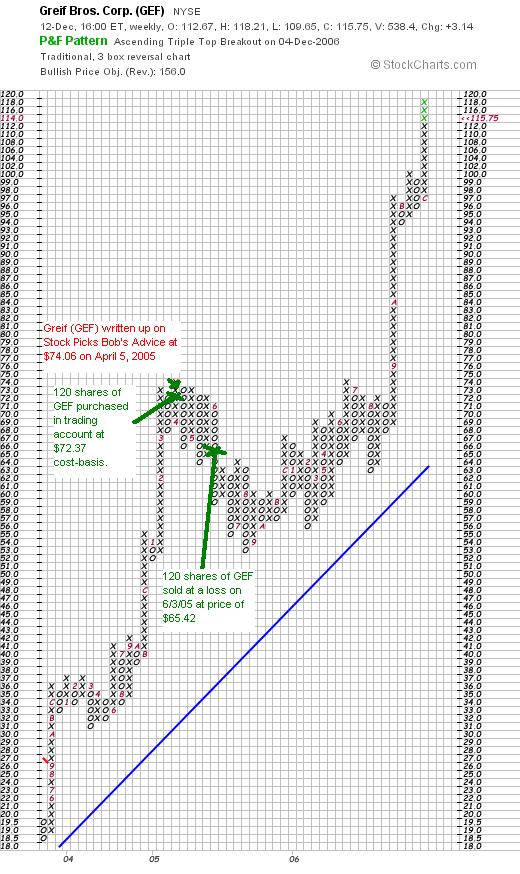
Simply Gorgeous! Take a look at the "point and figure" chart on Greif (GEF) from StockCharts.com. The weekly chart shows the stock trading as low as $18.50 in May, 2003, only to climb quickly to $74 in April, 2005, (unfortunately exactly where I entered the stock). The stock had a small "shake-out" of investors (including me!) to a level of $54 in August, 2005. The stock has been steadily increasing since to its current level of about $118.
Summary: What do I think?
Certainly, the company made a nice move the last few days. The earnings report appears solid. The Morningstar.com report also looks nice with steady revenue growth, and after turning-around the earnings results, steady earnings growth the past few years as well. The company even pays a nice dividend and has been growing that as well. In fact, the company has been buying back shares and has fewer shares than a few years ago!
Valuation-wise, the stock price, although much higher than six months ago, still appears reasonably valued, with an average Price/Sales, a high Return on Equity, a PEG just over 1.1, and a forward p/e in the teens. There are even a lot of short-sellers, who likely feel the current rise is unsustainable. But until the eventual pull-back, they are feeling the heat and likely adding to the upward price pressure.
Only if I also hadn't been shaken out :(. Anyhow, it still is an interesting stock and deserves your awareness even if it doesn't have my own ownership!
Thanks again for stopping by! If you have any comments or questions, please feel free to leave them on the blog or email me at bobsadviceforstocks@lycos.com. If you get a chance, drop by and visit my Stock Picks Podcast Website where I discuss many of the same stocks and issues that I cover here on the blog. Have a great week investing!
Bob
Monday, 11 December 2006
Palomar Medical Technologies (PMTI) "Revisiting a Stock Pick"
Hello Friends! Thanks so much for stopping by and visiting my blog, Stock Picks Bob's Advice! As always, please remember to consult with your professional investment advisors prior to making any investment decisions based on information on this website.
 I was looking through the list of top % gainers on the NASDAQ and came across an old favorite of mine, Palomar Medical Technologies, which, as I write, is trading at $55.67, up $5.61 or 11.23% on the day. I do not currently own any shares nor do I have any options on this stock.
I first wrote up Palomar on Stock Picks Bob's Advice on June 15, 2004, when Palomar was trading at $14.83. With today's price of $55.67, this represents an appreciation of $40.84 or 275.4% since posting. On January 9, 2006, I "revisited" this stock when it was trading at $39.05. Since that time, less than a year ago, this stock has appreciated another $16.62 or 42.6%!
Let's take another quick look at this stock and see if it still deserves a spot on the blog!
 What does this company do?
According to the Yahoo "Profile" on Palomar, the company
"...engages in the research, development, manufacture, marketing, sale, and distribution of light-based products for medical and cosmetic treatments. It offers products for hair removal; non invasive treatment of facial, leg veins, and other benign vascular lesions, such as rosacea, spider veins, port wine stains, and hemangiomas; removal of benign pigmented lesions, such as age and sun spots; tattoo removal; acne treatment; wrinkle removal; Pseudofolliculitis Barbae or PFB treatment; treatment of red pigmentation in hypertrophic and keloid scars; treatment of verrucae, skin tags, and seborrheic keratosis; deep tissue heating for relief of muscle and joint pain; and other skin treatments."
Was there any news to explain today's move?
According to a news story, the company received FDA approval to market an over-the-counter device for hair removal for home use. Apparently, with this approval, it is anticipated that this will greatly expand the potential sales of Palomar's products.
How did they do in the latest quarterly report?
On October 26, 2006, Palomar (PMTI) reported 3rd quarter 2006 financial results. Revenue for the quarter ended September 30, 2006, came in at $28 million, up over 40% from $19.3 million in the third quarter of 2005. Net income came in at $8.4 million or $.41/share, up sharply as well from the $4.6 million or $.24/diluted share the prior year.
And longer-term results?
Reviewing the Morningstar.com "5-Yr Restated" financials for PMTI, we can see a very pretty picture of strongly growing revenue, with $17 million in 2001, increasing to $76.2 million in 2005 and $109 million in the trailing twelve months (TTM).
Earnings, which were at a negative $(.54)/share in 2001, improved to break-even in 2002 then up to $.91/share in 2005 and $1.86 in the TTM.
The company has been increasing its shares outstanding from 10 million shares in 2001 to 18 million in the TTM. This 80% increase in shares has been accompanied by a more than 300% increase in both revenue in earnings, so it hasn't been a big problem for stockholders from my perspective.
Free cash flow has also been improving nicely with $1 million in 2003, growing to $11 million in 2004, $20 million in 2005, and $34 million in the TTM.
Per Morningstar.com, the balance sheet is pristine with $81.2 million in cash and $28.4 million in other current assets. This $109.6 million in current assets, when compared to the $20.4 million in current liabilities yields a current ratio over 5! The company has no long-term liabilities reported!
What about some valuation numbers?
According to the information on Yahoo "Key Statistics" on PMTI, the company is a mid cap stock with a market capitalization of $988.42 million. The trailing p/e is a tad rich at 29.83, and peculiarly (is this an old estimate?) the forward p/e (fye 31-Dec-07) is estimated at 32.44. In any case, analysts are not expecting the company to actually be shrinking its earnings as the "5 yr expected" PEG is reported at 0.73, making the p/e seem quite reasonable considering the expected growth in earnings.
Looking at the Fidelity.com eresearch website, we find that the Price/Sales (TTM) works out to 8.00, with an industry average of 30.83. This still puts it at the 87th percentile in its industry. The company is quite profitable with a Return on Equity (ROE) (TTM) of 53.06% compared to an industry average of 33.01%, putting it at the 91st percentile in this regard in its group.
Finishing up with Yahoo, we find that there are 17.68 million shares outstanding with 16.56 million that float. Of those that float, 31.90% are out short (!) representing 5.28 million shares or 11.6 trading days of volume. Using my "3 day rule" of short interest, this appears quite significant. And indeed, with today's announcement, we may have found the short-sellers scrambling to cover their bets against the company and maybe, they are finding that shares are tough to locate to buy! In any case, the sharp rise in stock price may well put additional pressure on the remaining shorts.
The company does not pay a dividend. The last stock split reported on Yahoo was a reverse 1:7 stock split back in May, 1999.
What about the Chart?
Taking a look at the "Point and Figure" chart on PMTI from StockCharts.com, we can see a gorgeous graph with a steady appreciation in stock price from $11.50, in June, 2004, to its current level around $58. There is no appreciable weakness, and in fact, the rate of the rise, does not appear to make the stock appear technically 'over-extended' imho. I have written in my stock pick prices and dates on the chart for your review as well!
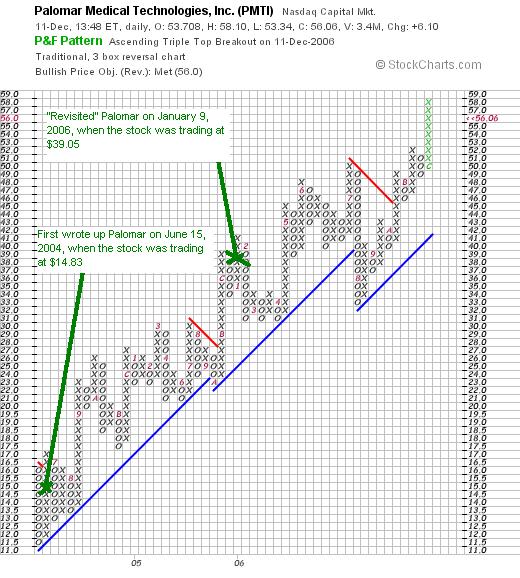
Summary: What do I think?
Well I wish I had mortgaged my house and borrowed from my credit cards and every relative I had to buy shares when I first wrote up this stock! Anyhow, the stock made a nice move on what may well be quite significant news of an over-the-counter sale of its appliances. The latest quarter was beautiful, the Morningstar.com report is gorgeous, and the balance-sheet is amazing! (Am I in love or what?) The chart looks great and valuation appears reasonable with a PEG under 1.0 and a Return on Equity near the top of its group. This is the kind of stock I would be buying today if I had permission as I call it. Meanwhile, I shall be keeping it in my "vocabulary" of investable stocks!
Thanks so much for visiting! If you have any comments or questions, please feel free to leave them on the blog or email me at bobsadviceforstocks@lycos.com. Also, please feel free to visit my Stock Picks Podcast Website, where I talk about many of the same stocks I write about on the blog!
Have a great week investing everyone!
Bob
Newer | Latest | Older


