Hello Friends! Thanks so much for stopping by and visiting my blog, Stock Picks Bob's Advice. As always, please remember that I am an amateur investor, so please consult with your professional investment advisors prior to making any investment decisions based on information on this website.
 The market is correcting a bit today, but that doesn't mean we can't be looking for interesting stock investment ideas! Scanning the list of top % gainers on the NYSE today, I came across "The Buckle", BKE, which as I write, is trading at $35.60, up $1.10 or 3.19% on the day. I do not own any shares of BKE nor do I own any options.
 According to the Yahoo "Profile" on BKE, The Buckle is "...a retailer of medium to better-priced casual apparel, footwear and accessories for fashion conscious young men and women."
What is helping the stock rise today, in the face of an overall weak equity trading day, was a story released yesterday that same store sales had jumped 8% for the month of March. Overall sales increased 13.3% to $43.2 million from $38.1 million the prior year.
On March 3, 2005, BKE reported 4th quarter 2004 results. Net sales for the fourt quarter ended January 29, 2005, jumped 8.6% to $145.6 million from $134.1 million the prior year. On a comparable store net sales basis this came in at a 3.7% increase for the period. Net income for the quarter was $17.1 million or $.79/share, up from $15.0 million or $.71/share.
 Longer-term, looking at the Morningstar.com "5-Yr Restated" financials, we can see a steady ramp-up of revenue growth from $375.5 million in 2000 to the $459.4 million in the trailing twelve months (TTM).
Earnings have been more erratic, dropping from $1.64/share in 2000 to $1.47/share in 2003, but increasing strongly since that time.
Free cash flow is solidly positive varying from $33 million in 2002 to $47 million in the trailing twelve months (TTM).
The balance sheet also looks nice with $150.1 million in cash, more than enough to pay off the $44.8 million in current liabilities as well as the $3.2 million in long-term liabilities, more than three times over! In addition, Morningstar reports that BKE has $102.6 million in other current assets.
What about "valuation"? Looking at "Key Statistics" on BKE from Yahoo, we can see that this is a mid-cap stock with a market capitalization of $762.93 million. The trailing p/e is a moderate 24.75, with a more reasonable forward (fye 31-Jan-06) of 13.68. Yahoo has the peg (5 yr expected) at 1.34. Price/sales is moderate at 1.77.
Yahoo shows that there are 21.62 million shares outstanding with 8.60 million of them that float. Of these, 110,000 shares were out "short" as of 3/8/05. This represented 1.28% of the float, or 5.5 trading days of volume.
The Buckle pays a dividend, with $.48/share reported in Yahoo, yielding 1.39%. The last stock split was a 3:2 split reported in June, 1998.
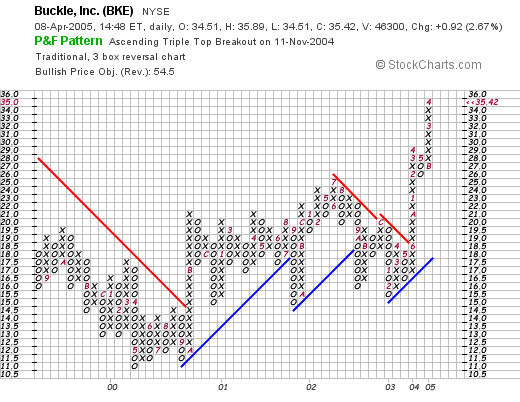
If we take a look at a chart, especially the Stockcharts.com "Point & Figure" chart on BKE, we can see that this stock was trading lower from $19.50 in October, 2000, to a low at $11.00 in May, 2000. Since then it has been steadily higher, making a sharp break towards the upside in June, 2003. The chart looks strong if a bit over-extended over the short-term.

So what do I think? Well, I like this stock for the following reasons: retail sales are strong with same store sales the latest month showing even stronger growth than the last quarter's rate, earnings were positive along with earnings the latest quarter as well as for the past five years. Free cash flow is positive, the balance sheet is beautiful with loads of cash and very low liabilities, the valuation is reasonable and the chart looks encouraging.
As always, I am sitting on my hands, as I am waiting for one of my stocks to hit a sale point at a gain. I am fairly close with AMHC, but waiting until it actually hits its sale target!
Thanks again for stopping by! If you have any questions, comments, or words of encouragement, please feel free to email me with your thoughts at bobsadviceforstocks@lycos.com. Hope you all have a wonderful weekend!
Bob


