Stock Picks Bob's Advice
Sunday, 26 February 2006
"Looking Back One Year" A review of stock picks from the week of December 6, 2004

Hello Friends! Thanks so much for stopping by and visiting my blog,
Stock Picks Bob's Advice. As always, please remember that I am an amateur investor, so please remember to consult with your professional investment advisors prior to making any investment decisions based on information on this website.
As my regular readers know, I like to pick stocks for possible investment on this blog, using my own perspective and analysis that I document on each of my posts. However, to determine if what I am writing about is actually a successful approach for picking stocks requires a retrospective analysis. Each weekend, I try to look at all of the stock selections from a week about a year earlier. Since I have missed a few of these discussions :(, I am now about 60 weeks out on my reviews. These reviews assume a buy and hold approach to investments. In practice, I do not follow this strategy and do not recommend it; in fact I sell my losing stocks quickly and completely, and my gaining stocks slowly and partially. However, for the sake of simplicity, this approach is useful to at least see what has happened to the stocks discussed on this blog!

On December 8, 2004, I
posted Cogent Systems (COGT) on Stock Picks Bob's Advice when it was trading at $35.03. COGT closed at $22.88 on February 24, 2006, for a loss of $(12.15) or (34.7)%.

On October 26, 2005, Cogent
reported 3rd quarter 2005 results. Revenue grew 64% to $38.4 million, from $23.4 million in the same quarter a year ago. GAAP Net income was $20.1 million or $.21/diluted share down from $20.4 million or $.29/diluted share the prior year. The company explained that the higher figures a year ago were related to a net tax benefit of $11.6 million; however, for this blog, I stick with GAAP (generally accepted accounting principles) numbers.

On December 6, 2004, I
discussed DaVita (DVA) on Stock Picks Bob's Advice (and also purchased some shares which were later sold in my Trading Account) at $36.42. Davita closed at $59.12 on February 24, 2006, giving this pick a gain of $22.70 or 62.3%.

On February 15, 2006, Davita (DVA)
announced 4th quarter 2005 results. Revenue was up almost 100% to $1.13 billion from $583.9 million a year earlier in the same quarter. Earnings increased 13% to $64 million or $.61/share, up from $56.6 million or $.56/share last year. In addition, hitting my so-called "trifecta", the company raised guidance for 2006 calling for income of $630 million to $700 million, up from $600 to $670 million previously estimated.
So how did I do with these two stocks from a week a bit more than a year ago? I had one loser, Cogent, with a loss of (34.7)% and one gainer, DaVita, with a gain of 62.3%. Averaging these two stocks gives me an average gain of 13.8%.
Thanks again for stopping by! If you have any comments or questions, please feel free to leave them on the blog or email me at bobsadviceforstocks@lycos.com.
Bob
Cal Dive (CDIS) Weekend Trading Portfolio Review

Hello Friends! Thanks so much for stopping by and visiting my blog,
Stock Picks Bob's Advice. As always, please remember that I am an amateur investor so please consult with your professional investment advisors prior to making any investment decisions based on information on this website.

As I like to point out on many of my entries on this blog, I am trying to do several things simultaneously on this website. First of all, I like to discuss stocks that I am interested in; stocks that meet my criteria for investment. In addition, I write about my actual trades and my actual trading portfolio. I do this for transparency, to let you know what I actually own and what I am doing with my holdings. I share with you my accomplishments and my failures.
Finally, on weekends, when I get around to it :), I like to review my trading portfolio, going alphabetically through my positions so that I may actually review these currently 22 holdings approximately twice a year. Also, on weekends, I try to review my stock picks from the prior year on a trailing 52 week (now up to about 60) basis. This particular post is about one of my actual holdings, Cal Dive (CDIS) which is currently in my trading portfolio.

On November 3, 2004, I came across Cal Dive (CDIS) on the list of top % gainers. Having just sold some shares at a gain, I had a permission slip to buy a new position and went ahead and purchased 200 shares at $38.16 and immediately
posted my trade on Stock Picks Bob's Advice. Later that day I did a more complete
review of Cal Dive on Stock Picks Bob's Advice.
I currently own 142 shares of CDIS with a cost basis of $19.10. The stock had a 2:1 split on 12/9/05. CDIS closed at $36.75 on 2/24/06, giving me a gain of $17.65 or 92.4% on my remaining shares since my purchase a little over a year ago. I have now portions of CDIS four times, selling 50 shares on 2/25/05 at a price of $49.87, for a gain of $11.67 (pre-split) or 30.5%. My second sale was for 37 shares on 8/1/05 at a price of $60.84 for a gain of $22.64 or 59.3%. My third sale was for 28 shares on 11/22/05 at a price of $73.01, for a gain of $34.81 or 91.1%. Finally, I sold 28 shares
after the stock split at a price of $41.82 for a gain of $22.72 or 119% on a post-split basis.
Since I have sold portions of my holdings four times, my next stock split would be at a 180% gain on the upside or 2.80 x $19.10 = $53.48 or on the downside, I would sell all remaining shares if the stock traces back to 50% of its highest sale point (120% x .5 = 60%), or 1.60 x $19.10 = $30.56.
Let's take a closer look at Cal Dive (CDIS). First of all, according to the
Yahoo "Profile" on Cal Dive, the company
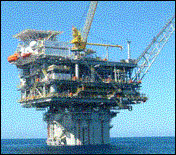
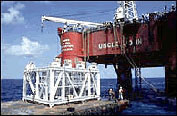
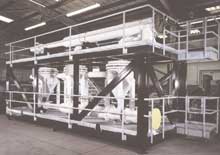
"...operates as an energy services company in the Gulf of Mexico, and in the North Sea and the Asia/Pacific regions. It offers a range of marine contracting services, such as marine construction, robotic services, manned diving, and decommissioning services. CDI, with its fleet of 22 vessels and 26 remotely operated vehicles and trencher systems, performs various services that support drilling, well completion, intervention, construction, and decommissioning projects. It also acquires and operates mature and noncore offshore oil and gas properties, as well as related production facilities."
What about the latest quarterly report? Actually, the company is
scheduled to report earnings this Wednesday, March 1, 2006. But let's take a look at the previous quarter for some idea about how the company is doing.
On November 1, 2005, Cal Dive
reported 3rd quarter 2005 results. Revenue was up dramatically to $209 million, from $132 million in the same quarter the previous year. Earnings climbed 78% to $45.7 million from $22.8 million last year or $1.05/diluted share up from $.59/diluted share. This was a very strong quarter for the company. Recently, the stock pulled back in price after the company
the acquisition of Remington Oil and Gas for $1.4 billion. (listed on "investor news" on the company website.

And how about longer-term results? Reviewing the
"5-Yr Restated" financials on CDIS from Morningstar.com, we can first of all see the beautiful progression in revenue growth from $181 million in 2000 to $543.4 million in 2004 and $698.4 million in the trailing twelve months (TTM).
Earnings have grown nicely, if not as consistently, from 4.36/share in 2000, to $1.03 in 2004 and $1.50 in the TTM. The company has expanded its shares slightly from 63 million in 2000 to 76 million in 2004 and 78 million in the TTM.
Free cash flow has been erratic with $(95) million in 2002 improving to $177 million by 2004. With the apparent $343 million acquisition of Remington, this resulted in a drop to $(63) million in free cash flow in the TTM.
The balance sheet is adequate with $150.5 million in cash and $218.2 million in other current assets, enough to cover the $198.0 million in current liabilities more than 1.5x over. (Giving us a 'current ratio' of over 1.5). The company does have a significant long-term liabilities load of $798.4 million. This does not appear to be a problem for this rapidly growing company.
And how about some valuation numbers on this stock?
Reviewing
Yahoo "Key Statistics" on Cal Dive, we can see first that this is still a 'mid-cap' stock with a market capitalization of $2.86 billion (using a $3 billion cut-off for large cap status). The trailing p/e is a reasonable 24.40 and the forward p/e (fye 31-Dec-06) is downright cheap at 12.42. Thus, the (5 yr expected) PEG is only 0.59. Generally stocks with PEG's of 1.5 or less are reasonably priced.
According to the
Fidelity.com "eResearch" website, CDIS is in the "Oil & Gas Equipment/Services" industrial group.
On a relative Price/Sales ratio comparison, Cal Dive is relatively richly valued with a Price/Sales ratio of 4.3. This is topped only by Schlumberger (SLB) at 5.1, and followed by Baker Hughes (BHI) at 3.5, BJ Services (BJS) at 3.2, Pride International (PDE) at 2.9 and Halliburton (HAL) at 1.8.
Going back to Yahoo for a few more numbers, we can see that there are 77.85 million shares outstanding and 72.30 million of them that float. Of those shares that float, 5.41 million of them are out short representing 7.20% of the float or 4.4 trading days of volume (the short ratio). Using my 3 day arbitrary cut-off, this is a bit of a large short interest and may be a bullish influence in the face of good news, especially if the earnings coming out on Wednesday are reasonably upbeat.
There is no cash dividend, and as I noted above, the company last split its stock in the form of a 2:1 split on 12/9/05.
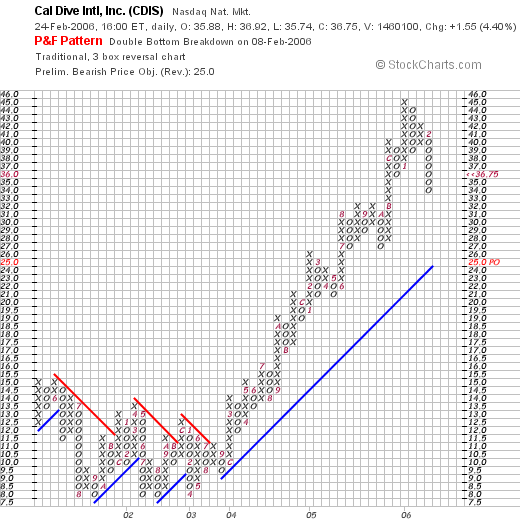
What about a chart? Looking at a
"Point & Figure" chart on CDIS from StockCharts.com, we can see that the stock was trading sideways from May, 2001, when it was at $15, until October, 2004, when it broke through resistance at around $11.50, and has climbed steadily and strongly since. Recently the stock has pulled back from heights around $45 to the current $36.75 level. The stock rise appears intact, with the support level below the current stock price.
So what do I think? Well this stock has been a great performer for me with four partial sales already at the 30, 60, 90 and 120% gain levels. The stock has pulled back to a 90% appreciation point, but I do not think the stock rise is over yet. However, much of the price movement on this stock will be in association with the oil price, making it subject to all sorts of geopolitical events.
Underlying numbers on this stock are solid with steadily appreciating revenue and earnings, free cash flow, which except for the recent acquisition, has been positive and growing. The p/e is reasonable and the PEG is under 1.0. Price/Sales-wise the stock is richly valued, but not the highest or even second-highest within its group. The chart looks nice. Overall, if the company can come in with a reasonable earnings report this Wednesday, I wouldn't be surprised to see this stock moving higher once again. On the other hand, a disappointment, could easily drop this stock to my next sale point on the downside, about $36 and if so, I shall be unloading all of my shares. We will know more later this week!
Thanks so much for stopping by and visiting! If you have any comments or questions, please feel free to leave them on the blog or email me at bobsadviceforstocks@lycos.com.
Bob
Saturday, 25 February 2006
February 25, 2006 NATCO Group (NTG)
Click ***HERE*** for my PODCAST on NTGHello Friends! Thanks so much for stopping by and visiting my blog,
Stock Picks Bob's Advice. As always, please remember that I am an amateur investor, so please remember to consult with your professional investment advisors prior to making any investment decisions based on information on this website.

I was looking through the
list of top % gainers on the NYSE yesterday and came across NATCO Group (NTG). Like so many things in my life, I never got around to writing it up yesterday, and fortunately the list of gainers is still up on Saturday, so I have another opportunity to write a few words about this stock. I do not own any shares of nor do I have any options in this company. NTG had a great day yesterday closing at $24.61, up $2.05 or 9.09% on the day.

Let's take a closer look at this stock and I will explain why I think it deserves a place on this blog!
According to the
Yahoo "Profile" on NATCO Group, the company
"...provides wellhead equipment, systems, and services used in the production of oil and gas. It offers a range of production equipment, including separators that separates hydrocarbon stream into oil, water, and gas; heaters, which prevent hydrates from forming in gas streams and reduce the viscosity of oil; oil dehydration equipment that removes water from oil; gas conditioning equipment, which removes contaminants from hydrocarbon and gas streams; and gas processing equipment for the extraction of liquid hydrocarbons to meet feed gas and liquid product requirements."

And what about the latest quarterly earnings report?
On February 22, 2006,
NATCO announced 4th quarter 2005 earnings results. For the quarter ended December 31, 2005, revenue came in at $114.8 million, up 25% from the fourth quarter 2004 results of $91.8 million. Net income for the quarter came in at $6 million or $.33/diluted share, up from a loss of $(391,000), or $(.02)/diluted share.
How about longer-term results?
Looking at the
Morningstar.com "5-Yr Restated" financials, we can see that revenue growth, which grew from $224.6 million in 2000, reached $289.5 million in 2002. From 2002 to 2001, revenue dropped slightly to $201.5 million, but since then has steadily grown again reaching $321.5 million in 2004 and $377.5 million in the trailing twelve months (TTM).
Earnings have been erratic, dropping from $.34/share in 2001 to a loss of $(.06)/share in 2004, and then bouncing back strongly to $.38/share in the TTM.
Free cash flow, which dropped from $5 million in 2002 a negative $(1) million in 2004, has also rebounded nicely to $9 million in the TTM.
The balance sheet, per Morningstar, is solid with $7.4 million in cash and $136.7 million in other current assets. Compared to a current liabilities level of $95.1 million, this gives us a current ratio of approximately 1.5. In addition, the current assets are enough to essentially cover the combined current liabilities and the $52.5 million in long-term liabilities.

How about some valuation numbers?
Reviewing
Yahoo "Key Statistics" on NATCO Group, shows that this company is a small cap stock with a market capitalization of $415.66 million. The trailing p/e, while steep at 63.26, is expected to drop quickly to 12.82 (forward p/e estimated as of fye 31-Dec-06). Thus, the PEG ratio (5 yr expected) is quite low at 0.32.
According to the
Fidelity.com eResearch website, NTG belongs in the "Oil & Gas Equipment/Services" industrial group. Within this group, the Price/Sales for this company puts it at the bottom of the list in terms of richness of valuation making this a good value as measured by this parameter.
Topping off this group is Schlumberger (SLB) with a Price/Sales ratio of 5.1, followed by Baker Hughers (BHI) at 3.5, BJ Services (BJS) at 3.2, Pride International (PDE) at 2.9, and Halliburton (HAL) at 1.8. At the very bottom is NATCO (NTG) with a Price/Sales ratio of only 1.1.
Going back to Yahoo for some more numbers on this company, we see that there are 16.89 million shares outstanding and 11.07 million that float. Of these, 60,250 shares are out short, representing 1% of the float or only 0.5 trading days of volume. There aren't a lot of short-sellers 'voting' against this stock!
The company does not pay a dividend per Yahoo, and has not split its stock any time recently.
And what about a chart?
If we take a look at a
"Point & Figure" chart on NATCO Group from StockCharts.com, we can see that this stock was trading lower from $13.50 in May, 2001, to a low of $5.50 in November, 2004. In January, 2005, the stock broke out higher and hasn't 'looked back' since.
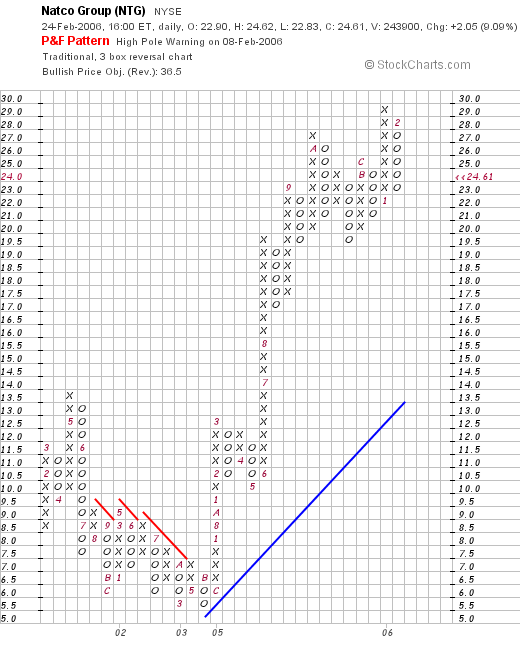
So what do I think? Well, this certainly is an interesting stock that came in with a great earnings report last week, continuing its turn-around from losses to gains on strong revenue growth. The company is riding the oil business recovery, and has an excellent record of revenue growth, a recent rebound in earnings and free cash flow. Valuation that is downright cheap with a reasonable Price/Sales ratio, a PEG under 1.0 and a forward P/E less than 15. On top of this, the chart also looks strong.
Now, if only I were able to be buying some shares, but I shall be waiting for a signal to make a purchase....with a stock of my own selling at a gain.
Thanks so much for stopping by! If you have any comments or questions, please feel free to leave them on the blog, or email me at bobsadviceforstocks@lycos.com.
Bob
Posted by bobsadviceforstocks at 10:54 PM CST
|
Post Comment |
Permalink
Updated: Sunday, 26 February 2006 12:31 AM CST
Thursday, 23 February 2006
February 23, 2006 C R Bard (BCR) Revisiting a Stock Pick
Hello Friends! Thanks so much for stopping by and visiting my blog,
Stock Picks Bob's Advice. As always, please remember that I am an amateur investor, so please remember to consult with your professional investment advisors prior to making any investment decisions.

It is a bit late here and I wanted to try to get a post in before crashing for the evening. I went to the local college production of Evita tonight; that was a great musical! If you haven't gotten around to seeing that Andrew Lloyd Weber show, take it in if you get a chance wherever you may happen to be living.
Let me try to get right to the point this evening and share with you an old favorite of mine that showed up on the
list of top % gainers on the NYSE today, C R Bard, Inc. (BCR) which closed at $66.74, up $2.88 or 4.51% on the day. I do not own any shares nor do I have any options on this stock.
I say it is an "old favorite" because I have posted this stock previously on this blog. In fact, I
posted BCR on Stock Picks Bob's Advice on December 19, 2004, when it was trading at $63.90/share. You can see that this stock has really gone almost nowhere since posting a bit over a year ago. Currently the stock is ahead of the post by $2.80 or 4.4% since posting (less than the % gain today alone!).
Well then, why do I still like the stock?
First of all, let's review what they do--according to the
Yahoo "Profile" on C R Bard, the company
"...engages in the design, manufacture, packaging, distribution, and sale of medical, surgical, diagnostic, and patient care devices. It has four product groups: Vascular, Urology, Oncology, and Surgical Specialties."

And how about the latest quarterly report?
On January 25, 2006, Bard
announced 4th quarter 2005 results. Net sales for the quarter came in at $452.0 million, a 7% increase over the prior-year period. Net income for the quarter was $80.1 million with $.75/diluted share in earnings. This was a 15% increase over the prior-year period.
How about longer-term? Reviewing the
Morningstar.com "5-Yr Restated" financials on BCR, we can see the steady pattern of revenue growth from $1.1 billion in 2000 to $1.66 billion in 2004 and $1.74 billion in the trailing twelve months (TTM).
Earnings have also steadily increased from $1.05 in 2000 to $2.82 in 2004 and $3.02 in the TTM. The company also pays a dividend which has been increasing each year, from $.41/share in 2000 to $.47 in 2004 and $.49 in the TTM.
The company has not been rapidly expanding the number of shares with 101 million in 2000 and 104 million in 2004 and 105 million in the TTM.
Free cash flow has remained strongly positive with $221 million reported in 2002, $203 million in 2004 and $273 million in the TTM.
The balance sheet, as presented by Morningstar.com looks solid to me, with $596 million in cash, enough to pay off both the $338.3 million in current liabilities and the long-term liabilities of $233.4 million combined. With the other current assets of $519.1 million, this gives BCR a 'current ratio' of approximately 3.
How about some valuation numbers?
Looking at
Yahoo "Key Statistics" on C R Bard, we can see that this is a large-cap stock with a market capitalization of $7 billion. The trailing p/e is moderate at 21.38 with a forward p/e (fye 31-Dec-07) even nicer, estimated at 17.80. The estimated growth rate is sufficient to result in a PEG of 1.40 (1.5 or less is considered a good value.)
And the Price/Sales ratio? Within the industrial group of "Medical Instruments/Supplies" according to the
Fidelity.com eResearch website, Bard is moderately priced. Alcon (ACL) is most expensive with a Price/Sales ratio of 8.1, followed by Guidant (GDT) at 6.9, Stryker (SYK) at 4.1, then C R Bard (BCR) at 4. Following Bard is Boston Scientific (BSX) with a Price/Sales ratio of 3.1, and last in the group is Baxter (BAX) with a ratio of 2.4.
Going back to Yahoo for a few more statistics, we find that there are 104.87 million shares outstanding with 104.23 million of them that float. Of these, 1.17 million shares are out short as of 1/10/06. This represents 1.10% of the float or 1.7 trading days of volume. This doesn't look very significant to me.
The company does pay an estimated $.52/share yielding 0.8% on the stock price. The last stock split was a 2:1 split in June, 2004.
And what about the chart?
If we review the
"Point & Figure" chart on BCR from StockCharts.com:
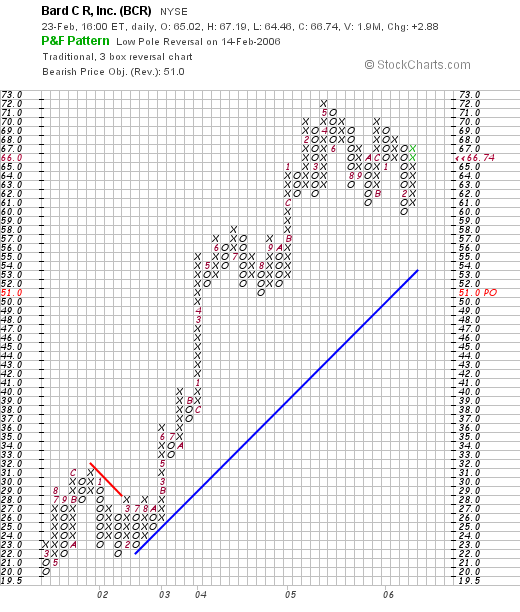
We can see that the stock has moved strongly higher since January, 2002, when it was trading at $22/share. The stock peaked at $72 in May, 2005, and has been moving sideways since. The stock price appears to have consolidated well during much of 2005 and 2006.
So what do I think? I like this stock for its consistent revenue and earnings growth, reasonable valuation, solid free cash flow, a very nice balance sheet, an a chart that looks encouraging.
Anyhow, it is very late and I am fading quickly! So have a great night and a great day tomorrow! Be sure to drop me a line at bobsadviceforstocks@lycos.com if you have any comments or questions and please feel free to leave messages on my blog!
Bob
Wednesday, 22 February 2006
Metrologic (MTLG) "Revisiting a Stock Pick"
Hello Friends! Thanks so much for stopping by and visiting my blog,
Stock Picks Bob's Advice. As always, please remember that I am an amateur investor, so please remember to consult with your professional investment advisors prior to making any investment decisions based on information on this website.

Looking through the
list of top % gainers on the NASDAQ today, I came across Metrologic (MTLG) which had a great day, closing at $23.57, up $3.41 or 16.91% on the day.
Metrologic is an old favorite of mine on this blog, having
written up MTLG on Stock Picks Bob's Advice on July 2, 2003, when it was trading at $35.60. MTLG has split twice since posting, first with a 3:2 split on July 7, 2003, and then a 2:1 split on October 31, 2003. Thus, the effective 'pick price' is actually $35.60 x 2/3 x 1/2 = $11.87/share. Thus, the stock has an actual appreciation of $11.70 or 98.6% since posting!
What drove the stock higher today, was the
announcement of 4th quarter 2005 results after the close of trading yesterday. Sales for the quarter ended December 31, 2005 increased 14.8% to $61.0 million compared with $53.1 million for the same period in the year earlier. Net income for the quarter was $9.0 million, or $.39/fully diluted share, compared with net income of $8.7 million or $.38/diluted share the prior year. Although only a small growth in earnings, the results are still positive with both revenue and earnings growing.
Let's take a closer look at this company. First of all, as to their business, the
Yahoo "Profile" on Metrologic Instruments reports , shows that the company
"...together with its subsidiaries, engages in the design, manufacture, and marketing of bar code scanning and high-speed automated data capture systems using laser, holographic, and vision-based technologies."
And how about longer-term financial results?
Reviewing the
Morningstar.com "5-Yr Restated" financials, we can see that revenue which was $116 million in 2002, has grown each year to $178 million in 2004 and $203 million in the trailing twelve months (TTM).
Earnings, which were erratic early on, with $.16/share in 2000 reported, dropping to a loss of $(.47)/share in 2001, then turned profitable at $.10/share in 2002 and increased steadily to $.99/share in 2004 and $1.08 in the TTM.
Free cash flow has been positive, if inconsistent, with $18 million reported in 2002, dropping to $5 million in 2003, and $23 million in 2004, and $18 million in the TTM.
The balance sheet looks solid with $72.2 million in cash, enough to cover both the $48.5 million in current liabilities and the $7.1 million in long-term debt combined. In addition, the company has another $73.9 million in "other current assets."
How about some valuation numbers on this stock?
Looking at
Yahoo "Key Statistics" on MTLG, we find that this is just barely a mid-cap stock with a market capitalization of $524.39 million. The trailing p/e is reasonable at 21.80, with a forward p/e (fye 31-Dec-06) at 21.23. The PEG is a very nice 1.07.
Fidelity.com puts Metrologic in the "Computer Peripherals" industrial group. Within this group, MTLG has a Price/Sales ratio of 2.2. This is one of the cheapest in this stock group led by Foundry Networks (FDRY) at 5.0, Secure Computing (SCUR) at 4.6, Emulex (ELX) at 3.7, Nice Systems (NICE) at 3.4, Metrologic (MTLG) at 2.2, and Lexmark (LXK) at 1.1.
Looking at other "key statistics", we find that there are 22.25 million shares outstanding, but only 12.12 million that float. 523,700 shares are out short as of 1/10/06, representing 3.80% of the float or 3.6 trading days of volume.
As noted above, the last stock split was a 2:1 split on 10/31/03. No cash dividends are reported by Yahoo.
And how about a chart?
Looking at the
"Point & Figure" chart from StockCharts.com:
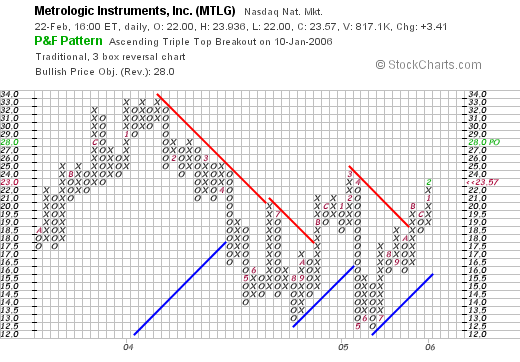
we can see that for the period documented, this stock which was initially doing well climbing to a peak of $33, then proceeded to break down in price bottoming at $12.50/share in June, 2005. The stock has subsequently been acting better, breaking through resistance in October, 2005 at $18.50, and has climbed now to $23.57 range.
So what do I think? Well the stock sure has performed well since my pick back in early 2003. However, the price has been flat for this past year. The latest quarterly report was strong and the Morningstar.com report looks nice for the past few years. Valuation-wise, the p/e is relatively low, the Price/Sales ratio is at a good valuation, and the PEG also looks nice. Revenue has also shown steady growth and the balance sheet is solid. Overall, not much to dislike about this stock, except for the relatively unimpressive chart, which recently has broken through resistance into positive territory.
Thanks so much for visiting! If you have any comments or questions please feel free to email me at bobsadviceforstocks@lycos.com or leave them right on the blog.
Bob
Sunday, 19 February 2006
A Reader Writes "Precision Castparts (PCP) came upon my radar...."
Hello Friends! Thanks so much for stopping by and visiting my blog,
Stock Picks Bob's Advice. As always, please remember that I am an amateur investor, so please remember to consult with your professional investment advisors prior to making any investment decisions based on information on this website.

Last week, my good friend George K. wrote me a note and here I am late Sunday night, catching up with things, and I really figured I owed George an answer. George is a member of my stock club as well as a friend of mine. He wrote:
"Hi Bob,
Precision Castparts (PCP) came up on my radar screen recently. I'd be interested in your take; thanks for all you've taught me and freely sharing your advice...your blog is great...
Geo"
Well, first of all, I sure appreciate your support and kind comments. When I was first putting together the ideas for this blog, George put down a list of the names I was looking at, and encouraged me that I was onto something. I hope that I still am, and appreciate your interest and support.
So let's take a brief look at Precision Castparts (PCP), and see how it fits into my perspective on stock investments. I cannot predict whether the stock will rise in the future or the price will fall, I can just tell you about a few of the things that are important to me and whether it would be a stock that I would include on my blog. But you probably knew that already :).

First, what does this company do?
According to the
Yahoo "Profile" on Precision Castparts, the company
"...provides investment castings, forgings, and fasteners/fastener systems for aerospace and industrial gas turbine applications. It operates through four segments: Investment Cast Products, Forged Products, Fastener Products, and Industrial Products."
Let's run through some of the basic screens that I like to review on a stock: latest quarter, Morningstar.com financials, and a 'point and figure' chart. By the way, PCP closed at $56.37 on 2/17/06 and I don't have any shares or options on this company. I don't know if George has any shares or options.
First, the latest quarterly result: on January 17, 2006, PCP
reported 3rd quarter 2006 results. Sales totaled $864.4 million, up 16.2% over sales of $743.9 million, the previous year same quarter. Net income (including discontinued operations) totaled $93.7 million or $.69/diluted share, vs. net income of $61.7 million or $.46/diluted share last year. These were certainly solid results!
On the 'good-news front', the company
announced a completion of an accounting review which resulted in a $1.9 million or $.01/share decrease in net income which was recorded as an adjustment in the second quarter of 2006. The 'street' hates uncertainty, and it is a positive that the company has this review of earnings behind it.
What about Morningstar? Reviewing the
Morningstar.com "5-Yr Restated" financials on PCP, we can see the erratic growth in revenue from 2001 to 2004, when revenue changed from $2 billion in 2001, down to $1.9 billion in 2004. Fortunately, strong growth has developed since, with $2.9 billion reported in 2005 and $3.1 billion in 2006.
Earnings have also been eerratic, dropping from $1.23 in 2001, to $.41 in 2002, climbing to $1.18 in 2003, then dropping all the way to a loss of $(.02) in 2005, only to come back to $.16/share in the trailing twelve months (TTM).
Free cash flow is solidly positive with $190 million in 2003, increasing to $301 million in 2005 and $287 million in the TTM.
The balance sheet is adequate with $1.2 billion in cash and other current assets, balanced against $755.9 million in current liabilities. This gives us a reasonable 1.5 current ratio.
In addition, the company has $1.05 billion in long-term liabilities.
Looking at
Yahoo "Key Statistics" on PCP, we can see that this is a large cap stock with a market capitalization of $7.51 billion. The trailing p/e is moderate at 23.95, with a forward (fye 03-Apr-07) p/e of 18.36. The PEG is a tad rich at 1.92.
There are 133.3 million shares outstanding and 132.8 million of these float. Of these, 1.64 million shares are out short representing 1.2% of the float or 3 trading days of volume (the short ratio). This short interest doesn't look very significant to me.
According to Yahoo, the company pays a small dividend of $.12/share yielding 0.20%. The last stock split was a 2:1 split in September, 2005.
How about a chart?
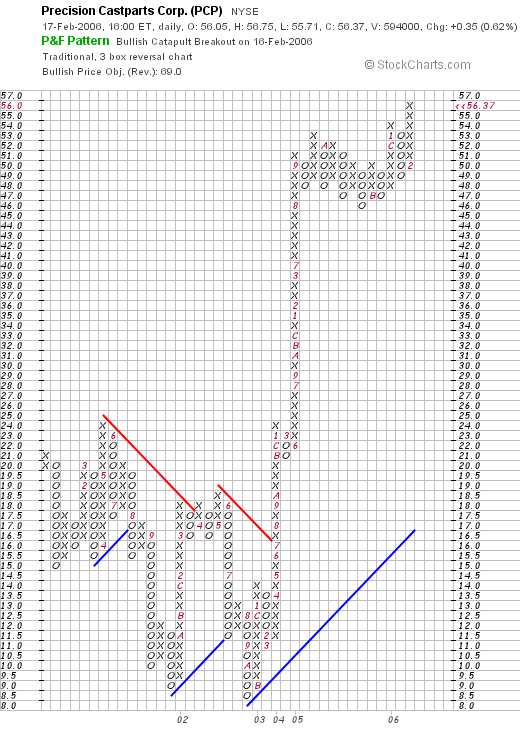
Looking at a
"Point & Figure" chart from StockCharts.com, we can see that the stock was trading very weakly from January, 2001, when it hit $24.00/share, until declining first to $9.00/share in late 2001, and then again down to $8.50 in October, 2002. Since that time, especially after breaking through resistance at $16 in July, 2004, the stock has traded strongly higher to the $56.37 level. The chart looks strong, especially the last couple of years.
So what do I think? Well this is an interesting stock market idea! I like the latest quarterly report. However, the Morningstar.com does not show the consistency in revenue and earnings growth that I generally like to see. At least for two or three years. The last couple of years have been quite strong, and the stock price has behaved accordingly.
Not a perfect fit to my blog, but then again, not too shabby a selection either! Just what I would have expected I guess.
Thanks for visiting! If you or anyone else have any other questions or comments, please feel free to leave them on the blog or email me at bobsadviceforstocks@lycos.com.
Bob
"Looking Back One Year" A review of stock picks from the week of November 29, 2004
Hello Friends! Thanks so much for stopping by and visiting my blog,
Stock Picks Bob's Advice. As always, please remember that I am an amateur investor, so please remember to consult with your professional investment advisors prior to making any investment decisions based on information on this website.
If you are a regular reader of my blog, you will know that I like to review my past stock picks each weekend with about a trailing one year period. Since I have missed a couple of wekeends along the way, this has grown to about a trailing 15 month period. This week, I am up to the week of November 29, 2004.
For the sake of reviews, I presume a "buy and hold" strategy for assessing my past stock picks. In reality, I use a very involved investment strategy, selling my losers quickly and completely at an 8% loss level, and then selling my gaining stocks slowly and partially at predetermined appreciation targets. I also have a strategy to sell stocks after they have reached targeted gains and then declined at certain pre-detmermined levels. All of these strategies will greatly affect the actual return in practice. But for the sake of these reviews, a buy and hold strategy is the easiest way to calculate returns!

On November 29, 2004, I
posted Ixia (XXIA) on Stock Picks Bob's Advice when it was trading at $15.13. XXIA closed at $13.50 on 2/17/06 for a loss of $(1.63) or (10.7)% since the stock selection here.
On February 6, 2005, XXIA
announced 4th quarter 2005 results. Net revenues for the fourth quarter ended December 31, 2005, came in at $37.5 million a 6.5% increase over last year's $35.2 million in net revenue. Net income, however, dropped to $5.5 million or $.08/diluted share, down from $7.6 million or $.11/diluted share last year.

On December 2, 2004, I
posted Gildan Activewear (GIL) on Stock Picks Bob's Advice at a price of $32.65. Gildan had a 2:1 stock split on June 1, 2005, giving me an effective "pick price" of $16.33. GIL closed at $49.30 on 2/17/05, for a gain of $32.97 or 201.9% since posting!
On February 1, 2006, Gildan
announced 1st quarter 2006 results. Sales for the quarter ended January 1, 2006, came in at $120.3 million, up 10.4% from $109.0 million in the same quarter last year. Net earnings were even better, coming in at $16.2 million, and diluted EPS of $.27/share, up 92.3% from $8.4 million or $.14/diluted share in the first quarter in 2005. These were great results! In addition, the company raised guidance for earnings for the full fiscal year.
So how did we do that week in November in 2004? Well since posting these two stocks, XXIA came in with a small (10.7)% loss and GIL came in with a fabulous 201.9% gain! Thus, the average performance for these two stocks was a gain of 95.6% since posting. Please remember that past performance is NO guarantee of future price performance! And unfortunately, I don't own Gildan or Ixia stock.
Thanks again for stopping by and visiting! If you have any questions or comments, please feel free to leave them on the blog or email me at bobsadviceforstocks@lycos.com.
Bob
Dynamic Materials (BOOM) "Weekend Trading Portfolio Review"

Hello Friends! Thanks so much for stopping by and visiting my blog,
Stock Picks Bob's Advice. As always, please remember to consult with your professional investment advisors prior to making any investment decisions based on information on this website as I am an amateur investor. If you have any comments or questions, please feel free to leave them on the blog or email me at bobsadviceforstocks@lycos.com.
One of the things I like to do on the blog, is to share with you my actual trading portfolio. I do this by posting trades as I make them and also by reviewing my holdings, one at a time, on the weekend. Going alphabetically, I am at Barnes Group (B), but since I just wrote about this stock that I just purchased this past week, we shall skip this review for now, and take a closer look at Dynamic Materials (BOOM). With 22 positions in my Trading Portfolio, and my occasional weekend that I skip, it should take me about 6 months to get through the list, allowing me to update my holdings about twice a year at this rate.

I first
discussed Dynamic Materials (BOOM) on Stock Picks Bob's Advice on May 23, 2005, when it was trading at $37.64/share. BOOM had a 2:1 stock split on October 13, 2005, giving me an effective pick price of $18.82. Dynamic Materials closed 2/17/06 at $29.55, giving my 'stock pick' an effective gain of $10.73 or 57% since posting.
I puchased 240 shares of Dynamic Materials (BOOM) on 12/5/05 at a price of $28.27. On January 27, 2006, I sold 40 shares (1/6th of my 240 share position) at a price of $37.50 for a gain of $9.23 or 32.6% over the purchase price. As you may know, the 30% appreciation point is a target for me in managing my portfolio and my strategy dictates that I sell a sixth of a holding at that level. Since I have now sold 1/6th of my position for one sale, my sale point on the downsite is
supposed to be my purchase price. As an earlier entry has pointed out, I missed that sale, and the stock rebounded to a level above my purchase price. Thus, on the downside, my sale point for my remaining shares would be at $28.27, or on the upside, another 1/6th position (or 200/6 = 33 shares) would be at 1.60 x $28.27 = $45.23.
Let's take another look at Dynamic Materials (BOOM) and see if it still fits into my strategy on this blog!
First, the profile. According to the
Yahoo "Profile" on Dynamic Materials, the company
"...engages in metalworking business in North America, western Europe, Australia, and the Far East. The company operates in two segments, Explosive Metalworking and Aerospace. The Explosive Metalworking segment utilizes explosives to perform metal cladding and shock synthesis. Its principal product is a explosion welded clad metal plate, which is used in the construction of heavy, corrosion resistant pressure vessels, and heat exchangers for petrochemical, refining, and hydrometallurgy industries. The Aerospace segment provides welding services principally to the commercial and military aircraft engine markets, and to the power generation industry."
And how about the latest quarterly report?
On November 8, 2005, BOOM
announced 3rd quarter 2005 results. For the quarter ended September 30, 2005, sales advanced 68% to $20.2 million vs. $12.1 million the prior year. Net income grew 278% to $3.2 million or $.52/diluted share, up from net income of $.8 million or $.16/diluted share in the same quarter last year. Even sequentially, from the immediately prior quarter, net income increased 49% from $2.1 million or $.35/diluted share in this year's second quarter. This was a solid performance for this company!
How about longer-term? Looking at the
Morningstar.com "5-Yr Restated" financials on BOOM, we can see the strong, if somewhat inconsistent, revenue growth from $24.3 million in 2000 to $54.2 million in 2004 and $76.1 million in the trailing twelve months (TTM).
Earnings have also been quite erratic, bouncing from $(.27)/share in 2000 to $.27 in 2001, down to a loss of $(.06)/share in 2003, and then improving to $.27/share in 2004 and $.79/share in the TTM.
The company has paid $.10/share in the TTM, the first dividends noted by Morningstar. Total shares have increased from 8 million in 2000 up to 10 million in 2004 and 12 million in the TTM.
Free cash flow has been positive, if small, with $4 million in 2002, dropping to $2 million in 2003, then increasing to $3 million in 2004 and $4 million in the TTM.
The balance sheet is solid with $1.4 million in cash and $29.2 million in other current assets, which, when balanced against the $12 million in current liabilities, gives us a current ratio of 2.5. A ratio of 1.5 or better usually is an indication of a healthy balance sheet. In addition, the company has another $6.8 million in long-term liabilities.
What about the chart?
If we look at a
"Point & Figure" chart on BOOM from Stockcharts.com:
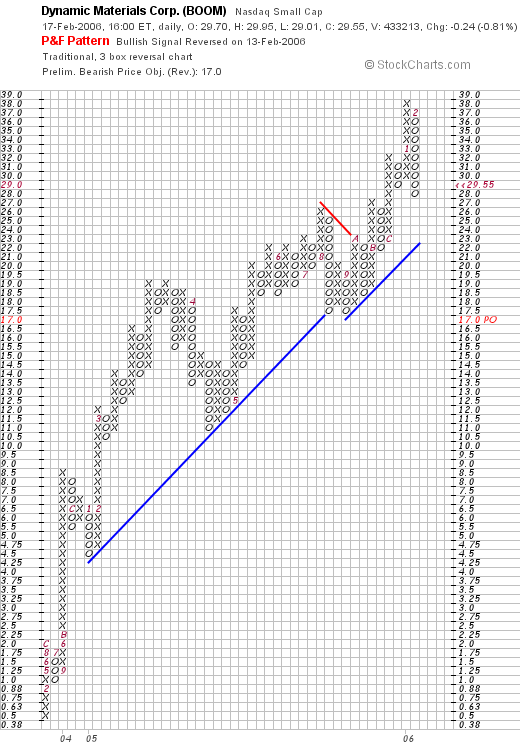
We can see the very strong upward movement of this stock from the $.50/share range in January, 2003, to the $38 range in January, 2006. The stock has recently pulled back to the $29.55 level, but still is staying well above the support (blue) line. On my limited understanding of technicals, the stock price appears steady and doesn't appear to have broken down.
What do I think?
Well, I should really have sold BOOM when it hit my cost, but the stock rebounded and by the time I realized what had happened it was once again above a selling point. In any case, the company reported a superb earnings report, and is due to report the fourth quarter results soon. Revenue growth has been solid, but earnings reports have indeed been erratic. The company is generating free cash and the balance sheet is reasonable.
Thanks so much for stopping by and visiting! If you have any comments or questions, please feel free to email me at bobsadviceforstocks@lycos.com.
Bob
Friday, 17 February 2006
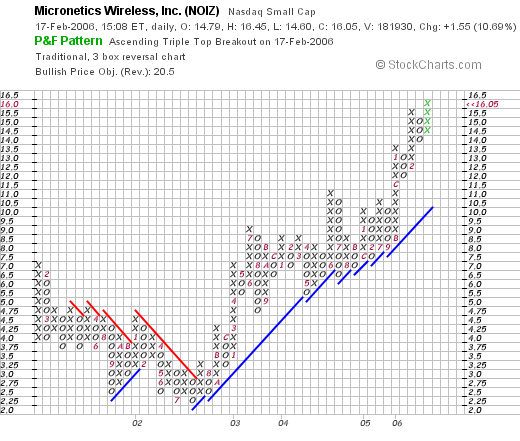
Micronetics (NOIZ) "Revisiting a Stock Pick"
Click ***HERE*** for my PODCAST ON MICRONETICSHello Friends! Thanks so much for stopping by and visiting my blog,
Stock Picks Bob's Advice. As always, please remember that I am an amateur investor, so please remember to consult with your professional investment advisors prior to making any investment decisions based on information on this website!

The market is taking a bit of a pause today, but that doesn't mean we can't look for our kind of stocks on the top % gainers list! In fact, looking through the
list of top % gainers on the NASDAQ, I came across Micronetics (NOIZ) which is an old favorite of mine, in fact a stock that I briefly owned in this trading account, but in which I was stopped out with a loss.
I first
discussed NOIZ on Stock Picks Bob's Advice on June 2, 2004, when the stock was trading at $9.33. As I write, NOIZ is trading at $16.22, up $1.72 or 11.84% on the day. Thus, the stock is trading $6.89 higher than my "pick price" or ahead by 73.8%. I do not currently own any shares of Micronetics nor do I have any options on this stock.
And what exactly does this company do?
According to the
Yahoo "Profile" on Micronetics, the company
"...engages in the design, development, manufacture, and marketing of wireless components and test equipment used in cellular, microwave, satellite, radar, and communication systems worldwide. The company's products are categorized into four groups: Receiver Components, Noise Products, Test Solutions, and VCO Products."
Last week, on February 10, 2005, the company
announced 3rd quarter 2006 results. These results include the results from the acquisition of Stealth Microwave, which occurred in 2005. Excluding sales from Stealth, net sales grew by 35%. However, including this acquisition, sales grew to $7.4 million for the quarter ended March 31, 2006, a 108% increase over sales of $3.6 million in the previous year same quarter. Net earnings for the quarter grew 360% to $662,773 or $.14/diluted share, up from $143,971 or $.03/diluted share in the same quarter in the 2005 fiscal year.

And how about results 'longer-term'? Reviewing the
Morningstar.com "5-Yr Restated" financials, we can see a fairly steady record of revenue growth (except for a small dip between 2001 and 2002), from $7.9 million in 2001 to $14.1 million in 2005 and $18.2 million in the trailing twelve months (TTM).
Earnings have been a bit more uneven dipping from $.21 to $.10/share between 2001 and 2002, and then dipping from $.34/share in 2004 to $.29/share in 2005. Earnings came in at $.35/share in the TTM, and I suspect that this figure might need updating due to the very latest report in which the company reported $.14/share, up from $.03/share the prior year.
Free cash flow has been positive or nil, with $0 in 2003, and $0 in 2005, but $1 million in free cash flow in the TTM.
The balance sheet is solid with $2.9 million in cash and $11.0 million in other current assets, balanced against $4.2 million in current liabilites. This yields a "current ratio" of almost 3:1. The company also has $7.5 million in long-term liabilities on the books as well.
And how about some 'numbers' on this stock?
Looking at
Yahoo "Key Statistics" on Micronetics, we can see that first of all, this is really a very small company with a market capitalization of only $72.02 million. This, in my view, is a "micro-cap" stock, which I define as being under $100 million in market capitalization. The trailing p/e is 35.46. We don't have a forward p/e (probably no analysts have estimates) and thus there isn't any PEG to review.
Referring to the
Fidelity.com eResearch website, the company is in the "Diversified Electronics" industrial group, and is moderately priced within this group of companies. At the top of the group in terms of richness in valuation is International Game Technology (IGT) with a Price/Sales ratio of 5.7, this is followed by JDS Uniphase (JDSU) at 5.4, Micronetics (NOIZ) at 3.1, Amphenol (APH) at 2.5, WMS Industries (WMS) at 2.4, and Molex (MOLX) at 2.3.
Other statistics from Yahoo reveal that the company has only 4.47 million shares outstanding with 3.27 million of them that float. Currently there are only 50,540 shares out short representing 1.8 trading days of volume or 1.50% of the float. This doesn't look like a significant level of short sales to me.
No cash dividend, and no stock dividend are reported by Yahoo.
What about a chart?
Reviewing a
"Point & Figure" chart on NOIZ from StockCharts.com, we can see that the stock actually declined between January, 2001, when the stock was trading as high as $7.00, to a low of $2.25 in July, 2002. The stock then broke through resistance later that month at $3.00 and has actually traded higher since then staying above its 'support lines' as illustrated by the blue lines on the point and figure chart. The stock currently is trading at the $16.00 level and the graph looks strong to me!
So what do I think? Well, I wish I hadn't sold the stock previously, that's what! But rules are rules. The stock still looks nice although much of the growth in revenue and earnings comes from the Stealth Microwave acquisition in 2005, this is an acquisition that was additive to earnings as things actually have improved earnings-wise since the acquisition. Thus the solid earnings report! The P/E is a bit rich but with the rapid growth in earnings, that too doesn't look bad. The Price/Sales ratio is moderate in the middle of its industrial group, the steady revenue growth is attractive and the nice balance sheet is good as well. At this point, the company is not burning up its free cash so to speak, however, the company is not generating much either. Finally the chart looks nice.
On a downside, the company is extremely small, and may be subject to increased volatility because of this. On the positive side of small, the potential of stock appreciation may also be greater if a large number of people try to 'get through the door' at the same time. Works both ways I guess.
Anyhow, that's my take on the stock! If you have any comments or questions, please feel free to leave them on the blog or email me at bobsadviceforstocks@lycos.com.
Bob
Posted by bobsadviceforstocks at 3:03 PM CST
|
Post Comment |
Permalink
Updated: Monday, 20 February 2006 8:29 PM CST
Thursday, 16 February 2006
A Reader Writes "Would you suggest this a good entry point for NILE?"
Hello Friends! Thanks so much for stopping by and visiting my blog,
Stock Picks Bob's Advice. As always, please remember that I am an amateur investor, so please remember to consult with your investment advisors prior to making any investment decisions based on information on this website.
Looking through my email this afternoon, I found a nice note from Subir who writes
"Bob,
I do value your advice on stocks as it gives the nuts and bolts of the
company . I am new investor and so your site helps sort through the
company's stock mumbo-jumbo as you focus on the fundamentals.. I have
bookmarked and look forward to your blog every day at work. I have been
following and mulling over buying Blue Nile (NILE) for some time . The
stock price stumbled couple of daya ago after the company did not meet
overly exuberant analyst's expectation. But from what I see it is a solid
company in a niche market. At $31 , the stock price seems a bargain with
little or no debt. Would you suggest this a good entry point for NILE.
Thanks"
Subir, thanks for writing! I appreciate your kind words and hope that I may have the opportunity of contributing some information and perspective on investing to your fund of knowledge. Let me take a look at NILE and see what it looks like from my perspective. I must point out that I am unable to predict price moves of individual stocks. Furthermore, when a stock has declined, much of the air has been let out of its tires so to speak. The momentum investors have left the party and now the value investors must shoulder the load! I do not own any shares of NILE nor do I have any options on this stock.
Let's look at three things: the latest quarterly report which disappointed, the Morningstar.com "5-Yr Restated" financials page, and a nice point and figure chart.
First the latest quarterly report: On February 7, 2006, Blue Nile (NILE)
announced 4th quarter earnings results. As they stated:
"-- Fourth quarter net sales totaled $73.2 million, compared to net sales
of $64.5 million in the fourth quarter of 2004, an increase of 13.5 %.
-- Net income in the fourth quarter increased 15.9% to $5.3 million, or
$0.29 per diluted share, from $4.6 million, or $0.24 per diluted share,
in the prior year."
Well that doesn't seem too shabby, does it? But they also went on to provide guidance for the upcoming quarter and 2006 fiscal year:
"-- First quarter net sales are expected to be between $47.0 million and
$49.0 million.
-- Net income is expected to be between $0.11 and $0.12 per diluted share.
The estimated net income per diluted share includes the estimated
impact of expensing stock options under FAS 123R of approximately $0.03
to $0.04.
Expectations for the Full Year 2006 (Year Ending December 31, 2006):
-- Net sales are expected to be between $220.0 million and $245.0 million.
-- Net income is expected to be in a range of $0.62 to $0.72 per diluted
share. The estimated net income per diluted share includes the estimated impact of expensing stock options under FAS 123R of
approximately $0.14 to $0.16."
First of all you can see that sales are expected to drop in the upcoming quarter to $47 million-$49 million, from the latest quarter of $73.2 million of sales. But you probably are right that jewelry sales are seasonal, and the period around Christmas is probably the strongest time of the year for this company. So the $220 to $245 million in sales is a reasonable growth. However, the expectation of earnings of $.62 to $.72/diluted share is unexciting as 2005 came in at a diluted eps of $.71/share. I suppose that the drop is attributed to expensing options, but in any case, I prefer to see growth in earnings even
after all of the 'footnotes' are taken care of :).
As
another article points outAnalysts projected higher per-share profit of 33 cents on $80.3 million in sales.
So this latest quarter disappointed in both earnings and revenue estimates.
Apparently, as the article continues, the estimates for the next quarter are also examples of
lowered guidance:
"Blue Nile forecast first-quarter profit of 11 cents to 12 cents per share, including stock compensation costs of 3 cents to 4 cents, with sales between $47 million and $49 million. Analysts expect profit of 19 cents per share, not including stock option costs, and sales of $54.1 million."
In other words the company lowered guidance for the upcoming quarter to a level below where current analysts were expecting the company to perform. Thus, with this single report the company, while apparently just doing swell, did a double whammy on the stock price---they missed expectations AND they lowered guidance. Exactly opposite what I have observed is the most helpful in boosting a stock price; BEATING expectations and RAISING GUIDANCE. This doesn't mean that the company isn't a great company. It just means that the price correction is part of a larger adjustment in expectations for future performance.
O.K. enough on that! How about a look at Morningstar.com?
Looking at the
Morningstar.com "5-Yr Restated" financials on NILE, we find the steady record of revenue growth from $44 million in 2000 to $169 million in 2004 and $194 million in the trailing twelve months (TTM).
This must be a fairly recent ipo as there is no record of earnings on the Morningstar.com page.
Free cash flow has been positive and growing from $16 million in 2002 to $28 million in 2004 and $23 million in the TTM.
The balance sheet is solid with $81.0 million in cash and $17.6 million in other current assets, balanced against $24.2 million in current liabilities, giving the company a 'current ratio' of approximately 4.0. Long-term debt is a very modest $900,000.
How about that chart? Looking at a
"Point & Figure" chart on NILE from StockCharts.com:
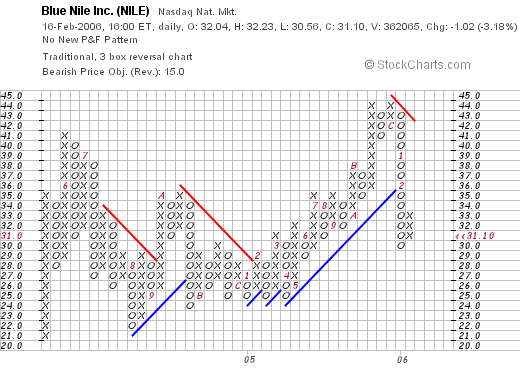
You can see that the stock was moving sideways between much of 2004 and 205 and then in April, 2005, broke out to the upside to the $44 level. The stock broke down in January, 2006, and now is looking for new support at the $31 level.
What do I think? Well, as nice as this company might look to you, I am concerned about the earnings report which disappoints by not meeting expectations for the current quarter and continues by lowering guidance for the upcoming year. Therre is a lot for this stock to work through before becoming a great-performing stock imho.
I look for great stocks that beat expectations and have management reports that raise guidance.
Please try not to confuse great companies with great stocks. The two don't always match up! In my experience, you can lose a lot of money trying to fight the street because you believe you understand a stock better than the rest of the investors. On the other hand, you can make a lot of money if you can identify a great company becoming a great stock ahead of the crowd! That is always my goal.
I hope that I have been helpful to you. And not too disappointing. I cannot tell which direction the stock of NILE will be going in the near and the long-term future. If you buy some shares, for your sake, I hope that they climb to the stratosphere! However, this is not my kind of stock to be buying at this time.
If you have any other questions or comments, please feel free to leave them on the blog or email me at bobsadviceforstocks@lycos.com.
Bob
Posted by bobsadviceforstocks at 9:28 PM CST
|
Post Comment |
Permalink
Updated: Thursday, 16 February 2006 10:20 PM CST
Newer | Latest | Older


