


Hello Friends! Thanks so much for stopping by and visiting my blog, Stock Picks Bob's Advice! I hope that your visit is enjoyable and that my thoughts also help you to think about ways of looking at stocks. Please remember that I am an AMATEUR investor, so please consult with your professional investment advisors before making any investment decisions based on information on this website. If you have any questions, comments, or words of encouragement, please feel free to email me at bobsadviceforstocks@lycos.com .
 Today, while looking through the top % gainers of the NYSE list, I came across Gildan Activewear, Inc. (GIL), which currently is trading at $32.65, up $.97 or 3.06% on the day. I do not own any shares of GIL nor do I own any options.
  According to the Yahoo "Profile" on Gil, Gildan "...is a vertically integrated manufacturer and marketer of branded basic activewear for sale princiapply in the wholesale imprinted activewear segment of the Canadian, United States, European and other international apparel markets."
What pushed the stock higher today, was the announcement of 4th quarter earnings. Sales for the quarter came in at $145.6 million, up 33.3% from $109.2 million in the same quarter last year. Net earnings came in at $16.8 million or $.56/diluted share up 18.3% and 16.7% from $14.2 million or $.48/diluted share last year. These were solid results! In addition, the company provided guidance for 2005 predicting $2.60/share in earnings on sales of $620 million. This is in contrast to $2.02/diluted share in 2004 on $533.3 million in sales.
 How about longer-term? If we look at a Morningstar "5-Yr Restated" Financials on GIL, we can see that revenue has been steadily increasing from $221.6 million in 1999 to $533.3 million as just reported in 2004. Earnings have grown steadily (except for a dip in 2001) from $.67/share in 1999 to the just-reported $2.02/share in 2004.
Free cash flow, which was a negative $(40) million in 2001, has improved and came in at $21 million in the trailing twelve months. In addition, the balance sheet, per Morningstar, shows $68.8 million in cash and $174.9 million in other current assets, as balanced against $88.9 million in current liabilities and $74.2 million in long-term liabilities. This looks just fine to me!
How about "valuation"? Using Yahoo "Key Statistics" on GIL, we can see that this is a "mid-cap" stock with a market cap of only $968.01 million. The trailing p/e is a reasonable 16.31, and the forward p/e (fye 5-Oct-05) is even nicer at 12.47. With the current growth rate, the PEG has to be substantially under 1.0, but none is reported on Yahoo. Price/sales is 1.83.
Yahoo reports 29.63 million shares outstanding with only 10.10 million of them that float. Of these, 738,000 shares are out short, representing 7.31% of the float, or a whopping 25.448 days of trading volume. If we were going to see a squeeze, this is one of the higher short "ratios" I have seen for awhile! No cash dividend is reported, and no stock dividend is noted on Yahoo.
How about a chart? Taking a look at Stockcharts.com for a Point & Figure chart on GIL:
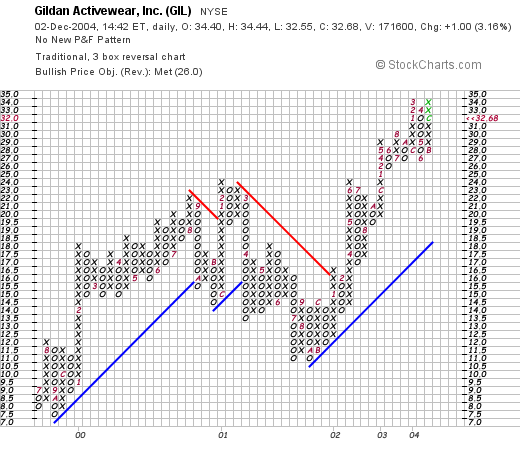
We can see that this stock was trading higher from June, 1999, and hit a temporary peak at $25 in February, 2001, (recall that earnings dropped precipitously in 2001 and then reversed upward just as fast), the stock dropped to $11/share in September, 2001, then has climbed steadily higher to its current level around $34. The chart looks nice to me! So what do I think? The stock looks very nice to me. I don't know anything first-hand about the company or their products, but it is a bit different than one of those high-tech firms! I guess I know what a tee-shirt is! Their latest earnings report is solid, they are guiding for higher growth in 2005, their Morningstar numbers look great with steady earnings and revenue growth for the past five years (except for the 2001 dip). They are generating free cash flow and they have a nice balance sheet. Valuation is great with the p/e essentially in the mid-teens, and there are a lot of shares out short!
Anyhow, if I just hit a sale on my CMN, which IS close, except for the very sloppy market today, I might just be buying some shares....however, rules are rules, and I shall be sitting on my hands for now! Thanks again for stopping by! If you have any questions or comments, please feel free to email me at bobsadviceforstocks@lycos.com .
Bob
Updated: Thursday, 2 December 2004 1:45 PM CST