Stock Picks Bob's Advice
Sunday, 29 January 2006
A New ***PODCAST*** on Ventana Medical Systems (VMSI)
Hello Friends! Thanks so much for stopping by and visiting my blog,
Stock Picks Bob's Advice. As always, please remember that I am an amateur investor, so please consult with your professional investment advisors prior to making any investment decisions based on information on this website.
Click
HERE for my PODCAST on VENTANA MEDICAL SYSTEMS (VMSI). If you have any comments or questions, please feel free to email me at bobsadviceforstocks@lycos.com.
Bob
Saturday, 28 January 2006
"Looking Back One Year" A review of stock picks from the week of November 8, 2004

Hello Friends! Thanks so much for stopping by and visiting my blog,
Stock Picks Bob's Advice. As always, please remember that I am an amateur investor, so please remember to consult with your professional investment advisors prior to making any investment decisions based on information on this website.
The Weekend Review is designed to evaluate the performance of past stock "picks" by reviewing them approximately a year later, advancing a week at a time. This review assumes a buy and hold approach and is not the strategy actually employed in my own trading portfolio which employs sales at 8% losses and small sales of gaining stocks at targeted gains. However, for the sake of review, this "buy and hold" approach serves us well.

On November 10, 2004, I
selected ASV (ASVI) for Stock Picks Bob's Advice when it was trading at $44.07. ASVI split 2:1 on 8/25/05, giving me an effective pick price of $22.04. ASVI closed at $33.54 on 1/27/06, giving us a gain of $11.50 or 52.2%. I do own some shares of ASVI in a managed retirement account.

On October 27, 2005, ASVI
announced 3rd quarter 2005 results. Net sales for the quarter ended September 30, 2005, grew 70% to $69.2 million, compared with $40.6 million in the same period in 2004. Net earnings for the quarter grew 81% to $8.0 million from $4.4 million the prior year. On a per diluted share basis this came in as a 71% increase to $.29/share compared with $.17/share in the same quarter in 2004. In addition the company raised guidance in the same announcement for both sales and earnings. This was what I call a "trifecta" in a report, increased revenue and earnings and raised guidance!

On November 14, 2004, I
posted GameStop (GME) on Stock Picks Bob's Advice when it was trading at $23.50. GME closed at $39.14 on 1/27/06 for a gain of $15.64 or 66.6% since posting.

On November 29, 2005, GameStop
announced 3rd quarter 2005 results. Sales came in at $534.2 million, up 28.2% from $416.7 million the prior year. However, same store sales decreased 12% during the quarter. And the company reported a net loss of $2.5 million, compared with $12.0 million in earnings the prior year. This worked out to a per diluted share loss of $(.04) compared to earnings of $.21/share last year. Much of the loss was attributed to the merger with Electronics Boutique. In fact, GameStop
announced December same store sales results which came in at a gain of 8.7% as reported on January 5, 2006. So all is not lost at GME :).
So how did I do with these two picks? In a word, fantastic! ASVI was up 52.2% and GME was up even stronger at 66.6% appreciation. The average gain for these two stocks worked out to a gain of 59.4%.
Thanks so much for stopping by! Please remember that past performance is not a guarantee of future performance! If you have any comments or questions, please feel free to leave them on the blog or email me at bobsadviceforstocks@lycos.com.
Bob
"Weekend Trading Portfolio Analysis" Ventana Medical Systems (VMSI)

Hello Friends! Thanks so much for stopping by and visiting my blog,
Stock Picks Bob's Advice. As always, please remember that I am an amateur investor, so please remember to consult with your professional investment advisors prior to making any investment decisions based on information on this website.
It is the weekend and I would like to continue to review the stocks in my
Trading Portfolio. These are the real holdings in my trading account, stocks that I have picked and purchased based on my trading strategies on this blog. Two weeks ago I
reviewed Meridian Biosciences (VIVO) on Stock Picks Bob's Advice, today I am at the bottom of my list alphabetically and would like to take a look at Ventana Medical Systems (VMSI).

Ventana was an early pick of mine on this blog. I
posted Ventana Medical Systems (VMSI) on Stock Picks Bob's Advice on December 23, 2003, when it was trading at $39.80. Ventana had a 2:1 split March 15, 2005, giving me an effective stock pick price of $19.40. VMSI closed at $41.42 on 1/27/06, giving my pick an appreciation of $22.02 or 113.5% since my selection.
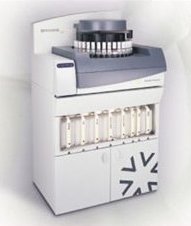
I currently own 225 shares of Ventana (VMSI) which were acquired 4/16/04 at a cost basis of $23.47/share. With yesterday's (1/27/06) closing price of $41.42, these shares currently have an unrealized gain of $17.95 or 76.5% since my purchase of these shares.
Since it is my strategy to sell gaining stocks slowly and partially at pre-determined appreciation levels, I have already sold portions of my VMSI holding at the 30% and 60% levels. My next planned sale of a 1/6th of my remaining shares on the upside would be at a 90% appreciation level or 1.90 x $23.47 = $44.59. On the downside, since I like to allow my shares to retrace only 50% of the highest sale point on a decline, I plan on selling all remaining shares if the stock should drop back to the 30% gain level or 1.30 x $23.47 = $30.51.
Let's take a closer look at this stock.
First of all, let's review their business. As described by the
Yahoo "Profile" on Ventana, the company
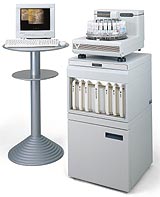
"...engages in the development, manufacture, and marketing of instrument-reagent systems that automate slide staining in anatomical pathology and drug discovery laboratories worldwide. Its clinical systems are used in anatomical pathology labs in analyzing human tissue to assist in the diagnosis and treatment of cancer and infectious diseases. The company’s drug discovery systems are used by pharmaceutical and biotechnology companies to accelerate the discovery of new drug targets and to evaluate the safety of new drug compounds."
And how about the latest quarterly result?
On October 21, 2005, VMSI
reported 3rd quarter 2005 results. For the quarter ended September 30, 2005, sales came in at $50.7 million, up 29% over the same quarter in 2004. Net income for the quarter was $3.6 million or $.10/diluted share, compared with net income of $4.1 million or $.11/diluted share last year. This
was a drop in net income for the company and is not my preferred result. If this is repeated, it certainly would be a consideration to sell the stock on fundamental weakness.
And how about longer-term? Looking at the
Morningstar.com "5-Yr Restated" financials, revenue has grown steadily from $71.1 million in 2000 to $166.1 million in 2004 and $192.9 million in the trailing twelve months (TTM).
Earnings have also grown steadily from a loss of $(.93)/share in 2000 to $.59/share in 2004 and $.64/share in the TTM.
Free cash flow is positive and growing from $5 million in 2002 to $21 million in 2004 and $27 million in the TTM. The balance sheet as presented by Morningstar.com also looks solid with $47.7 million in cash, enough to cover both the $42.3 million in current liabilities and the $2.4 million in long-term liabilities combined. In addition, Morningstar reports an additional $58.4 million in other current assets.
How about valuation?

Reviewing
Yahoo "Key Statistics" on Ventana, we find that this is a mid-cap stock with a market capitalization of $1.50 billion. The trailing p/e is rich at 64.72 and the forward p/e is also a bit steep (fye 31-Dec-06) at 40.21. The PEG (5 yr expected) is a bit high as well at 1.77.
According to information on the
Fidelity.com eResearch website, Ventana is in the "Medical Instruments/Supplies" industrial group. Within this group, the stock is also richly valued with a Price/Sales ratio of 7.9. This is only exceeded by Alcon (ACL) at 9.4. Other stocks in the group include Guidant (GDT) with a Price/Sales ratio of 6.7, Stryker (SYK) at 4.4, Boston Scientific (BSX) at 2.8 and Baxter (BAX) at 2.4.
Returning to Yahoo for some additional numbers on this company, we find that there are 36.12 million shares outstanding with 2.58 million shares out short representing 8.10% of the float or 7.9 trading days of volume (the short ratio). Using my 3 day cut-off for significance, we can see that there are a lot of short-sellers on this stock. If the company comes in with a strong quarterly report for the quarter, this may mean the shorts will be squeezed. However, with a weak report, the shorts will be vindicated. In any case, they will need to buy back the shares.
No cash dividend is paid and the last stock split, as noted above, was a 2:1 split in March, 2005.
And how about a chart? Looking at a
"Point & Figure" chart on Ventana (VMSI) from Stockcharts.com:
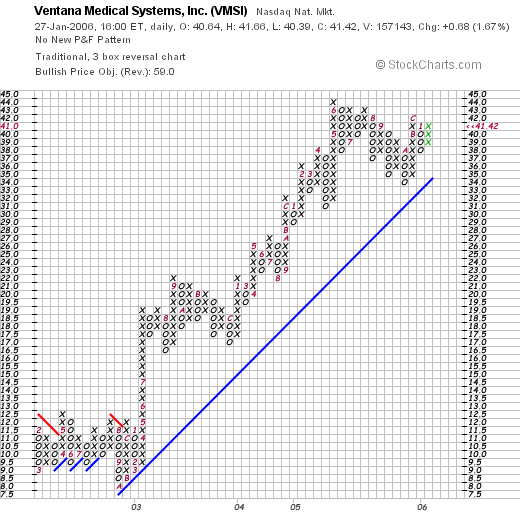
We can see that the stock was trading sideways between February, 2002, and October, 2002, when it was trading in a range beteween $8.00 and $12.00. However, in January, 2003, the stock broke through resistance and has been heading higher since, currently at the $41.42 level. Overall, the graph looks strong to me!
So what do I think? Well I like the stock well enough to own it. The Morningstar.com report is quite strong as is the chart. However, the latest quarter had a glimpse of weakness with the earnings down a tad from the prior year. In addition, the standard measurements of valuation, such parameters as the P/E, PEG, and the Price/Sales ratio all look a bit pricey. I am awaiting the earnings for the final quarter of the year. If these are strong, we may see a nice price appreciation with the large number of short sales outstanding.
Thanks so much for visiting. If you have any comments or questions, please feel free to leave them on the blog or email me at bobsadviceforstocks@lycos.com.
Bob
p.s.: Next week I shall be starting over once again at the top of the list of stocks in the trading portfolio!
Posted by bobsadviceforstocks at 12:43 PM CST
|
Post Comment |
Permalink
Updated: Saturday, 28 January 2006 1:19 PM CST
"Revisiting a Stock Pick" Packeteer (PKTR)
Hello Friends! Thanks so much for stopping by and visiting my blog,
Stock Picks Bob's Advice. As always please remember that I am an amateur investor, so please consult with your professional investment advisors prior to making any investment decisions based on information on this website.

As I promised, I want to write a few words about Packeteer, a stock that I purchased shares in yesterday. If you are familiar with my trading strategy, you will know that I own a maximum number of positions in my trading portfolio, which I have set at 25. My approach has been to have my own portfolio holdings determine whether I should be moving into or out of equities. I do this by adding a new position when I sell a portion of one of my existing positions at a gain (what I call "good news"); I move back into cash when I sell one of my positions at a loss or a retracement of a gain (what I call "bad news"). Yesterday, my Dynamic Materials stock (BOOM) hit my first appreciation target for a sale (30%). I sold 1/6th of my holding of BOOM and set out to find a new position.

With that "permission slip" or as I like to say, that "nickel burning a hole in my pocket", I set out to identify a candidate for purchase. Looking through the
list of top % gainers on the NASDAQ yesterday, I came across Packeteer, Inc., near the top of the list. Packeteer closed yesterday at $12.15, up $2.66 or 28.03% on the day. I purchased 400 shares of PKTR at $11.91 in my trading account. I had done a quick review and found it suitable for purchase and made the trade.
Packeteer is an old "favorite" of mine, a name I use to refer to stocks I have discussed previously on this blog. In fact, Packeteer, which I have not previously owned in my trading account, was an early selection on this blog. I
posted Packeteer (PKTR) on Stock Picks Bob's Advice on June 10, 2003, over 2 1/2 years ago (!) when the stock was trading at $15.10. So the stock is actually trading
lower than when I first "picked" it! The stock is down $(2.95) or (19.5)% since posting. So certainly, this stock has
not gotten away from us!

First, let's review what this company actually does. For that, I like to refer to the
Yahoo "Profile" on Packeteer which reports that the company
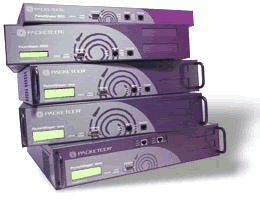
"...provides wide area network application traffic management systems to enterprise customers and service providers. Its application traffic management system consists of a family of appliances, including PacketSeeker, PacketShaper, PacketShaper Xpress, PolicyCenter, and ReportCenter. PacketSeeker offers application monitoring that involves automatic identification and classification of traffic through Layer 7 to enable organizations to analyze application performance and network utilization."
I am not a very sophisticated hi-tech investor :), but apparently this stock is a computer networking type company.
My next step is to take a look at the latest quarterly report. In fact, Thursday after the close of trading, Packeteer
announced 4th quarter 2005 results. It was this report that drove the stock higher in trading Friday. For the quarter ended December 31, 2005, net revenues came in at $31.9 million, up from $26.2 million in the fourth quarter 2004. Net income came in at $9.1 million or $.26/diluted share up strongly from the prior quarter and also up strongly from the $5.7 million or $.16/diluted share reported in the same quarter last year.
How about longer-term? Taking a look at the
Morningstar.com "5-Yr Restated" financials, we can see that revenue has been steadily growing from $41.1 million in 2000 to $92.4 million in 2004 and $107.3 million in the trailing twelve months (TTM).
Earnings, which dropped from a loss of $(.35) in 2000 to $(2.40) in 2001, turned profitable at $.12 in 2002, increased to $.42/share in 2004 and is reported at $.45/share in the TTM.
Free cash flow has been positive and increasing from $2 million in 2002 to $19 million in 2004 and $25 million in the TTM.
The balance sheet as reported by Morningstar is strong with $109.7 million in cash, adequate to cover both the $38.6 million in current liabilities and the $3.3 million in long-term liabilities combined over 2 1/2 times over. In addition, the company is reported to have $26.2 million in other current assets.
And what about some valuation numbers? Looking at
Yahoo "Key Statistics" on PKTR, we find that this is a small cap stock with a market capitalization of $415 million. The trailing p/e isn't bad at 27.0, and the forward p/e (fye 31-Dec-06) is even nicer at 23.37. Thus the PEG (5 yr expected) isn't bad either at 1.14.
Within the "Information Technology Services" industrial group, as grouped by the
Fidelity.com eResearch website, PKTR is richly priced in terms of the Price/Sales ratio, topping the group at 3.8. The other stocks include SRA International (SRX) at 1.9, Affiliated Computer Services (ACS) at 1.7, Anteon (ANT) at 1.4, Computer Sciences (CSC) at 0.7 and Electronic Data Services (EDS) at 0.7.
Going back to Yahoo for some other numbers, we find that there are only 34.16 million shares outstanding with 1.72 million shares out short as of 1/10/06, representing 2.8 trading days of volume (the short ratio) which isn't very significant imho. No cash dividends and no stock dividends are reported.
What about the chart? Taking a look at a
"Point & Figure" chart from Stockcharts.com:
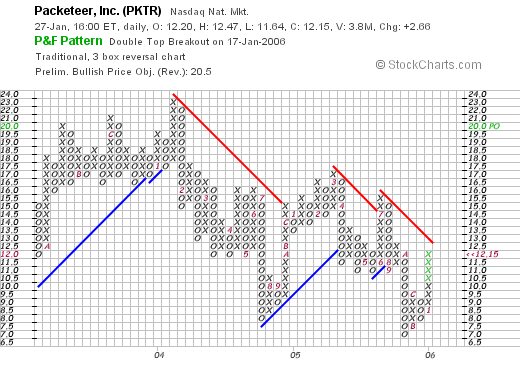
We can see what appears to be the weakest attribute of this company. As we noted earlier, the stock is actually lower than my "pick" price 2 1/2 years ago.
In fact, the stock peaked at aroune $23 in January, 2004, and has been trading lower since with "lower highs" and "lower lows". Not very encouraging actually. The stock is currently on a short-term rise in price and I would like to see this stock close strongly above $13. The stock is certainly not over-extended on the upside. In fact, unless we see some more price strength, I couldn't even say it is moving higher :).
So what do I think? Well, I liked the stock enough to buy some shares. I like the latest quarterly report, the Morningstar.com 5-Yr Restated numbers look great and the valuation isn't bad insofar as the P/E and PEG are concerned. The Price/Sales ratio shows the stock is richly valued relative to its peers. And the chart is actually mediocre. However, I am comfortable enough with the Morningstar/recent quarterly report to purchase some shares. I guess the 8% loss limit provides some comfort. I always hedge my bets!
Anyhow, that's the write-up for this stock I promised you yesterday. Thanks again for visiting! Always remember that I am an amateur investor so check with your own professional advisors. If you have any comments or questions, please feel free to leave them on the blog or email me at bobsadviceforstocks@lycos.com.
Bob
Friday, 27 January 2006
"Trading Transparency" Packeteer (PKTR)
Hello Friends! Thanks so much for stopping by and visiting my blog,
Stock Picks Bob's Advice. As I always like to point out, I am an amateur investor, so please remember to consult with your professional investment advisors prior to making any investment decisions based on information on this website.
Earlier this morning my Dynamic Materials (BOOM) stock hit a sell point and I unloaded 40 shares, 1/6th of my 240 share position, at a 30% gain. Owning only 20 different stocks, with a maximum of 25 planned, this gave me a "permission slip" so to speak, to add a new position.
A few moments ago I purchased 400 shares of Packeteer (PKTR) at $11.91. PKTR is an old favorite of mine have
posted Packeteer (PKTR) on Stock Picks Bob's Advice back on June 10, 2003.
Anyhow, that's how the nickel in my pocket was spent :). If you have any questions or comments, please feel free to leave them on the blog or email me at bobsadviceforstocks@lycos.com. I will try to update you on this stock a little later when I get a chance!
Bob
"Trading Transparency" Dynamic Materials (BOOM)
Hello Friends! Thanks so much for stopping by and visiting my blog,
Stock Picks Bob's Advice. As always, please remember that I am an amateur investor, so please remember to consult with your professional investment advisors prior to making any investment decisions based on information on this website.
The market is up nicely today and one of my stocks, Dynamic Materials (BOOM) has just hit a sale point. I purchased 240 shares of BOOM last month at a cost basis of $28.32. As you may know, my first targeted sale point is a 30% gain.
A few moments ago I sold 1/6th of my position, 40 shares, at $37.50. This represented a gain of $9.18 from my original purchase price or an appreciation of 32.4%. I now have 200 shares and shall be looking to sell all of my shares on the downside if the stock should retrace to a break-even position, or another 1/6th of my position, about 33 shares, if the stock should reach a 60% appreciation level or 1.60 x $28.32 = $45.31.
Thanks so much for stopping by! If you have any comments or questions, please feel free to leave them on the blog or email me at bobsadviceforstocks@lycos.com.
By the way, as you may also know, this sale at a gain, since I am under my 25 maximum position, entitles me to add a new position. I shall be scouring the top % gainers list for prospects and shall keep you posted. Meanwhile that nickel is already burning a hole in my pocket :).
Bob
Thursday, 26 January 2006
A New PODCAST for Stock Picks!
Hello Friends! Here is the new
***PODCAST*** on Trimble (TRMB), National Instruments (NATI), Headwaters (HW). Thanks for visiting!
Bob
"Revisiting a Stock Pick" Headwaters Inc. (HW)
Hello Friends! Thanks so much for stopping by and visiting my blog,
Stock Picks Bob's Advice. As always, please remember that I am an amateur investor and that you should consult your professional investment advisors prior to making any investment decisions based on information on this website.
We had a great day in the market today with the Dow up almost 100 points to close at 10,809.47, and the NASDAQ up 22.35 points to close at 2,283.00. It is during these strong market periods that the kind of stocks that I like to discuss tend to show up on the lists of top % gainers.

Generally, when looking for a new stock to discuss, I start with the top % gainers lists that are readily available online. In fact, looking through the
list of top % gainers on the NYSE today, I came across Headwaters (HW), a stock that I have discussed before on Stock Picks. I actually do own 200 shares of HW in another managed account that I have farmed out to a professional manager. Headwaters closed today at $35.00, up $2.20 or 6.71% on the day.
Headwaters (HW) was an early selection of mine on this blog. In fact, I
posted Headwaters (HW) on Stock Picks Bob's Advice on October 22, 2003, when the symbol was HDWR, and the stock was trading on the NASDAQ. HDWR was trading at $17.41 at that time. Since that listing, the stock has appreciated $17.59 or 101% since posting.
Let's take a closer look at Headwaters which now is on the NYSE and has the symbol HW. According to the
Yahoo "Profile" on Headwaters, the company
"...through its subsidiaries, provides products, technologies, and services to the energy and construction materials industries in the United States. It operates in three segments: Construction Materials, Coal Combustion Products, and Alternative Energy. Construction Materials segment designs, manufactures, and markets shutters, gable vents, mounting blocks and tools, and architectural manufactured stones."
One of the first screens that I employ to "sift out" a suitable stock, is to look at the latest quarterly result. I am interested in a company with both increasing revenue and earnings. Headwaters
reported 1st quarter 2006 results two days ago on 1/24/06. Revenue for the quarter rose 28% to $280.5 million from $218.4 million a year ago. Income climbed over 100% to $28.3 million or $.60/share, up from $11.1 million or $.30/share last year. These results exceeded analysts' expectations of $.55/share on revenue of $268 million.
After noting a positive quarterly report as we have just reviewed with Headwaters, I generally look to Morningstar.com to determine whether the company is demonstrating persistence of revenue growth, earnings growth, positive free cash flow, and a solid balance sheet.
Looking at the
Morningstar.com "5-Yr Restated" financials on Headwaters, we can see the steady growth in revenue from $0 in 2001 to $.1 billion in 2002, $.4 billion in 2003, $.6 billion in 2004 and $1.1 billlion in 2005. During this same time earnings have also steadily grown from $.87/share in 2001 to $2.79 in 2005. On a negative note, the company
has been diluting the shares somewhat with 23 million reported in 2001, increasing each year to 38 million shares in 2005 and 42 million in the trailing twelve months (TTM).
Free cash flow has been positive and growing the last several years. $47 million in 2003 growing to $95 million in 2005.
The balance sheet looks adequate if not terribly strong, with $13.7 million in cash, and $341.4 million in other current assets. This is plenty to cover the $237.7 million in current liabilities and enough to make a small dent on the $747.6 million in long-term liabilities.
My next step is to look for some valuation numbers and statistics on the stock. For this, I have been using Yahoo, reviewing the
"Key Statistics". Here we find that Headwaters (HW) is a mid-cap stock with a market capitalization of $1.47 billion. The trailing p/e is downright cheap at 12.56 and the forward p/e (fye 30-Sep-07) is even nicer at 11.48. Confirming the good valuation of this stock is a PEG (5 yr expected) which is reported under 1.0 at 0.53. Generally stocks that have PEG's near to or less than 1.0 are excellent values.
One thing that I picked up from my reading was an article by Paul Sturm at Smart Money Magazine who pointed out the usefulness of looking at Price/Sales ratios of companies relative to other companies in the same industrial group. Using the
Fidelity.com eResearch website, we find that HW is in the "Industrial Metals/Mineral" group. Within this group, the Price/Sales ratio of 1.4 for Headwaters is at the bottom of the bunch, suggesting again an excellent value insofar as an investment is concerned. Topping this list is Peabody Energy (BTU) with a Price/Sales ratio of 2.8, Arch Coal (ACI) at 2.3, Inco (N) at 2.3, Consolidated Energy (CNX) at 1.9, Foundation Coal (FCL) at 1.6 and Headwaters (HW) at the bottom of the group at 1.4.
Looking back at Yahoo, we find that there are 41.94 million shares outstanding with 7.99 million shares out short as of 12/12/05. This represents 19.60% of the float (!) or 15.7 trading days of volume (!!). In addition, the short shares are up from 6.58 million the prior month. With the strong earnings report, I would not be surprised to learn that we have been witnessing a short squeeze on this stock.
No cash dividends and no stock dividends are reported.
Finally, let's take a look at a chart. I have found it helpful to review the "point & figure" charts on the stocks I write up. Bear with me. You will get used to the climbing columns of x's and the descending columns of o's. Looking at the
"Point & Figure" chart on Headwaters (HW):
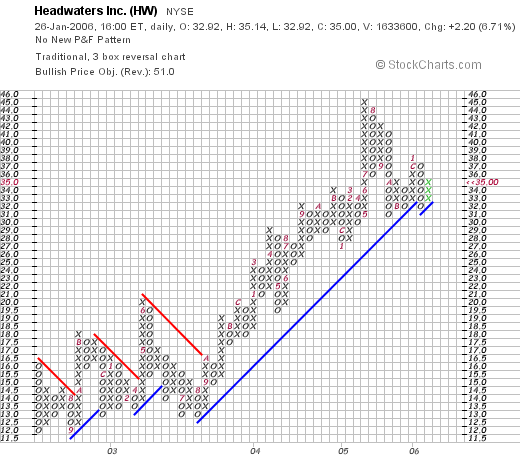
The chart looks quite strong with the stock rising from $12.00/share in September, 2002, to the current level of $35.00. The stock has been challenging the support level recently, but overall the graph looks nice.
So what do I think? Well, this is a stock I reviewed almost 2 1/2 years ago that has already doubled in price since that selection. The latest quarter was exceptionally strong and the past five years have shown steady growth. The company has been financing some of its growth with the sale of additional shares of stock. Otherwise, valuation is excellent, free cash flow is positive and growing and the balance sheet is reasonable. Valuation is downright cheap! And the chart looks nice. I still like this stock. I don't have any shares in my trading account but do own some HW in a managed account.
Thanks so much for stopping by! If you have any comments or questions, please feel free to leave them right on the blog or email me at bobsadviceforstocks@lycos.com.
Bob
"Revisiting a Stock Pick" National Instruments (NATI)
Hello Friends! Thanks so much for stopping by and visiting my blog,
Stock Picks Bob's Advice. As always, please remember that I am an amateur investor, so please remember to consult with your professional investment advisors prior to making any investment decisions based on information on this website.

As I like to do when looking for a stock to discuss on this blog, I reviewed the
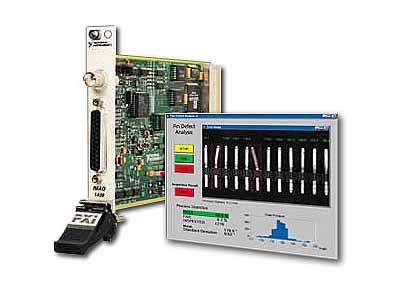
list of top % gainers on the NASDAQ and came across National Instruments Corp. (NATI) which shortly before the close of trading today, is trading at $36.81, up $4.05 or 12.36% on the day. I do not own any shares of NATI, nor do I have any options.
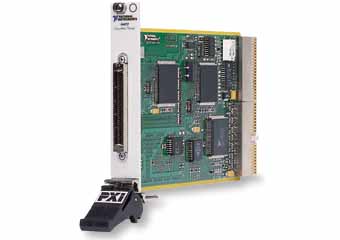
National Instruments is an old favorite of mine on this blog. I first
posted NATI on Stock Picks Bob's Advice on July 28, 2004, when it was trading at $27.89. Thus, the stock is currently trading $8.92 higher than the "pick price" or ahead by 32.0%.
And what does NATI do? According to the
Yahoo "Profile" on National Instruments, the company
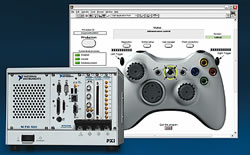
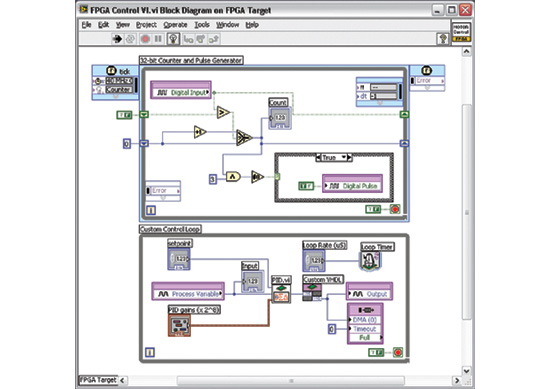
"...engages in the design, development, manufacture, and marketing of measurement and automation products. The company offers instrumentation software and computer plug-in cards, and accessories that users combine with computers, networks and the Internet to create measurement and automation systems."
And how about the latest quarter? As is the case with so many stocks that are discussed on this blog, the driving force behind the big stock gain today was a great earnings report. Yesterday, after the close of trading, National Instruments
announced 4th quarter 2005 results. Revenue for the quarter came in at $160 million, up 175 from the $137 million reported in the same quarter last year. Net income worked out to $21 million, up 27% from the $16.5 million in the same quarter last year. Diluted earnings per share climbed 30% to $.26/share up from $.20/share the prior year. The company also increased the quarterly dividend 20% this quarter to $.06/share.
How about longer-term? Taking a look at the
Morningstar.com "5-Yr Restated" financials, we can see the steady revenue growth (except for a dip from $410.1 million in 2000 to $385.3 million in 2001) to $514.1 million in 2004 and $549.2 million in the trailing twelve months (TTM).
Earnings, which also dipped from $.69/share in 2000 to $.39/share in 2002, have increased steadily since then to $.59/share in 2004 and $.70/share in the TTM.
According to Morningstar, the company paid its first dividends in 2003 with $.07 paid. This has increased to $.18 in 2004 and $.20/share in the TTM.
Free cash flow has been growing very nicely with $18 million in 2002, $45 million in 2003, $53 million in 2004 and $83 million in the trailing twelve months.
The balance sheet is very nice per Morningstar, with $180.7 million in cash, more than enough to pay off both the $84.7 million in current liabilities and the $13.3 million in long-term liabilities combined almost two times over. In addition, Morningstar reports the company with $166.7 million in other current assets.
And how about valuation? Looking at
Yahoo "Key Statistics" on National Instruments, we find that the stock is a mid cap company with a market capitalization of $2.90 billion. The trailing p/e is a bit rich at 52.21, the forward p/e (fye 31-Dec-06) is just a bit better at 39.89. The PEG ratio (5 yr expected) is also a bit steep at 1.83.
According to the
Fidelity.com eResearch website, NATI is moderately priced in terms of the Price/Sales ratio in the "System Software" industrial group.
Topping this group is Infosys (INFY) with a Price/Sales ratio of 11.0. This is followed by Autodesk (ADSK) at 7.1, National Instruments (NATI) at 4.8, Mercury Interactive (MERQ.PK) at 3.8, Manhattan Associates (MANH) at 2.6, and Take-Two Interactive (TTWO) at 0.9.
Looking back at Yahoo for some additional numbers on this stock, we can find that there are 79.14 million shares outstanding. Of these, 1.74 million shares were out short as of 12/12/05. This represents 3.10% of the float or 6.2 trading days of volume. Since I use a 3 day short ratio as a cut-off for my own evaluation, I consider 6.2 days of short-interest to be significant and may be fueling the current price appreciation on the good news in the earnings report.
And what about a chart? Taking a look at the
"Point & Figure" chart on National Instruments (NATI), we can see that the stock was trading lower between April, 2001, and October, 2002, when it bottomed at around $13.50. The stock since then, in line with the earnings improvement, has fairly steadily appreciated to the current $36.57 level.
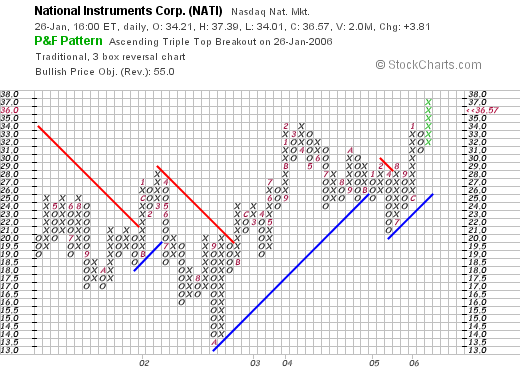
So what do I think about this stock? Well, first of all, the company had a nice move today with a large supply of short-sellers that are probably scrambling to cover their sales. The latest quarterly result was strong with both strong revenue and earnings results. Since 2002, the earnings and revenue have been growing steadily. The company even has a growing cash dividend! In addition, NATI is 'throwing off' a growing amount of free cash, and the balance sheet is quite nice as is the graph of the stock price.
On the downside valuation is rich, with both a P/E and PEG higher than I like to see them. The Price/Sales is moderate within its group of stocks.
However, the stock still fits into my own criteria and it is always nice to see a company that was doing well enough to be posted here on the blog, to show up again two years later once again moving higher in a strong fashion.
Thanks again for stopping by. If you have any comments or questions, please feel free to leave them on the blog or email me at bobsadviceforstocks@lycos.com.
Bob
Wednesday, 25 January 2006
"Revisiting a Stock Pick" Trimble Navigation (TRMB)
Hello Friends! Thanks so much for stopping by and visiting my blog,
Stock Picks Bob's Advice. As always, please remember that I am an amateur investor, so please remember to consult with your professional investment advisors prior to making any investment decisions based on information on this website.

Please excuse me for not posting for a few days. I can assure you that it was harder on me than for you :). Went down to New Orleans for a few days to help with my in-laws as they were struggling to deal with their flood-damaged home. The scope of the devastation must be seen to be believed. All of my prayers are still with those who have suffered so much in that wonderful City!
I was looking through the
list of top % gainers on the NASDAQ today, and saw that an old favorite of mine, Trimble Navigation (TRMB) had made the list. TRMB closed at $41.76, up $6.74 or 19.25% on the day. I do not own any shares of this stock nor do I own any options.
I first
posted Trimble Navigation (TRMB) on Stock Picks Bob's Advice on April 28, 2004, when it was trading at $25.98. With today's close at $41.76, that gives me a gain of $15.78 on the stock pick or 60.7% since posting. It is interesting that the factor that led to its price rise two years ago was the same as the factor that caused the stock to climb today: excellent earnings reported.
Let's take a look at this stock that continues to do well in the market.
First of all, what does the company
do? Looking at the
Yahoo "Profile" on Trimble, we find that the company
"...provides advanced positioning products, services, and solutions to commercial and government users in various markets, including surveying, construction, agriculture, urban and resource management, military, transportation, and telecommunications. The company’s positioning portfolio includes global positioning system (GPS), laser, optical, and inertial technologies. Its products include earthmoving equipment guidance systems, surveying instruments, fleet management systems, components for in vehicle navigation and telematics systems, farm equipment guidance systems, field data collection handhelds, and timing modules used in the synchronization of wireless networks."
What drove the stock higher, as I discussed above, was the release of
4th quarter and fiscal 2005 earnings results yesterday after the close of trading. For the quarter ended December 30, 2005, revenue came in at $186.8 million up 15% from revenue of $162.7 million in the same quarter last year. Net income worked out to $23.4 million, or $.41/share, up 43% compared with net income of $16.4 million or $.29/share last year.

How about longer-term? Taking a look at the
Morningstar.com "5-Yr Restated" financials, we can see the beautiful progression of earnings from $369.8 million in 2000 to $668.8 million in 2004 and $750.8 million in the trailing twelve months (TTM).
Earnings, as is often the case, have not been quite as steady with a dip from $.37/share in 2000 to a loss of $(.62)/share in 2001. However, since that time earnings have steadily increased to $1.23 in 2004 and $1.37 in the TTM.
Free cash flow the past few years has been strongly positive and growing. $25 million was reported in 2002, increasing to $60 million in 2004 and $72 million in the TTM.
The balance sheet looks solid with $87.3 million in cash and $273.7 million in other current assets. This is plenty to cover both the $128 million in current liabilities and the $27.8 million in long-term liabilities combined more than two times over.

And valuation? Looking at
Yahoo "Key Statistics" on TRMB, we find that the company is a mid cap stock with a market capitalization of $2.25 Billion. The trailing p/e isn't too bad at 30.42 and the forward (fye 31-Dec-06) p/e is even better at 25.31. With the steady growth predicted, the PEG comes in at a reasonable 1.35.
Using the
Fidelity.com eResearch website, we find that TRMB is also reasonably priced in terms of the Price/Sales ratio relative to other stocks in the "Scientific/Technical Instruments" Industrial Group. Leading this group for the Price/Sales ratio is Garmin (GRMN) with a Price/Sales ratio of 7.5. This is followed by Flir (FLIR) at 3.8, Agilent (A) at 3.3, Trimble (TRMB) at 2.7, Fisher Scientific (FSH) at 1.6, and Beckman Coulter (BEC) at 1.5.
Returning to Yahoo for some more numbers, we find that there are 53.79 million shares outstanding with 1.39 million of them out short as of 12/12/05, representing 2.60% of the float or 4.6 trading days of volume. Personally, I have chosen to use 3 days of volume out short as significant, and today's sharp rise might just represent a bit of a panic or squeeze among those betting the stock should be declining.
No cash dividends are paid, and the last stock split was a 3:2 split on 3/5/04, just a few weeks before I posted this particular stock on Stock Picks Bob's Advice.
And how does the chart look? Taking a look at the
"Point & Figure" chart on Trimble from Stockcharts.com:
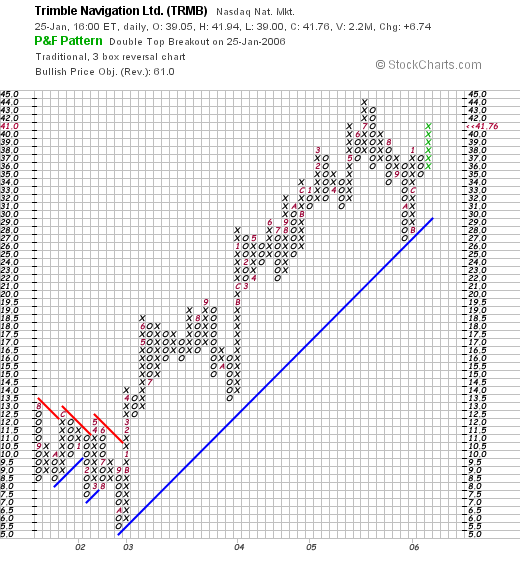
We can see that the stock was trading a little weakly between August, 2001, and October, 2002, when the stock bottomed at $5.00/share. Since then, the company has had a beautiful chart with a steady climb to the current $41.79 level, without looking "over-extended" in stock price to my amateur eyes.
So what do I think? First of all, it is nice to be back blogging after a hiatus of a few days. Now, insofar as this stock is concerned, the stock meets my criteria with a nice price rise today, a great quarterly report just released with growth in both revenue and earnings, and a very nice Morningstar.com financial statement with steady revenue growth the past five years, steady earnings growth the last several years, positive and growing free cash flow, and a gorgeous chart. Valuation is a little rich, but in light of the stock's performance, buying this stock at a discount now is just out of the question!
If you have any comments or questions, please feel free to email me at bobsadviceforstocks@lycos.com or leave them right here on the blog!
Bob
Newer | Latest | Older


 On November 10, 2004, I
  On October 27, 2005, ASVI
  On November 14, 2004, I
  On November 29, 2005, GameStop
 Ventana was an early pick of mine on this blog. I
  I currently own 225 shares of Ventana (VMSI) which were acquired 4/16/04 at a cost basis of $23.47/share. With yesterday's (1/27/06) closing price of $41.42, these shares currently have an unrealized gain of $17.95 or 76.5% since my purchase of these shares.
 On October 21, 2005, VMSI
  Reviewing
 As I promised, I want to write a few words about Packeteer, a stock that I purchased shares in yesterday. If you are familiar with my trading strategy, you will know that I own a maximum number of positions in my trading portfolio, which I have set at 25. My approach has been to have my own portfolio holdings determine whether I should be moving into or out of equities. I do this by adding a new position when I sell a portion of one of my existing positions at a gain (what I call "good news"); I move back into cash when I sell one of my positions at a loss or a retracement of a gain (what I call "bad news"). Yesterday, my Dynamic Materials stock (BOOM) hit my first appreciation target for a sale (30%). I sold 1/6th of my holding of BOOM and set out to find a new position.
 With that "permission slip" or as I like to say, that "nickel burning a hole in my pocket", I set out to identify a candidate for purchase. Looking through the
  First, let's review what this company actually does. For that, I like to refer to the
  How about longer-term? Taking a look at the
 Generally, when looking for a new stock to discuss, I start with the top % gainers lists that are readily available online. In fact, looking through the
 As I like to do when looking for a stock to discuss on this blog, I reviewed the
  National Instruments is an old favorite of mine on this blog. I first
  How about longer-term? Taking a look at the
  The balance sheet is very nice per Morningstar, with $180.7 million in cash, more than enough to pay off both the $84.7 million in current liabilities and the $13.3 million in long-term liabilities combined almost two times over. In addition, Morningstar reports the company with $166.7 million in other current assets.

 Please excuse me for not posting for a few days. I can assure you that it was harder on me than for you :). Went down to New Orleans for a few days to help with my in-laws as they were struggling to deal with their flood-damaged home. The scope of the devastation must be seen to be believed. All of my prayers are still with those who have suffered so much in that wonderful City!
 I was looking through the
  How about longer-term? Taking a look at the
  And valuation? Looking at