Stock Picks Bob's Advice
Sunday, 27 November 2005
"How I Use Morningstar.com" Another Podcast
Hello Friends! Thanks so much for stopping by and visiting my blog,
Stock Picks Bob's Advice. As always, please remember that I am an amateur investor so please remember to consult with your professional investment advisors prior to making any investment decisions.
I am on a roll tonight :). Am still working on my podcast skills and posted another discussion,
CLICK HERE FOR PODCAST: HOW I USE MORNINGSTAR TO EVALUATE STOCKS. Thanks again for visiting. If you have any questions or comments, please feel free to email me at bobsadviceforstocks@lycos.com.
Bob
***NEW for Stock Picks*** A Podcast :)
Hello Friends! Thanks so much for stopping by and visiting my blog,
Stock Picks Bob's Advice. As always please remember that I am an amateur investor, so please remember to consult with your professional investment advisors prior to making any investment decisions based on information on this website.
I am experimenting with Podcasting and you are welcome to listen in to an
Introduction to Stock Picks on my first Podcast. I look forward to your questions, comments, and encouragement. I think the podcast concept is going to be big.
There is a lot of polishing up I need to do, but I wanted to get going with this ASAP.
My website associated with the podcasts is located
here. Please do come and visit!
Bob
"Weekend Review" A review of stock picks from the week of September 20, 2004

Hello Friends! Thanks so much for stopping by and visiting my blog,
Stock Picks Bob's Advice. As always, please remember that I am an amateur investor, so please remember to consult with your professional investment advisors prior to making any investment decisisions based on information on this website.
As regular readers of this blog know, the weekend is a time for me to review past ideas and past picks. To see how they would have done, if I had purchased these stocks. This analysis assumes a buy and hold approach when in fact, what I practice here is disciplined selling. That is, I sell my losing stocks quickly if they drop 8% after an initial purchase, and sell my gaining stocks slowly (selling 1/6 of existing holdings---revised down from 1/4) at pre-determined intervals. This strategy would certainly affect, and likely improve, performance. But for the sake of this review, let's see how the stocks from that week a little over a year ago turned out.

On September 23, 2004, I
posted Carter's on Stock Picks Bob's Advice when it was trading at $26.30. Carter's has had a nice price move, closing at $59.98 on November 25, 2005, a gain of $33.68 or 128% since posting.

On October 25, 2005, Carter's (CRI)
announced 3rd quarter 2005 results. For the quarter ended October 1, 2005, and including the acquisition of Oshkosh B'Gosh on July 14, 2005, net sales jumped 48.1% to $372.2 million. Excluding the Oshkosh acquisition, retail stores climbed 1.7% while comparable store sales actually dropped .9%. Thus the acquisition clouds the underlying anemic results from the Carter's retail assets.
Net income dropped 42.5% to $10.6 million or $.35/diluted share. However excluding acquisition charges, net income actually increased 68.6% to $31.1 million or $1.02/diluted share. On this blog however, I don't like excluding anything if possible and just look at the bottom line, as best I can see the results.
Thus, with the drop in same-store sales, and the decrease in income, CRI gets a thumbs-down, despite the fact that the stock itself has been a
spectacular performer here!

On September 24, 2004, I
posted Digital Theater Systems (DTSI) on Stock Picks Bob's Advice when it was trading at $18.68. DTSI closed at $14.50 on November 25, 2005, for a loss of $(4.18) or (28.8%) since listing.
On November 7, 2005, DTSI
reported 3rd quarter 2005 results. For the quarter ended September 30, 2005, revenue came in at $17.6 million, up from $16.0 million in the same period last year. Net income, however, was $1.2 million or $.07/diluted share, down sharply from last year's $3.2 million or $.18/diluted share.
So how did we do during that week a year ago? Actually quite well thanks to Carter's. The two stocks had performances of a gain of 128% for CRI, and a loss of (28.8)% for Digital Theater Systems. The average performance was a gain of 49.6%.
Thanks so much for stopping by! I hope the the upcoming week will find you in good health and be good for your financial health as well! If you have any comments or questions, please feel free to email me at bobsadviceforstocks@lycos.com, or simply leave your comments/questions right in the blog where I shall try to respond.
Bob
©2005 Robert Freedland
Listen HERE for my new podcast on this entry.
Posted by bobsadviceforstocks at 9:54 AM CST
|
Post Comment |
Permalink
Updated: Sunday, 27 November 2005 6:56 PM CST
Saturday, 26 November 2005
"Final Note (for Now) on Selling!"
Hello Friends! Thanks so much for stopping by and visiting my blog
Stock Picks Bob's Advice. As always, please remember that I am an amateur investor, so please remember to consult with your professional investment advisors prior to making any investment decisions based on information on this website.
I have been making a few comments about my selling strategy. Big changes will be hard to implement and after all, I like to have these targeted sales at these levels as this makes my portfolio more responsive as an indicator of market action.
So what to do? Let's start with a small change. Instead of selling 1/4 of my shares at the previous 30, 60, 90, 120% intervals; I shall instead try selling only 1/6 of the remaining position. Let's see how this works in the long run. Thus, I shall be able to implement this right away without changing intervals which have already passed.
For instance, if we go to the 1,000 shares at $10 situation, after the stock appreciates 30% ($13/share), I shall sell 1/6 of the shares or 166 shares leaving 834 @13 = $10,842. Next sale (60% gain) sell 1/6 of 834 = 139 shares leaving 834-139= 695 @ $16= $11,120, third sale sell (90% gain) 1/6 of 695 = 115 shares or 695-115=580 x $19 = $11,020; fourth sale (120% gain) sell 1/6 of 580 = 96 shares, or 580-96=484 @ $22 = $10,648. And the fifth sale (180% gain) means selling 1/6 of 484 shares = 80 shares, 484-80=404 x $28 = $11,312...
This will be easier to implement. Instead of selling 1/4 of my remaining shares at the same intervals I shall be selling a smaller
1/6 of my remaining shares. PHEW.
Let's see how this works.
Thanks for bearing with me! Drop me a line at bobsadviceforstocks@lycos.com if you have any comments or better suggestions! Regards.
Bob
Posted by bobsadviceforstocks at 5:30 PM CST
|
Post Comment |
Permalink
Updated: Saturday, 26 November 2005 5:32 PM CST
"Weekend Trading Portfolio Analysis" Progress Software (PRGS)

Hello Friends! Thank you so much for stopping by and visiting my blog,
Stock Picks Bob's Advice. As always, please remember to consult with your professional investment advisors prior to making any investment decisions based on information on this website.
As I have related many times before, there are many different things that I like to present on this website. One thing is just philosophy; that is, what to look for in a stock, when to sell, how to respond to market activities, etc. Another thing I like to do is to discuss individual stocks that may fit into this philosophy of investing. And finally, I like to discuss some of the actual stocks that I own, what I have done with them, and how the company is currently doing. This entry is about a stock that I actually currently own! (I am skipping my Morningstar stock (MORN) which I just purchased and reviewed the past week. Next alphabetically is Progress (PRGS)).

I purchased 240 shares of Progress Software (PRGS) in my own actual trading portfolio on June 16, 2005. At that time, I purchased 240 shares for $31.00. PRGS closed at $30.58 on 11/25/05, for a loss of $(.42) or (1.4)%. I have not sold any shares of this stock since the purchase.
I also
wrote up Progress on Stock Picks Bob's Advice on June 16, 2005, when the stock was trading at $30.33, just $(.25) below the closing price on 11/25/05. This stock has really gone nowhere since purchasing as well as since writing up the review here on the blog.
Let's take another look at this company!
According to the
Yahoo "Profile" on Progress Software, the company:
"...engages in the development, marketing, and distribution of software and services for the development, deployment, integration, and management of business applications deployed in a distributed, Web-based or client/server environment. Its products include development tools, databases, application servers, messaging servers, application management tools, data connectivity products, and integration products for distributed and Web-based applications, as well as for client/server applications."
On September 20, 2005, Progress
reported 3rd quarter 2005 results. Revenue came in at $99.5 million, up 11% from $89.3 million the prior year. Net income rose to $13.4 million, or $.31/share, up from $8.5 million or $.22/share the prior year. For the year, the company estimated earnings of $1.28/share on $402.9 million in revenue. Last year, the company had earnings of $.99/share on $363 million in revenue.
What about "longer-term"? Looking at the
"5-Yr Restated" financials on Morningstar.com, we can see the steady growth in revenue (after a dip from $273 million in 2000 to $264 million in 2001) to the current $394 million in the trailing twelve months (TTM).
Earnings, also after dipping between 2000 when they were $.85/share, down to $.46/share in 2001, have risen steadily to the $1.13/share in the TTM.
Free cash flow has improved the last few years from $38 million in 2002 to $70 million in the TTM.
The balance sheet is solid with the cash alone at $252.8 million plenty to pay off both the $170.5 million in current liabilities and the $11.3 million in long-term liabilities. In addition, the company has $86.6 million in 'other current assets.'
What about the chart? Taking a look at a
"Point & Figure" chart on Progress from Stockcharts.com:

It appears that the upward movement in the stock appears intact. After dropping to a low of $11.50, in October, 2002, the stock has moved higher, staying above its resistance line, and while over the short-term has pulled back from its highs, the overall bullish character of the chart appears to be continuing.
So what do I think? Well, the stock had a reasonable quarterly report, the Morningstar.com numbers appear solid, and the chart looks fine. Looks like a hold for me at least until we get some news to indicate it is time to get out. Or if the stock moves down to an 8% loss, I shall be selling my shares.
Thanks again for visiting. Please feel free to leave your comments right on the blog or email me at bobsadviceforstocks@lycos.com if you have any comments or questions for me. I cannot answer every email I receive, but I try to respond to as many as possible, usually right on the blog!
Bob
Posted by bobsadviceforstocks at 11:41 AM CST
|
Post Comment |
Permalink
Updated: Saturday, 26 November 2005 5:04 PM CST
Friday, 25 November 2005
"Revisiting a Stock Pick" Total System Services (TSS)
Hello Friends! Thanks so much for stopping by and visiting my blog,
Stock Picks Bob's Advice. As always, please remember that I am an amateur investor, so please remember to consult with your professional investment advisors prior to making any investment decisions based on information on this website.

Looking through the
list of top % gainers on the NYSE today, I came across Total System Services (TSS) which closed at $22.04 up $.84 or 3.96% on the day. I do not own any shares nor do I own any options on TSS.
The stock moved higher today after an
upgrade by Fulcrum.
I first
posted Total System Services (TSS) on Stock Picks Bob's Advice on March 8, 2004, when it was trading at $22.30. The stock has actually gone absolutely nowhere since posting on the blog, and is trading down $(.26) or (1.2)% lower than posting.
According to the
Yahoo "Profile" on TSS, the company
provides electronic payment processing and related services to financial and nonfinancial institutions in the United States, Canada, Mexico, Honduras, Puerto Rico, and Europe. Its services include processing retail, commercial, government services, stored value, and debit cards, as well as student loans. TSYS also offers merchant services in Japan; other products and services, including risk management tools and techniques, such as credit evaluation, fraud detection and prevention, and behavior analysis tools; and revenue development tools and customer retention programs, such as loyalty programs and bonus rewards.
On October 18, 2005, Total Systems
reported 3rd quarter 2005 results. For the quarter ended September 30, 2005, revenue climbed 38% to $422 million, and net income rose to $48.1 million from $39.1 million or $.24/share, up from $.20/share last year during the same period.
Looking longer term at the
Morningstar.com "5-Yr Restated" financials on TSS, we can see the steady revenue growth from $.8 billion in 2000 to $1.5 billion in the trailing twelve months (TTM). The graph suggests a recent
acceleration of revenue growth. During this period, earnings have steadily improved from $.45/share in 2000 to $.94/share in the TTM. Free cash flow has also improved from $183 million in 2002 to $239 million in the TTM.
The balance sheet, as reported on Morningstar, looks solid with $199.4 million in cash and $306.9 million in other current assets, plenty to cover both the $235.7 million in current liabilities
and the $166.3 million in long-term liabilities combined.
What about valuation? According to
Yahoo "Key Statistics" on TSS, the market cap is $4.35 billion, making this a large cap stock, the trailing p/e is a reasonable 23.15, with a forward p/e (fye 31-Dec-06) of 19.86. The PEG is a bit steep at 1.44.
Looking at the
Fidelity.com eResearch on TSS, the company is in the "Business Software & Services" industrial group. Within this group, the Price/Sales ratio is reasonable at 2.8. Topping this group is Business Objects (BOBJ) at 3.4, BEA Systems (BEAS) at 3.3, Automatic Data Processing (ADP) at 3.1, and First Data (FDC) at 3.1. Following these is Total System Services (TSS) at 2.8 and Fiserv, as the "cheapest" in the group with a Price/Sales ratio of only 2.3.
Going back to Yahoo for some additional statistics, we find that the company has 197.27 million shares outstanding. Of these, 922,130 shares are out short (as of 10/11/05) representing 7.7 trading days of volume. Using my arbitrary 3 day rule, this looks significant to me.
The company also pays a small dividend of $.24/share yielding 1.10%. The last stock split was a 3:2 split in May, 1998.
What about the chart? Looking at a
Stockcharts.com "Point & Figure" chart on TSS:
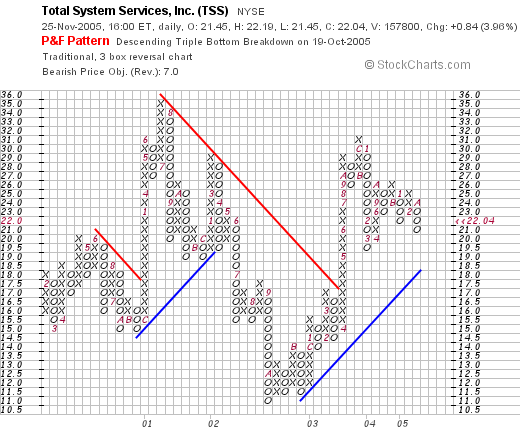
You can see that this stock has gone almost nowhere (!) in the past five years. The stock peaked at $35 in July, 2001, bottomed at $11 in October, 2002, then broke through resistance at $17 in April, 2003. The stock has traded higher above support since then, but has not even reached its 2001 highs. The chart is recently optimistic, but certainly not overvalued.
So what do I think? The latest quarter was great, the Morningstar five year record looks nice, valuation is reasonable, the balance sheet is just fine, and the company even pays a small dividend. On a negative note, the chart looks rather unimpressive. Certainly, this stock hasn't gotten away from anyone since I posted this here in 2004!
Thanks so much for stopping by! If you have any questions or comments, please feel free to email me at bobsadviceforstocks@lycos.com or just leave your comments right here on the blog.
Bob
Thursday, 24 November 2005
"Another Selling Strategy"
Hello Friends! Thanks so much for stopping by and visiting my blog,
Stock Picks Bob's Advice. As always, please remember that I am an amateur investor, so please remember to consult with your professional investment advisors prior to making any decisions based on information on this website.
A couple of entries ago I discussed a selling strategy that would always leave 10% growth in the remaining shares. This is a bit conservative for me, and will reduce the possible sales. Let's try another approach with only a 1% growth in remaining shares.
Using the same example of 1000 shares of a $10.00 stock, at what appreciation level would be able to sell 1/4 of the shares and have a 1% gain in the original purchase, that is have the remaining shares to equal 1.01 x $10,000 = $10,100? Since we are selling 1/4 of the shares, we would have 1,000 x .75 = 750 shares. And the price at the sale would need to be $10,100/750=$13.47. Thus, the first sale would be at a
35% appreciation point!
And the second sale? Again, the value would be $10,100 x 1.01 = $10,201. And the remaining shares? Well, that would be 750 x .75 = 563 shares. Or the price/share would be $10,201/563 = $18.12. Thus, the second sale would be at an
81% level.
You can see that this is a little closer to my original strategy and a little more do-able.
The third sale? $10,201 x 1.01 = $10,303. And the number of shares remaining = 563 x .75 = 422 shares. And the price? $10,303/422 = $24.41. Or a
144% appreciation level.
We can calculate the rest of the sales as we go!
Bob
Wednesday, 23 November 2005
November 23, 2005 Drew Industries (DW)
Hello Friends! Thanks so much for stopping by and visiting my blog,
Stock Picks Bob's Advice. As always, please remember that I am an amateur investor so please remember to consult with your professional investment advisors prior to making any investment decisions based on information on this website.

I spend a lot of time talking about different stocks that I come across in my market observations. You might ask what I am doing with all of these stocks? And why did I pick them? I hope these answers are apparent from my blog.
I am on the search for stocks that have certain characteristics that I believe will portend further price appreciation. What are these factors? Mainly good current price momentum, persistence in earnings and revenue growth, free cash flow positive and a decent balance sheet. A nice chart, reasonable valuation, and a large short interest is "gravy" as far as I am concerned. But they are nice to see in addition to everything else.
Of these stocks, I make actual purchases and try to keep you, the reader, informed of my trading activity. You are my witnesses to my trades, keeping me in line and following my own rules :). I hope all of this is helpful to you and that you take the opportunity to share with me your comments and questions!

My first stop in finding a potential stock candidate is the top percentage gainers list. You might ask why I start there. Well, I am looking for a stock that is timely. What better place to find a strong stock then a list of stocks showing large upward price moves
today? To put it simply, the stocks on the top % gainers list are there often because of some event that will reflect favorably in the price. This might be a positive analyst upgrade, or an earnings report that exceeds expectation or the like. The 'event' results in an imbalance of purchase orders over sale orders and thus the large % gain for the day!
Drew Industries (DW) made the
list of top % gainers on the NYSE today closing at $29.71, up $1.31 or 4.61% on the day. I do not own any shares nor do I have any options on this company.
According to the
Yahoo "Profile" on Drew Industries, the company
"...through its wholly owned subsidiaries, supplies components for recreational vehicles (RV) and manufactured homes in the United States and Canada. It operates through two segments, recreational vehicle and leisure products segment (RV segment) and manufactured housing products segment (MH segment)."

My next step in screening for a "stock pick" is to check the latest quarterly results. This is something I learned from the
CANSLIM technique of William O'Neil. On November 2, 2005, Drew Industries
reported 3rd quarter 2005 results. Sales for the quarter ended September 30, 2005, grew 15% to $171 million compared with sales of $149 million for the same quarter last year. Net income came in at $9.8 million or $.45/diluted share, up 30% from $7.5 million, or $.35/diluted share last year same quarter.
In many ways, Drew is a beneficiary of hurricane Katrina. As reported in the article:
"We shipped between $6 million and $8 million of FEMA-related orders in the last 15 days of the third quarter, and anticipate we will sell more than an additional $20 million of these products in the fourth quarter. Many of the units purchased by FEMA are not as fully equipped as a traditional travel trailer or manufactured home, and therefore our content per unit will be less than normal.
What about longer-term results? As I noted above, I am interested in persistence of earnings and revenue growth, not one-time events! Looking at
Morningstar.com "5-Yr Restated" financials on Drew, we can see that revenue, which dipped from $287.8 million in 2000 to $254.8 million in 2001, has sharply and steadily rebounded to the current $620.7 million in the trailing twelve months (TTM).
Additional Morningstar data shows that earnings, while dipping from $.46/share in 2001 to a loss of $(.73)/share in 2002, have otherwise improved from $.08/share in 2000 to $1.30/share in the TTM.
Free cash flow has also been erratic, but has improved from $2 million in 2002 to $23 million in the TTM. Balance sheet-wise, the stock also looks solid with $1.9 million in cash and $140.4 million in other current assets, more than enough to cover both the $87.6 million in current liabilities and the $52.5 million in long-term liabilities reported.
Looking at Yahoo for some
"Key Statistics" on DW, we can see that this is a small mid-cap stock with a market capitalization of only $627.56 million. Valuation looks reasonable with a trailing p/e of 22.94 and a forward p/e (fye 31-Dec-06) of 15.55. Thus the PEG is reasonable (near 1.0) at 1.04.
I like to review the Price/Sales ratio in the context of companies in the same industrial group. This was something I picked up from reading
Paul Sturm on Smart Money discussing the fact that valuation is a relative number. That this ratio must be considered relative to other companies doing the same kind of business; companies in the same "industrial group".
The
Fidelity.com eresearch website has a nice comparison for Drew (DW) which is in the "General Building Materials" industrial group. Top sin valuation in terms of Price/Sales is Danaher (DHR) with a Price/Sales ratio of 2.4. This is followed by Valspar (VAL) at 1.9, then Drew (DW) at 1.0, Sherwin-Williams (SHW) at 0.9, American Standard (ASD) at 0.8 and York (YRK) at 0.5. Clearly Drew is reasonably priced by this ratio in the context of other similar companies.
Going back to Yahoo for some additional numbers on this company, we see that there are 21.12 million shares outstanding. Of these 1.43 million float, with a short ratio as of 10/11/05 of 12.1 trading days.
That is quite a lot of shares out short and may well be contributing to a "squeeze" of short-sellers as they scramble to cover their previously sold shares that they borrowed first and sold with the promise of buying them back later.
Yahoo does not report any cash dividend. The last stock split was just a couple of months ago when the stock split 2:1 on 9/8/05.
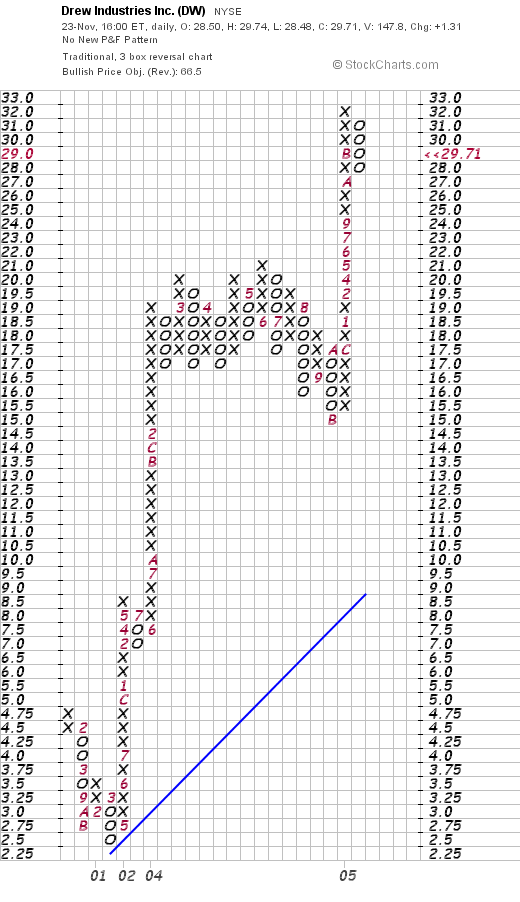
What about a chart? Taking a look at a
"Point & Figure" chart from Stockcharts.com on Drew, we can see that the stock dropped in 2000 (perhaps corresponding to the revenue and earnings drop in that period of time) from $4.75/share to a low of $2.50/share in March, 2001.
The stock subsequently bounced off support at that level and moved sharply higher; steadily for the past four years to the current level near $30. Although a bit volatile, this looks like a strong chart to me.
So what do I think? Well, the stock looks very attractive to me. The latest quarterly report was strong and the company is very timely with the Katrina expenditures on mobile and manufactured housing continuing. The Morningstar report looks solid for the past few years with earnings and revenue growth, free cash flow expansion, and a solid balance sheet. Furthermore, valuation is reasonable with a PEG approximately 1.0 and a Price/Sales ratio midway in its group. To top it off the chart looks strong and there are loads of short-sellers who shall need to "cover".
Now, if only I had a signal to buy some shares. And I have just made it more difficult to sell on good news :(. Oh well.
Thanks so much for stopping by. I hope that my explanation tonight was clear and helpful. If you have any comments or questions, please feel free to email me at bobsadviceforstocks@lycos.com or simply leave your notes right on the blog!
I hope you all have a very Happy Thanksgiving!

Thanksgiving Day by Frank Wright
Bob
Posted by bobsadviceforstocks at 8:13 PM CST
|
Post Comment |
Permalink
Updated: Wednesday, 23 November 2005 9:20 PM CST
"Some more thoughts on Selling!"
Let's continue the previous discussion.
When is the 4th sale, the 5th sale, and is there a pattern here?
After the last sale, we had a value of $13,310 at $31.62, and 421 shares. If we sell 1/4 of the share again, this would be 421 x .75 = 315 shares. The value needs to grow 10% or $13,310 x 1.1 = $14,641. The stock price would be $14,641/315 = $46.48. Or we could say a 365% incrrease in price.
In summary the first four sales of 1/4 position, need to be at: 47%, 115%, 216%, and 365%.
Let's figure on the fifth sale. Value increasing 10% means 1.1 x $14,641 = $16,105.10. Number of shares = 315 x .75 = 236 shares. Share price = $16,105.10/236= $68.24. Or a 582% increase before the fifth sale.
Thus, the first five sales will be, in the future at 47%, 115%, 216%, 365%, and 582% increases in stock price. We can calculate the rest another time if it is indicated. This will allow for a slower proces of pealing off stock shares at appreciation points, and allow for the individual positions to grow!
Again, thanks for dropping by! Remember that I am an amateur investor and that you should be consulting your professional investment advisors prior to making any investment decisions based on information on this website! If you have any questions or comments, please feel free to email me at bobsadviceforstocks@lycos.com.
Bob
"New Sale Points for Stocks to be Established"
Hello Friends! Thanks so much for stopping by and visiting my blog,
Stock Picks Bob's Advice. As always, please remember to consult with your professional investment advisors prior to making any investment decisions based on information on this website, as I am an amateur investor.
Watching my positions as they have been hitting my "sale points" I realized that the size of these holdings are shrinking :). In other words, I am selling too aggressively at the wrong trigger points.
What I would like to do with my portfolio is to basically sell my winnings, allowing my positions to slowly
grow and not
shrink over time!
I am sure that there are good mathematical models to allow me to do this, but using my manual approach suits me well. Let us assume that after each sale of a partial position, we would like to have the value of the remaining shares be 10% higher than either the original value or the value after the prior partial sale. Are you following? In addition, let's assume that I continue selling 1/4 positions. What needs to be adjusted are the percentage "trigger points" that call for the sale of the quarter of the holding.
For example, let's look at a hypothetical investment of 1,000 shares of stock with initial price of $10.00. The question thus is at what price the stock should reach before we could sell 1/4 of the position and still have a 10% greater value in the remaining shares. That is, we will sell 250 shares (1/4 of the position), so at what price would the remaining shares be worth $11,000, which would be a 10% increase in value.
With a little math we can see that we would have (750)(x) = $11,000, or $11,000/750 = $14.67. Thus, we should wait until a 47% increase in the stock price prior to selling 1/4 of a position for the first sale.
How about the second sale? This time, if we want to continue the 10% increase in position size, this would require a $11,000 x 1.1 = $12,100. Selling 1/4 of 750 shares would mean 750 x .75 = 562. Thus, (562)(x) = $12,100, or x= $21.53, or a 115.3% appreciation prior to a second sale.
As you can see, these appreciation levels are
much higher than my currently applied sales points!
And the next sales point? Again, going for a 10% increase in the position size, we would need to wait for $12,100 x 1.1 = $13,310. And selling 1/4 of shares would mean that we would have 562 x .75 = 421 shares. The stock price would need to reach (421)(x) = $13,310 or $13,310/421 = $31.62 or a 216% increase for the third sale.
I think this makes more sense, and I can calculate the other sale points as I go along. I shall still sit with the 8% loss, and retracing 50% of the highest gain, but I am going to try to back off the number of sales which I believe are being made prematurely, resulting in shrinkage of positions.
Thanks again for stopping by! If you have any questions or comments, please feel free to email me at bobsadviceforstocks@lycos.com or just leave them right on the blog!
Bob
Posted by bobsadviceforstocks at 2:57 PM CST
|
Post Comment |
Permalink
Updated: Wednesday, 23 November 2005 3:17 PM CST
Newer | Latest | Older


