Stock Picks Bob's Advice
Saturday, 29 March 2008
"Looking Back One Year" A review of stock picks from the week of September 11, 2006

Hello Friends! Thanks so much for stopping by and visiting my blog, Stock Picks Bob's Advice! As always, please remember that I am an amateur investor, so please remember to consult with your professional investment advisers prior to making any investment decisions based on information on this website.
It has been a quiet week around these parts. I haven't found many stocks to write up and it is once again the weekend and time for a review! Last week I took a look at the week of September 4, 2006. Going a week ahead, let's review the picks from the week of September 11, 2006, which was a bit busier in regards to posting than some other weeks.
Needless to remind you, these reviews assume a "buy and hold" strategy of investing in which equal dollar amounts are purchased in each of these picks from the week and held without regard to price movement. In fact, I advocate and employ a disciplined investment strategy that requires me (except when I have rashly tried to do a 'trade'), to buy stocks only when I have a market signal o buy stocks, to sell stocks on declines, and to lock in appreciating stocks by partial sales at appreciation targets. Thus, the difference between this approach and a 'buy and hold' strategy would certainly be different....not necessarily better!
But, as I have commented elsewhere, it is easier to evaluate my picks assuming a simple purchase and hold than to evaluate it otherwise. Please do take that into consideration.
I should also like to be brief this afternoon/evening as I have a 'lot of things on my plate' this weekend but did want to get around to writing up a bit on the stocks I covered last year.
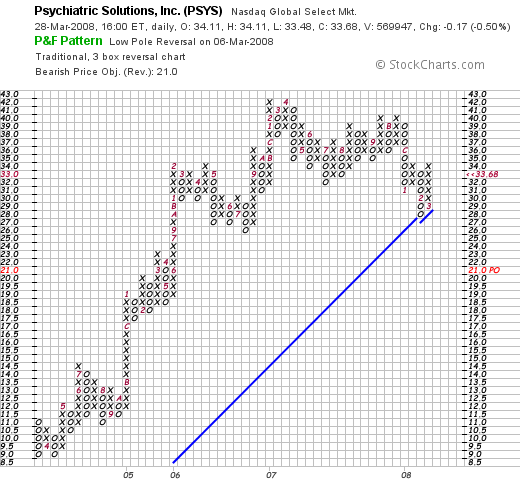
 On September 12, 2006, I posted Psychiatric Solutions (PSYS) on Stock Picks Bob's Advice when the stock was trading at $35.78. PSYS closed at $33.68 on March 28, 2008, for a loss of $(2.10) or (5.9)% since posting. I do not own any shares or options of Psychiatric Solutions.
PSYCHIATRIC SOLUTIONS (PSYS) IS RATED A BUY
On February 20, 2008, PSYS reported 4th quarter 2007 results. Revenue for the quarter increased 44.1% to $403.4 million, from $279.9 million the prior year same period. Net income increased to $23.2 million or $.42/diluted share, up from $17.6 million or $.32/diluted share the prior year. The company raised guidance for the 2008 fiscal year by $.10/share to $1.93 to $1.97/share reflecting the benefit of lower interest rates.
Analysts polled by Thomson Financial had been expecting 2008 results of $1.88/share. However, first quarter 2008 guidance of $.42 to $.43/share was below expectations of $.44/share. The announcement was 'mixed' because the company was reducing guidance over the short-term, but raising guidance for the full year. Within the same announcement, they optimistically estimated same-store sales figures (which for them means same-facility revenue numbers) to grow at a 7-8% rate in 2008 compared to the strong 6.5% increase reported in 2007.
Reviewing the Morningstar.com "5-Yr Restated" financials, we can see that the revenue growth is intact, earnings growth has not been interrupted, total shares while being slightly more than doubled between 2003 and 2007, have increased while revenue is up six-fold, and earnings are up six-fold as well.
Free cash flow is positive and the balance sheet appears adequate with $340 million in total current assets compared to $182.2 million in current liabilities. The company does carry a significant $1.2 billion in long-term liabilities which apparently is being managed adequately but should be noted.
Finally, looking at a 'point & figure' chart on PSYS from StockCharts.com, we can see that while under a bit of selling pressure recently (what stock isn't?), the chart actually appears to be holding up under the recent preessure and hasn't broken down from its long-term bullish move from early 2004 when the stock was selling at as low as $9/share to the high of $42 in April, 2007.
 Next that week, on September 13, 2006, I 'picked' Global Payments (GPN) for Stock Picks at a price of $41.25. GPN closed at $40.81 on March 28, 2008, for a loss of $(.44) or (1.1)% since posting. I do not own any shares or options of Global Payments.
Just the other day, on March 27, 2008, Global Payments (GPN) announced 3rd quarter 2008 results. For the quarter ended February 29, 2008, revenue climbed 19% to $310.6 million from $260.4 million the prior year. Diluted earnings per share (excluding a one-time favorable gain) increased 5% to $.44 compared to $.42/share last year during the same period.
GPN beat expectations of analysts polled by Thomson Financial who had expected earnings of $.42/share on revenue of $300.9 million. In addition, the company raised guidance for 2008--now expecting profits of $1.95 to $1.97, up from prior January guidance of $1.89 to $.96. In addition, the range of revenue expectations for fiscal 2008 was increased to $1.25 to $1.26 billion from prior January guidance of $1.23 to $1.26 billion.
Reviewing the Morningstar.com '5-Yr Restated' financials page, we can see a beautiful picture that remains intact of steadily increasing revenue from $516 million in 2003 to $1.06 billion in 2007 and $1.16 billion in the trailing twelve months (TTM). Earnings have increased from $.70/share in 2003 to $1.75/share in 2007 and $1.84/share in the TTM. The company does pay a dividend but has kept it at $.08/share during this same period. Total shares have climbed less than 10% during this time, from 75 million in 2003 to 78 million in 2007 and 81 million in the TTM. This less than 10% share dilution occurred during the same period that revenue increased more than 100% and earnings also climbed more than 100%.
Free cash flow is solidly positive although not particularly increasing between 2005 and the present. And the balance sheet is gorgeous with $363 million in cash which by itself can easily cover both the $189.1 million in current liabilities and the $109.9 million in long-term liabilities combined. With over $500 million in total current assets, the current ratio works out to a healthy 2.70.
Reviewing the 'point & figure' chart on Global Payments (GPN) from StockCharts.com, we can see that the stock while under pressure recently has neither broken down nor 'broken out' in its price performance. Instead it has been trading in a narrower and narrower range, most recently appearing to be ready to break-out on the upside. (Or is that wishful thinking?) In any case, it certainly doesn't appear to be over-extended, nor convincingly in a decline.
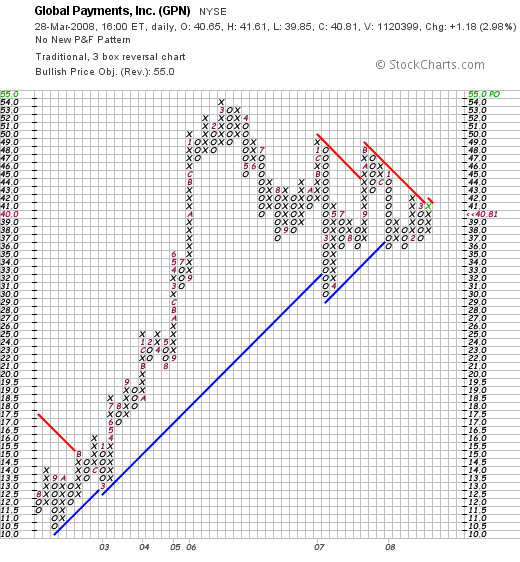
GLOBAL PAYMENTS (GPN) IS RATED A BUY
 The next stock I 'picked' on the blog didn't fare as well as the previous two.
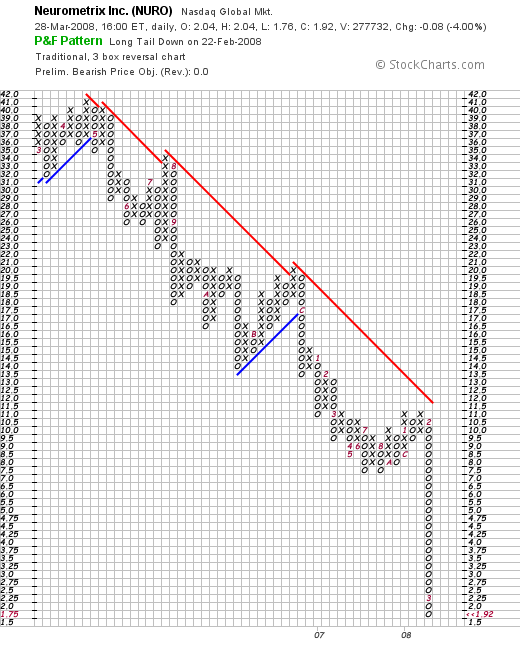
NeuroMetrix (NURO) was selected for Stock Picks Bob's Advice on September 14, 2006, when the stock was trading at $20.50. I do not own any shares nor any options of this stock. NURO closed at $1.92 on March 28, 2008, for a loss of $(18.58) or (90.6)% since posting.
On February 12, 2008, NURO reported 4th quarter 2007 results. For the quarter ended December 31, 2007, revenue came in at $10.1 million, down from $14.2 million during the same period last year. They also reported a net loss of $(2.1) million this year compared to net income of approximately $1 million the prior year. This worked out to a net loss of $(.17) per share for the quarter compared with a profit of $.08/share the prior year.
According to analysts polled by Thomson Financial, the company actually beat expectations on earnings by no losing as much as was expected (!). Analysts were looking for a loss of $(.21)/share during the quarter. However, the company disappointed on revenue, as analysts were expecting revenue of $11.2 million during the period.
Reviewing the Morningstar.com '5-Yr Restated' financials on NURO, we can see that after growing their revenue from $9 million in 2003 to $55 million in 2006, the company dipped to $45 million in 2007. Earnings likewise improved from a loss of $(5.66) in 2003 to a profit of $.33/share in 2006 then turned negative at $.66 in 2007. Outstanding shares increased from 1 million in 2003 to 13 million in 2005 but have stayed stable since.
Free cash flow increased from $1 million in 2005 to $7 million in 2006 then turned negative at $(8) million in 2007. The balance sheet is solid with $7 million in cash and $35 million in other current assets easily covering the $8.7 million in current liabilities and the $.9 million in long-term liabilities reported on Morningstar.
Finally, looking at the 'point & figure' chart on NeuroMetrix (NURO) from StockCharts.com, we can see the dismal price performance of this pick. The stock declined gradually from $41 in April, 2006, to a level of $11.00 in January, 2008, only to plunge recently to the $1.92 level in March, 2008.
Even though it appears rather late with this assessment, with the poor earnings report, the poor Morningstar.com page, and the terribly weak price chart,
NEUROMETRIX (NURO) IS RATED A SELL
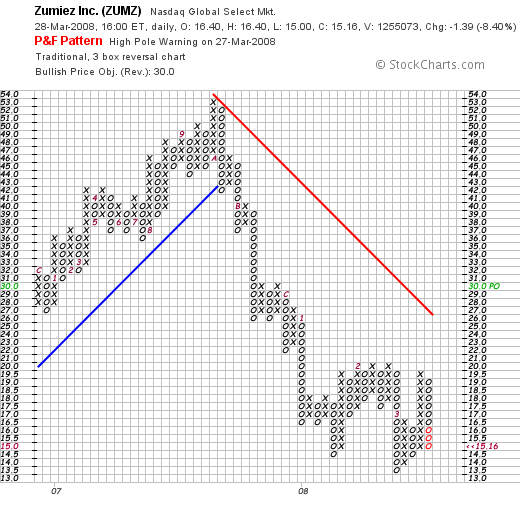
 Finally, on September 16, 2006, I posted Zumiez (ZUMZ) on Stock Picks Bob's Advice when the stock was trading at $26.24 per share. I do not own any shares or options on this company.
Zumiez closed at $15.16 on March 28, 2008, for a loss of $(11.08) or (42.2)% since posting.
On March 14, 2008, Zumiez (ZUMZ) reported 4th quarter 2007 results. For the quarter ended February 2, 2008, total net sales increased 12.7% to $126.6 million from $112.4 million in the same quarter last year. Net income for the quarter came in at $12.4 million or $.42/diluted share up from $11.3 million or $.39/share last year.
However, while positive, the torrid rate of growth at this retailer slowed considerably. For the quarter, same-store sales increased 4.0% compared with last year's same-store sales growth of 12.0%.
The company beat expectations during the quarter both on earnings and revenue. Sales, according to analysts polled by Thomson Financial, had been expected to come in at $126.1 million (they camne in at $126 million) and earnings were expected at $.38/share (they came in at $.42/share).
The company predicted low single digit same store sales growth in 2008 and profit of about $.90 to $.93/share. This was essentially in line with analysts' expectations for $.92/share in 2008.
With the recent recession fears and reports of weak retail sales, it is not surprising that Oppenheimer analyst Roxanne Meyer recently cut the ratings of Zumiez to "perform". However, with the relatively strong quarterly report,
ZUMIEZ (ZUMZ) IS RATED A HOLD
Reviewing the Morningstar.com '5-Yr Restated' financials, we can see that the record of steady revenue growth, earnings growth, stable shares, and positive free cash flow is intact. The balance sheet is solid with $136 million in total current assets, compared to $43.4 million in current liabilities and the $18.1 million in long-term liabilities.
Finally, looking at the 'point & figure' chart on Zumiez from StockCharts.com, we can see the terrible weakness in the price chart that developed in October, 2007, when the price declined from a peak of $53 to a low of $13.50 in March, 2008. Currently at $15.16, the stock is struggling to find support at this lower level. I do not like the technicals on this chart, but from the earnings news and the Morningstar.com report, I have to feel that the reaction of the street must be overdone on this chart and a reversal in price sentiment must soon be overdue.
So how did I do during that week in September, 2006? In a word, mediocre! The four stocks 'picked' during the week experienced an average loss of (35)% since posting. This certainly shows the risk of an kind of buy and hold strategy in a dynamic environment where prospects for companies do change.
In any case, thank you again for visiting! If you have any commnents or questions, please feel free to leave them on the blog or email me at bobsadviceforstocks@lycos.com.
If you get a chance, be sure and visit my Covestor Page where my actual trading account is tracked and analyzed, my SocialPicks Page where my stock picks from the last year or so have been monitored, and my Podcast Page where you can listen to me discuss some of the same stocks I write about here on this website.
Have a great Sunday and a solid week ahead.
Yours in investing,
Bob
Posted by bobsadviceforstocks at 6:35 PM CDT
|
Post Comment |
Permalink
Updated: Tuesday, 8 April 2008 11:13 AM CDT
Wednesday, 26 March 2008
Playing the 'Stock Market Game' on Marketocracy!
Hello Friends! Thanks so much for stopping by and visiting my blog, Stock Picks Bob's Advice! As always, please remember that I am an amateur investor, so please remember to consult with your professional investment advisers prior to making any investment decisions based on information on this website.
 Instead of talking about any particular stock this afternoon, I wanted to share with you my own experience with a great website Marketocracy where you can play what I would call the 'Stock Market Game' that is similar to the simulations that so many of us have played in high school, or have been asked by our kids to advise them as they were introduced to the Market in their own classes.
I would absolutely encourage you all to sign up and get a free account with the $1 million in 'play money' to simulate a portfolio of stocks. (Unlike my Prosper.com account where I stand to get $25 and you the new lender also get $25 if you sign-up through my link, I do NOT receive anything in any way, shape, or fashion if you participate or not in Marketocracy.)
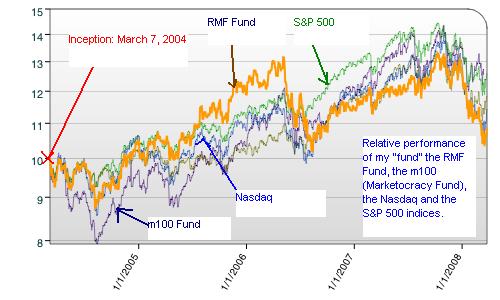
My own performance on Marketocracy dates back to March 7, 2004, when I first signed up and started the 'game'. In a word, my fund which I calll the RMF fund, while at times outperforming the market, has performed only in what I would have to call a very uninspired, almost mediocre fashion.
I wanted to share with you some of my latest 'strategy' in dealing with a large portfolio like this and see whether any of you might wish to comment on this portfolio management strategy which is quite different from my own idiosyncratic portfolio strategy that I employ in actuality and on the blog.
Currently my 'portfolio' has 53 positions (!). (Please remember that this Marketocracy fund is a simulated account which was strarted back in 2004 with $1,000,000 in value.) The current value, as of the close yesterday, is $1,073,526.93. Cash is at $5,765.21, with a stock value of $1,067,761.72. The current NAV (net asset value) is $10.74.
Ranking compared to all of the other portfolios on Marketocracy, as of December 31, 2007, the RMF Fund was at a 52.4% percentile for one month, 70.9% ranking for 3 months, 81.5% for 6 months, 72.2% for 1 year, 31.2% for 2 years and 55.7% at 3 years. A satisfactory performance, but nothing really to 'write home' about.
Marketocracy updates the portfolio frequently during the day, and you are able to make simulated trades based on recent trading prices for the equities involved. They keep track of your performance and monitor you for 'compliance' with some of their own Marketocracy rules. My fund has remained 'compliant' throughout the four year period I have been involved with this website.
My goal with the Marketocracy Account has been to make trading more or less automatic, with the emphasis on concentrating on the better-performing holdings, limiting my losses on the less-successful stocks, and developing a system to do this as automatically as possible.
Still trusting in the price momentum to identify possible purchase candidates, I check the list of top % gainers several times/week and consider buying stocks from these lists if they are over $10 and otherwise meet some of my criteria. (I am not quite as rigid as I am with my own actual trading account, and will often purchase small positions of stocks solely on the fact that they are on the top % gainers list).
Instead of purchasing a full position--which for me on this account would be at 4% of the portfolio--I have recently chosen to just purchase 100 shares of the stock, and let the price action either dictate me to be adding to that position or determining instead that it is time to sell.
In addition to these 100 share initial purchases, given that there are funds available, I try about once/day to go through the list of stocks and add 100 shares to any of the stocks that are in the top 1/3rd of performing stocks in my portfolio (Marketocracy breaks down the holdings into the top third, middle third, and bottom third of holdings), as long as I am under 4% in position size and the stock is moving higher in price. (If the stock is moving higher, even if it is a small position, I do not add to the position if it is in the middle third or lower third of holdings.)
If a stock is doing so well that it has now exceeded 5% of the holding, then I sell 100 shares of that holding. In addition, I sell 100 shares of a holding if it is in the lower third of the portfolio, is above 100 shares in size, and the stock price is declining. I only get down to a 100 share position, which finally is sold if the stock drops to an 8% loss or greater. If I have a large position, the stock is in the lower third of my portfolio, and the stock is declining, I still only sell 100 shares each day of that position. If the stock is actually rising, I don't sell any shares at all.
I don't do anything with stocks in the middle third of my portfolio. These stocks are more or less in 'no man's land' and are left alone whether they be rising or falling, whether they are at 4% or 1%. it just doesn't matter to me.
Anyhow, I wanted to write up a little something about my Marketocracy experience. I shall try to update it again in the future. I am still learning and developing 'systems' to manage the holdings in this account. I hope that if I am successful, then I shall have added to the understanding on managing stock holdings in larger accounts.
 In the meantime, come and visit Marketocracy, set up an account, and start playing! As in that famous Alka-Seltzer commercial, let me just suggest,
"Try it, you'll like it!"
Bob
Posted by bobsadviceforstocks at 3:49 PM CDT
|
Post Comment |
Permalink
Updated: Wednesday, 26 March 2008 3:55 PM CDT
Saturday, 22 March 2008
"Looking Back One Year" A review of stock picks from the week of September 4, 2006
Hello Friends! Thanks so much for stopping by and visiting my blog, Stock Picks Bob's Advice! As always, please remember that I am an amateur investor, so please remember to consult with your professional investment advisers prior to making any investment decisions based on information on this website.
It was a shortened trading week with Good Friday giving us all a well-needed break from the volatility of trading recently. But one of the things I like to do on this blog is to review past stock picks. Going a week at a time, I started this process out reviewing stocks from the prior year. Well one thing led to another, and now I am about a year-and-a-half out from these reviews.
Last week I reviewed the picks from August 28, 2006 (there weren't any), and going a week ahead, let's look at the pick from the week of September 4, 2006. As I have pointed out previously, these reviews assume a buy and hold approach to investing. In practice, I advocate as well as personally employ a disciplined portfolio management strategy (except when I make one of my 'trades'), involving limiting losses on the downside by selling entire positions that are performing poorly, and locking in gains by selling small portions of holdings as they reach appreciation targets.
For the ease of analysis, I have always assumed a buy and hold approach to these stock picks. However, the difference in these strategies would certainly affect performance.
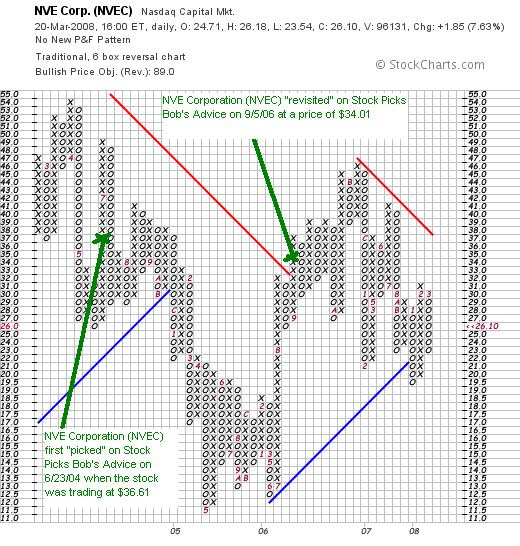
 During the week of September 4, 2006, I actually posted only one stock pick idea: NVE Corporation was 'picked' on September 5, 2006, at a price of $34.01. NVEC closed on March 20, 2008, at $26.10 for a loss of $(7.91) or (23.3)%. I do not own any shares of this stock nor do I have any options on it.
The post in 2006 was actually a 'revisit' of this stock as it has been a 'favorite' of mine (a previous selection on this blog), having 'picked' it on June 23, 2004, when the stock was trading at $36.61, an even higher price, and yet even though I have posted the stock twice previously, and the stock has declined each time subsequently (!), I would like to explain why
NVE CORPORATION (NVEC) IS RATED A BUY.
What exactly does this company do?
According to the Yahoo "Profile" on NVEC, the company
 "...engages in the development and sale of devices using spintronics, a nanotechnology, which utilizes electron spin rather than electron charge to acquire, store, and transmit information. The company provides standard sensors that detect the presence of a magnet or metal to determine position or speed; custom sensors primarily for medical devices; and couplers that use semiconductor input stages, primarily for factory and industrial networks."
How did they do in the latest quarter?
On January 23, 2008, NVE Corporation (NVEC) reported 3rd quarter 2008 results. for the quarter ended December 31, 2007, the company announced total revenue of $4.77 million, a 23% increase from the $3.86 million in the prior-year same period. Net income climbed 62% to $1.7 million or $.36/diluted share compared to $1.05 million or $.22/share the prior year.
As is so important with an earnings announcement, it was their performance relative to expectations that was most impressive. In fact, the $.36/share exceeded expectations according to analysts polled by Thomson Financial which had been looking for $.30/share. this was enough to have both Broadpoint Capital and Northland Securities upgrade their ratings on this stock to "Buy" and "Outperform" from neutral ratings.
What about longer-term results?
Looking at the Morningstar.com "5-Yr Restated" financials, we find that revenue has steadily increased from $9 million in 2003 to $16 million in 2007 and $19 million in the trailing twelve months (TTM), (except for a dip from $12.0 million in 2004 to $11.6 million in 2005). Earnings have also been improving recently with a bit of an erratic record between 2004 and 2006, from $.15/share in 2003 to $1.00 in 2007 and $1.37/share in the TTM. (Earnings dipped from $.45/share in 2004 to $.37/share in 2005 before rebounding and steadily increasing from $.39/share in 2006 to the current levels).
Outstanding shares have been stable with 4 million reported in 2003 increasing to 5 million in the TTM. Free cash flow has been positive and improving recently with -0- in 2005, $3 million in 2006, $5 million in 2007 and $6 million in the TTM.
The balance sheet is solid with $1 million in cash and $8 million in other current assets, which when compared to the $1.2 milliion in current liabilities yields a current ratio of over 7. NO long-term debt is reported on Morningstar.com.
What about some valuation numbers?
Checking the Yahoo "Key Statistics" on NVEC, we can see that this is really a tiny company, what we call a Micro Cap Stock, with a market capitalization of only $121.05 million.
The trailing p/e is reasonable (imho) at 19.12, with a forward p/e (fye 31-Mar-09) estimated at 15.17. This steady growth in earnings anticipated, results in a PEG of only 0.70, which for me is quite cheap.
Using the Fidelity.com eresearch website, we find that the Price/Sales (TTM) ratio is a bit steep at 6.35 compared to the industry average of 3.54. In terms of profitability, Fidelity reports that the Return on Equity (TTM) is a bit better than average at 24.52%, compared to the industry average of 22.22%.
Returning to Yahoo, we can see that this company has only 4.64 million shares outstanding with 4.62 million that float. As of 2/26/08, there were 444,640 shares out short representing 9.65 of the float or 5.9 trading days of volume. This is well down from the 1.08 million shares that were out short the prior month. This suggests that over 500,000 shares that were out short have been re-purchased as the negativity surrounding this stock appears to be reduced with the strong earnings report....at least that would be my take. I just don't see what is so negative about this company to be selling short!
Finally, as noted above, not dividends are paid and the last stock split was actually a reverse split of 1:5 on November 22, 2002.
What does the chart look like?
Reviewing the 'point & figure' chart on NVEC from StockCharts.com, we can see the very unimpressive technical appearance of this stock chart which has declined from a peak of $54 in April, 2004, to a low of $11.50 in may, 2005, only to start climbing in an erratic fashion to a peak of $46 in November, 2006, recently dipping past support at $19.50, and trying to find some support for a move higher. The stock is certainly not over-extended technically (lol), but appears longer-term to be breaking through the downward move from 2004 (?).
Summary: What do I think about NVE Corporation?
Well, needless to say, despite the mediocre chart, I really like this stock. Am I a glutton for punishment or what? But seriously, they reported a terrific quarter, beat expectations, and have a record recently of terrific revenue and earnings growth, positive free cash flow, and a solid balance sheet.
Valuation-wise, except for the rich Price/Sales ratio, they have a reasonable p/e, a great PEG, and a Return on Equity exceeding their peers. Now, if we could only see a bit more technical support in the stock chart :).
Thanks again for visiting! If you have any questions or comments, please feel free to leave them on the blog or email me at bobsadviceforstocks@lycos.com. If you get a chance, be sure and visit my Covestor Page where you can follow my actual trading account, my SocialPicks page where you can review my past stock picks from the last year or so, and my Podcast Page where you can download some mp3's of me discussing a few of the stocks I write up here on the website.
Have a great weekend everyone! And a Happy Easter to all of my friends!
Yours in investing,
Bob
Thursday, 20 March 2008
Do Large Banks Need More Financial Help than Homeowners?
Last week the White House made it clear that they would use the veto power of the President to stop the effort by Congressional Democrats to assist homeowners who may be facing foreclosure.
As reported:
"Opening what is likely to be an intense political battle in the deepening mortgage crisis, the White House said it strongly opposed the bill, which would let bankruptcy court judges modify the terms of a mortgage as part of the restructuring of a debt in a bankruptcy filing."
The article continued:
"But mortgage lenders, and the Wall Street firms that purchased the loans, have mounted a campaign against the bill, saying it would send a chilling message to investors and lead to higher borrowing costs in the future.
“We’re pulling out all the stops on this,” said Stephen O’Connor, chief lobbyist for the Mortgage Bankers Association. “How will lenders and investors react to the added risk? They will likely charge a higher interest rate, likely charge more points on the mortgage and likely demand higher down payments.”"
Not wanting to send any 'chilling messages' to investors, these same Wall Street firms are now borrowing billions of dollars to help their own financial future.
I read with interest today:
"The new lending program gives the 20 primary dealers of Treasury securities special access to the Fed's discount window. The overnight loans are overcollateralized and pay the prevailing discount rate, currently 2.50%."
But I guess it wouldn't be fair for a bankruptcy court to reduce a mortgage interest rate to say....something like 2.5% would it?
Who were these borrowers willing to take money from the Fed?
As noted in the same article:
"In the week ending Wednesday, the investment banks borrowed a daily average of $13.4 billion from the Fed, implying an average borrowing of about $19 billion for Monday and Tuesday.
Three investment banks -- Morgan Stanley, Goldman Sachs and Lehman Bros. -- have publicly announced they borrowed from the Fed. Others may also have done so, but the names of the borrowers are not announced by the Fed."
Also:
"As part of the takeover bid, the Fed also gave J.P. Morgan up to $30 billion in support for potential losses from the riskiest assets owned by Bear. That credit line had apparently not been tapped as of Wednesday."
And the cost of aid to the public instead of to Morgan Stanley and the like?
As the Wall Street Journal
reported, the Representative Barney Frank proposal would assist distressed homeowners and cost the FHA $10 billion.
Meanwhile, President Bush is also threatening to veto the reckless $4 billion in aid to states and localities to redevelop abandoned and foreclosed houses.
Contrast THAT to the aid given the last two days to the banks.
Is it really too much to ask for a government to offer
'fair and balanced' assistance to lenders and borrowers alike?
Bob
Posted by bobsadviceforstocks at 6:06 PM CDT
|
Post Comment |
Permalink
Updated: Thursday, 20 March 2008 6:14 PM CDT
Tuesday, 18 March 2008
FactSet Research Systems Inc. (FDS) "Revisiting a Stock Pick"
Hello Friends! Thanks so much for stopping by and visiting my blog, Stock Picks Bob's Advice! As always, please remember that I am an amateur investor, so please remember to consult with your professional investment advisers prior to making any investment decisions based on information on this website.
I am still getting over my terribly bad case of timing yesterday, when I bought and sold Lehman (LEH) for a quick loss. Very quick. Yesterday I bought a bunch of Lehman for $34+ and then sold about 20 minutes later at about $31+...for about a $(2,500) quick loss and swore I would be done (for quite a while) with these 'trades' after burning my fingers once more. Ironically (!), Lehman closed TODAY at $46.49, up $14.74. So I had the right idea but horrible timing. :(. I am an investor, not a trader. Let me write THAT one on the blackboard about 1,000 times....hmmmm.
 Anyhow, the market was kind to me and I made up some of the loss with the big move higher. The Dow closed today (3/18/08) at 12,392.66, up 420.41, and the Nasdaq closed at 2,268.26, up 91.25, with the S&P closing at 1,330.74, up 54.14. What a volatile ride we have ALL been having! It is hard to know where the market will be in an hour, let alone next week!
As the French author, Francois de la Rochefoucauld has written:
"The only thing constant in life is change"
...so it is with the market these days.
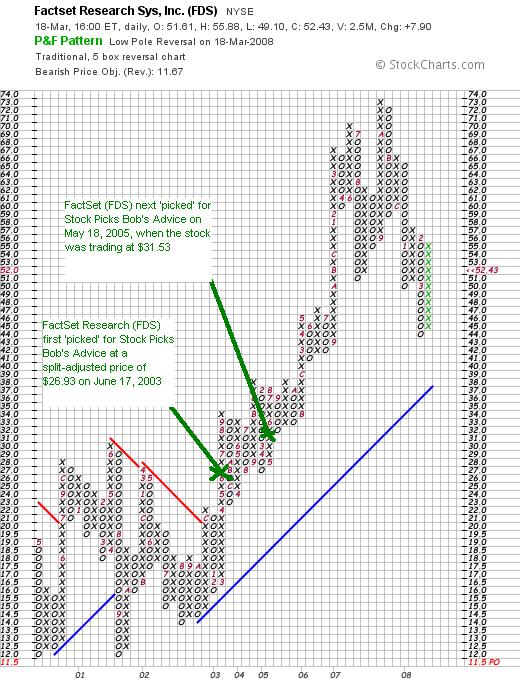
Licking my wounds, and returning to the list of top % gainers today, I was pleased to see FactSet Research Systems Inc. (FDS) on the list closing at $52.43, up $7.90 or 17.74% on the day. I do not own any shares nor do I have any options on this stock.
 I should point out that FactSet is an 'old favorite' of mine, having written about this twice previously on this blog. I first reviewed FactSet (FDS) on Stock Picks Bob's Advice on June 17, 2003, when the stock was trading at $40.39, which adjusted for a 3:2 stock split on February 7, 2005, this works out to a price of $26.93. FactSet was next revisited on Stock Picks Bob's Advice on May 18, 2005, when the stock was trading at $31.53. With today's close at $52.43, this represents an appreciation of $25.50 or 94.7% since my 2003 post, and an appreciation of $20.90 or 66.3% since my 2005 post.
Let's take a closer look at this stock and I will show you why
FACTSET RESEARCH (FDS) IS RATED A BUY
What exactly does this company do?
According to the Yahoo "Profile" on FactSet (FDS), the company
"...provides financial and economic information, including fundamental financial data on various companies to the investment community worldwide. Its primary product includes Marquee, a quotes and news application for company's investment management and banking clients."
And how did they do in the latest quarter?
It was the announcement of 2nd quarter 2008 earnings today, combined with the rally in equities that led to the big spike in price in FDS stock today. Earnings for the quarter ended February 29, 2008, increased 21% to $140.2 million compared to the year earlier same period. Net income increased to $29.5 million from $26.5 million last year and diluted earnings per share grew to $.59 from $.52 last year.
As pointed out in this report, "Excluding one-time costs and gains, the company earned $31.1 million or 62 cents per share compared with $26.5 million or 52 cents per share last year." This was ahead of analysts expectations according to analysts polled by Thomson Financial who expected profit of $.60/share. The company also beat expectations on revenue which had been expected to come in at $139.6 million.
Factset also raised guidance today for the upcoming quarter, guiding sales to between $145 and $149 million compared to the $121.1 million reported in the 3rd quarter of 2007. Currently, analysts polled by Thomson Financial are expecting sales of $143.5 million.
This is what I have in the past referred to as a 'trifecta-plus' in an earnings report: strong growth in both revenue and earnings, beating expectations on both, associated with the raising of guidance for future results! There isn't much more an investor could want from a report than this!
What about longer-term results?
Since I am generally not interested in 'one-quarter wonders' on this blog, and instead am looking for stocks demonstrating persistence of quality results, I like to review the Morningstar results on each company.
Reviewing the "5-Yr Restated" financials from Morningstar.com on this company, we can see the steady revenue growth noted by the gradual pattern of increasing purple bars...with $222 million in revenue in 2003 increasing to $476 million in 2007 and $501 million in the trailing twelve months (TTM).
Earnings show an equally consistent and impressive pattern of growth, growing from $.99/share in 2003 to $2.14/share in 2007 and $2.25/share in the TTM. The company also pays a dividend and has been steadily increasing it from $.15/share in 2003 to $.36/share in 2007 and $.42/share in the TTM. Outstanding shares have been extremely stable with 52 million shares reported in 2003 actually decreasing to 51 million in the TTM.
Free cash flow has been positive and has grown, except for a slight dip in the TTM, from $72 million in 2005 to $117 million in 2007 and $110 million in the TTM.
The balance sheet appears quite healthy to me with $155 million in cash, which by itself could easily pay off both the $64.9 million in current liabilities and the $28.7 million in long-term liabilities combined with plenty left over as well! Calculating the current ratio, the $242 million in total current asset, when divided by the $64.9 million in current liabilities, yields a very healthy ratio of 3.73.
What about some valuation numbers?
Reviewing the Yahoo "Key Statistics" on FactSet (FDS), we find that the company is a mid cap stock with a market capitalization of $2.53 billion. The trailing p/e is a very acceptable (for me) 23.29, with a forward p/e (fye 31-Aug-09) of 18.53). With rapid growth estimated to continue, the PEG ratio works out to an acceptable 1.15 (generally I prefer PEG's between 1.0 and 1.5).
Looking at the Price/Sales ratio, we can see that the stock is reasonably priced with a Price/Sales (TTM) figure of 4.32 compared to the industry average of 4.78 per the Fidelity.com eresearch website. Profitability may be a little light compared to comparables, at least as measured by the Return on Equity (TTM) which comes in at 27.88% vs. the $31.41% ROE (TTM) of similary companies per Fidelity.
Finishing up with the Yahoo numbers, there are 48.23 million shares outstanding with 42.87 million that float. Currently (as of 2/26/08) there are 4.89 million shares out short, representing 9.7 trading days of volume (the short ratio)--far in excess of my own '3 day rule' for significance. This is 11.3% of the float---and may have well resulted in a 'short squeeze' today on the back of the great earnings report and the surge in overall stock prices.
As I noted, the company pays a dividend which on a 'forward basis' is $.48/share or yielding 1.00%. The last stock split, also noted above, was a 3:2 split on February 7, 2005.
What does the chart look like?
Looking at the 'point & figure' chart on FactSet Research (FDS) from StockCharts.com, we can see the tremendous appreciation in stock price from a low of $12 in September, 2001, to a high of $73 in October, 2007. The stock has been under some pressure recently along with all of the financial-related companies, but rebounded strongly today. The chart still looks acceptable to me without being over-extended but I would appreciate seeing the stock back at the $68 level before this amateur could feel that the technicals looked quite encouraging!
Summary: What do I think?
Needless to say I really like this stock. The only thing giving me concern has been the recent weakness in all of the Financial Stocks and this stock rides along with those companies. They reported great earnings, beat expectations and raised guidance. Longer-term, they have steadily raised revenue results, earnings results, and also pay a dividend which they have been steadily raising!
Outstanding shares are absolutely stable, free cash flow is positive and basically growing, and the balance sheet appears solid.
Valuation-wise, the p/e is moderate, the Price/Sales is low compared to its peers, the Return on Equity is a tad weak, but the PEG is at a very acceptable level. On top of this, there are a lot of short-sellers who are feeling the Cramer 'house of pain' in this stock. Finally, with the current move higher, the stock chart is moderately hopeful for a continued appreciation in this stock price. If I were buying a stock (at least when I am following my own rules :(), this is the kind of stock I would be buying.
Thanks so much for stopping by and visiting! If you have any comments or questions, please feel free to leave them on the blog or email me at bobsadviceforstocks@lycos.com. If you get a chance, be sure and visit my Covestor Page where my actual Trading Portfolio is reviewed and analyzed, my SocialPicks page where you can find out more about my stock picks from the past year, and my Podcast Page where you can download some mp3's of me discussing some of the many stocks I review here on the blog.
I hope this entry finds you in good health and at least slightly better spirits today as fed pulls out almost all of the plugs to get the economy and this market moving once more.
Yours in investing,
Bob
Monday, 17 March 2008
Lehman Bros (LEH) "Trading Transparency"
Quick post. Dumb move on Lehman (LEH). WHAT was I thinking?
Anyhow, I undid that trade, settled down, and am back to my usual trading rules. The market handed me a loss as quickly as I ever have seen. That was a head-fake with a rally, and now the bear came roaring back loud as ever.
Trade: Sold 1,000 shares of LEH at $31.411.
I shall keep you posted.
Just about every time I try something like this, I learn a lesson. OUCH.
Shows you why I still blog. Why I am accountable to all of you. And I am sorry if I disappointed anyone with that trade. I am human after all. It just looked too good to be true. And it was.
More later.
Yours in investing.
Bob
Lehman Bros (LEH) "Trading Transparency"
Hello Friends! Thanks so much for stopping by and visiting my blog, Stock Picks Bob's Advice! As always, please remember that I am an amateur investor, so please remember to consult with your professional investment advisers prior to making any investment decisions based on information on this website.
A few moments ago I took a shot at a bounce on Lehman (LEH) on a bounce. I know I shouldn't be making trades, but then again, if it breaks down, I am out quickly.
Here are the details:
1,000 shares of LEH purchased at $34.274. I suspect the bounce won't hold, and I shoulda known better. Anyhow,
I'll keep you posted. LEH is dropping further as I write. $32.73. So....I think I am out if it breaks $32.00. Could be in five minutes :(.
Bob
O.K. I promise to stick to my rules next time. double-promise.
Sunday, 16 March 2008
Bear Stearns (BSC) To Be Sold at $2/share?
Hello Friends! Thanks so much for stopping by and visiting my blog, Stock Picks Bob's Advice! As always, please remember that I am an amateur investor, so please remember to consult with your professional investment advisers prior to making any investment decisions based on information on this website.
 It has been reported that JPMorgan Chase & Co. will be purchasing Bear Stearns (BSC) in an all-stock transaction that works out to $2/share.
"NEW YORK (Reuters) - JPMorgan Chase & Co said on Sunday it would buy stricken rival Bear Stearns for just $2 a share in an all-stock deal valuing the fifth largest investment bank at about $236 million.
Under the deal, the Federal Reserve will provide special financing and has agreed to fund up to $30 billion of Bear Stearns' less liquid assets.
In a statement, JPMorgan said it would exchange 0.05473 shares of its stock for one share of Bear Stearns' stock. It is guaranteeing the trading obligations of Bear Stearns and its subsidiaries."
Take a look at the chart for Bear Stearns from StockCharts.com:
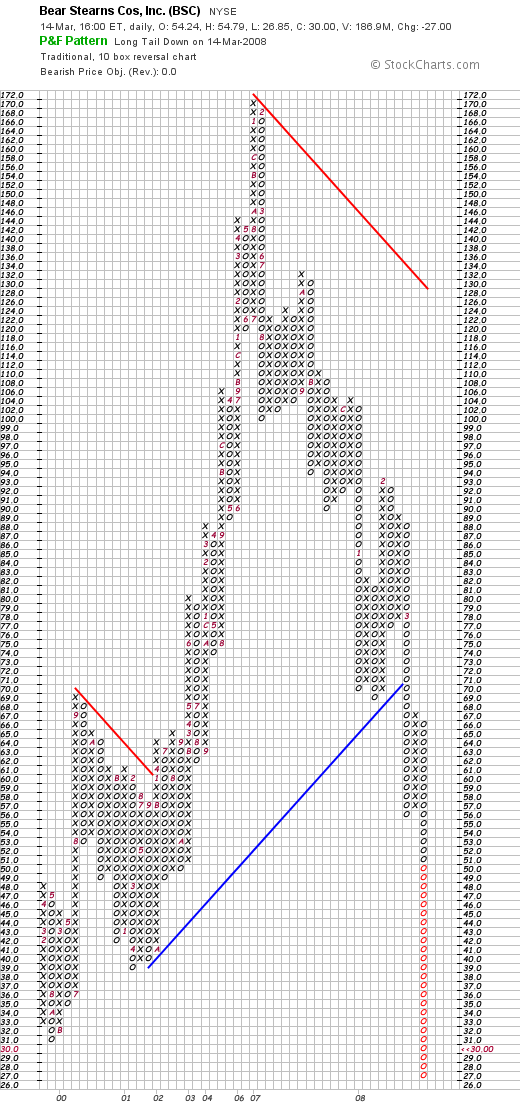
It is enough to make you sick.
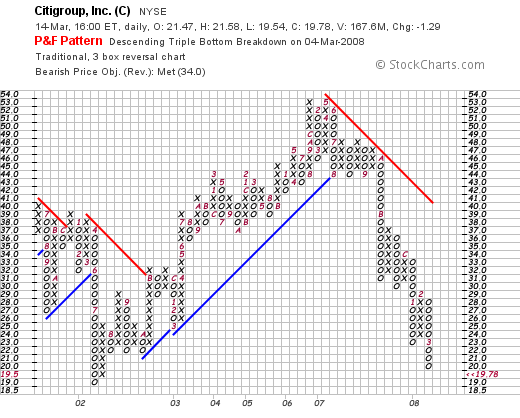
Let's just take a look at a few other financials:
The chart for Citigroup (C) from StockCharts.com:
Or the chart for Merrill Lynch:
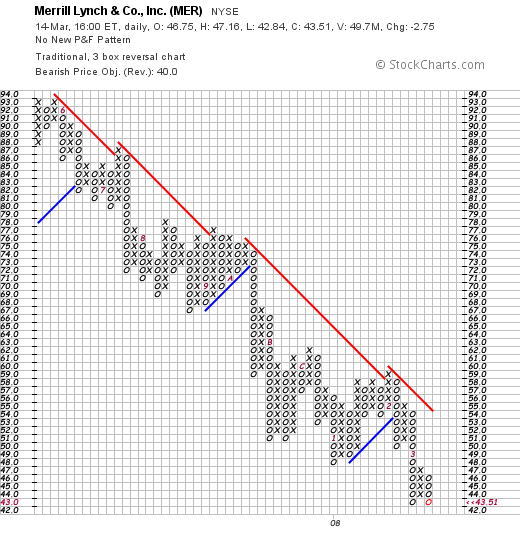
Or Washington Mutual (WM):
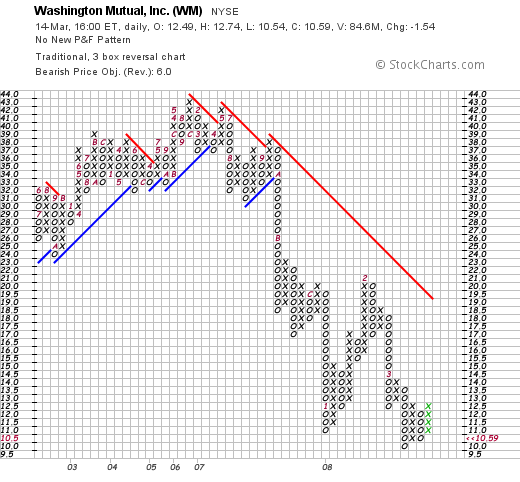
How low can these go?
And if that's not enough, here is the dollar-yen chart:
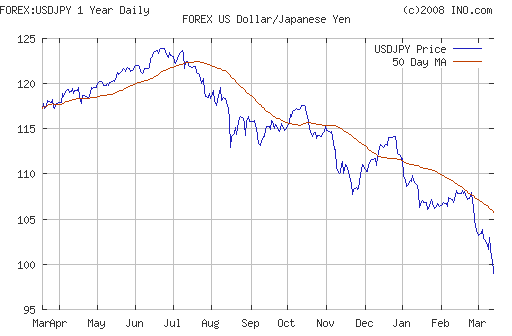
Just something to think about as we await the markets
An interesting footnote is the important role that JP Morgan has played in prior stock market melt-downs. An excellent review is found in The Big Picture, as they reflected on the 1929 crash:
"Thursday Oct. 24, 1929: For so many months so many people had saved money and borrowed money and borrowed on their borrowings to possess themselves of the little pieces of paper by virtue of which they became partners in U. S. Industry. Now they were trying to get rid of them even more frantically than they had tried to get them. Stocks bought without reference to their earnings were being sold without reference to their dividends. At around noon there came the no-bid menace. Even in a panic-market, someone must buy the "dumped" shares, but stocks were dropping from 2 to 10 points between sales—losing from 2 to 10 points before a buyer could be found for them. Sound stocks at shrunk prices—and nobody to buy them. It looked as if U. S. Industries' little partners were in a fair way to bankrupt the firm.
Then at 1:30 p. m., a popular broker and huntsman named Richard F. Whitney strode through the mob of desperate traders, made swiftly for Post No. 2 where, under the supervision of specialists like that doughty warrior, General Oliver C. Bridgeman, the stock of the United States Steel Corp., most pivotal of all U. S. stocks, is traded in. Steel too, had been sinking fast. Having broken down through 200, it was now at 190. If it should sink further, Panic with its most awful leer, might surely take command. Loudly, confidently at Post No. 2, Broker Whitney made known that he offered $205 per share for 25,000 shares of Steel—an order for $5,000,000 worth of stock at 15 points above the market. Soon tickers were flashing the news: "Steel, 205 bid.'' More and more steel was bought, until 200,000 shares had been purchased against constantly rising quotations. Other buyers bought other pivotal stocks. In an hour General Electric was up 21 points, Montgomery Ward up 23, Radio up 16, A. T. & T. up 22. How far the market would have gone downward on its unchecked momentum is difficult to say. But brokers and traders alike agreed that the man who bid 205 for 25,000 shares of Steel had made himself a hero of a financially historic moment.
That hero, Richard Whitney, head of Richard Whitney & Co., was brother of George Whitney, Morgan Partner. Back of his action lay a noontime meeting held at No. 23 Wall St., Home of the House of Morgan. Although an excited Hearst reporter would have it that the Head of the House was present, actually, John Pierpont Morgan was in Europe. It was Partner Thomas W. Lament with whom conferred Charles E. Mitchell, National City Bank; William C. Potter, Guaranty Trust; Albert H. Wiggin, Chase National Bank; Seward Prosser, Bankers Trust. These men controlled resources of more than $6,000,000,000. They met briefly; they issued no formal statement. But to newsmen, Mr. Lamont remarked that brokerage houses were in excellent condition, that the liquidation appeared technical rather than fundamental. He also conveyed, without specifically committing himself, the impression that the banks were ready to support the market. And the meeting was hardly over before Hero Whitney had become Heroic.
Traders, talking over the Morgan meeting, failed to remember any previous occasion on which a stock market conference had been called while a trading session was still in progress. They did recall, however, that in 1907, with call money at 125%. Secretary of the Treasury Cortelyou conferred with J. P. Morgan, put $25,000,000 of Government funds into Manhattan banks, halted the Panic. They remembered too the Northern Pacific crash of 1901. when, after Northern Pacific stock had gone overnight from $150 to $1,000 a share, the House of Morgan, representing the late great James J. Hill and the House of Kuhn, Loeb, representing the late great Edward H. Harriman, compromised at $150 a share, saved from ruin many a short. Then there was the U. S.-England war scare of 1895 when, with money at 80%, J. P. Morgan offered money at 6%, averted a threatened crash.
Thus bankers have for a long time recognized their responsibilities as panic-preventers, and when the glass house of speculation has cracked and splintered, it has most often been the strong House of Morgan that has assumed the responsibility of fame and brought order out of confusion." (emphasis added)"
Anyhow, it may not be 1929, but then again, it is indeed JPMorgan Chase that is possibly (?) averting another crisis.
Yours in investing,
Bob
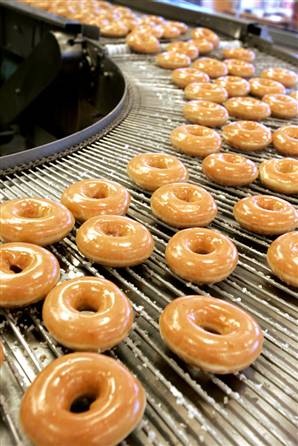
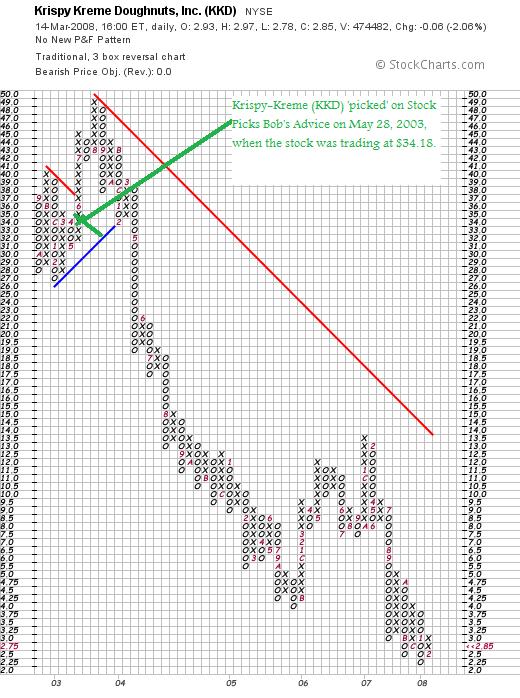
Krispy Kreme Doughnuts (KKD) "Long-Term Review #17"

Hello Friends! Thanks so much for stopping by and visiting my blog, Stock Picks Bob's Advice! As always, please remember that I am an amateur investor, so please remember to consult with your professional investment advisers prior to making any investment decisions based on information on this website. Seeing as I didn't have any stocks to review in my "Weekend Review", it seemed reasonable to take another 'long-term view' on this blog.
These reviews and analyses have been done assuming a 'buy and hold' approach to investing. In reality, I practice and advocate a disciplined investment strategy (a link to my podcast on this topic) that involves carefully screening stocks for inclusion into a trading portfolio and then managing those investments by limiting losses by quick sales on declines and preserving gains by selling portions of appreciating stocks at targeted appreciation levels.
Some months ago I decided that it would be helpful to start looking at the very earliest entries on this blog to find out how they all turned out. Hopefully with these analyses we can identify reasons to be selecting stocks and identifying what were the best prognosticators for success. And not all of these picks have been successful!
Last weekend I reviewed Westcorp (WES) which was initially posted on May 27, 2003. The very next day I wrote up Krispy Kreme Doughnuts (KKD) on Stock Picks Bob's Advice. Let's review that entry and see how KKD is doing today.
"May 28, 2003
Krispy Kreme Doughnuts (KKD)
The market paused this morning as if it wanted to correct as the bears came out growling....but the bulls resumed their push and the momentum on the upside continues. As I write (10:43 am CST) market up 45 points.
An old favorite of mine, Krispy Kreme Doughnuts, hit the list today. They had a GREAT earnings report today as they continue their explosive revenue and earnings growth....all on the back of a glazed doughnut! (so much for low carb dieting)....earnings reported today with earnings up a strong 47%, their sales rose 34% to $148.7 million from $111.1 million last year.
As reported by the CEO on CNBC this morning same store sales growth continued in the double digit area up about 11% year over year. (These are the stores that have been open at least a year).
On Morningstar we see sales growing from $80.9 million in 1999, $220.2 million in 2000, $300.7 million in 2001, $394.4 million in 2002, and now with a $148 million for the quarter we have about an extrapolated $600 mnillion level for the year 2003 if everything continues at the same rate.
Looking at cash flow we do see a NEGATIVE 34 million number but with all the rest of the figures so good, I guess we can look over this for a good doughnut or two. Maybe with a cup of their new coffee!
I do not at this time own any shares but have in the past and am not planning at this time to purchase new shares. Nobody in my family owns shares either.
Have a great day investing! Did anybody besides me snag some SYNO? Bob"
 Krispy Kreme Doughnuts (KKD) closed at $2.85 on March 14, 2008. Using Yahoo to get the historical price on Krispy Kreme we can see that KKD closed at $34.18 on May 28, 2003. Thus, I had a loss on this pick of $(31.33) or (91.7)% on this unfortunate stock pick! I do not currently own any shares nor do I have any options on this stock.
Let's take a closer look at this company and see how we should rate this stock!
What exactly does this company do?
According to the Yahoo "Profile" on KKD, the company
 "...operates as a branded retailer and wholesaler of doughnuts. It engages in the ownership and franchising of Krispy Kreme doughnut stores, which make and sell approximately 20 varieties of doughnuts. These stores also offer an array of coffees and other beverages. As of January 28, 2007, there were 395 Krispy Kreme stores operated system wide in 40 states in the United States, Australia, Canada, Hong Kong, Indonesia, Japan, Kuwait, Mexico, the Philippines, South Korea, and the United Kingdom, of which 113 were owned by the company and 282 were owned by franchisees. The company was founded in 1937 and is headquartered in Winston-Salem, North Carolina."
How did they do in the latest quarter?
On December 6, 2007, KKD announced 3rd quarter 2008 results. For the quarter ended October 28, 2007, sales declined (11.7)% to $103.4 million from $117.1 million in the third quarter of the prior year. The net loss for the quarter was $(798,000) or $(.01) per diluted share, improved from a loss of $(7.2) million or $(.12)/diluted share the prior year.
There has been a lot of turmoil at this doughnut maker. On January 7, 2008, the CEO was replaced by Chairman James Morgan. On the other hand, the underlying value in the company and the brand has not been ignored either; Kuwaiti contractor Mohamed Abdulmohsin Al Kharafi & Sons on February 5, 2008, increased its stake in the company up to a sizeable 13.8%.
What about longer-term results?
Examining the Morningstar.com "5-Yr Restated" financials, we can see that revenue actually increased along with earnings from 2003 to 2004 when revenue climbed to $649 million from $491 million and earnings jumped from $.52/share to $.78/share. However, in 2005 these results diverged with revenue continuing to grow to $708 million but the company turning in a large loss of $(3.22)/share. Since 2005 revenue has slipped sequentially down to $461 million in 2007 and $431 million in the trailing twelve months (TTM). Earnings have shown consistent although decreasing losses with $(2.20)/share reported in 2006, $(.70)/share in 2007 and $(.90)/share in the TTM.
Free cash flow has fortunately been positive recently with $18 million in 2007 and $8 million in the TTM. The balance sheet is also adequate with $23 million in cash and $54 million in other current assets reported. This total of $77 million in total current assets yields a current ratio of 1.69, an 'acceptable' current ratio imho. The company is reported to have an additional $114.7 million in long-term liabilities.
What about some valuation numbers?
Reviewing the data on Yahoo "Key Statistics" we find that Krispy Kreme (KKD) is now a 'micro cap' stock with a market capitalization of only $186.77 million. Since the company is losing money there is no trailing p/e. However, there are estimates of a return to profitability allowing us to estimate a forward p/e (fye 28-Jan-09) of 40.71. Again, no PEG ratio is possible.
Using the Fidelity.com eresearch website, we can see that valuation-wise, with a Price/Sales (TTM) ratio of only 0.43, compared to the industry average of 3.06, this represents an outstanding value. Also, with all of the recent losses, the return on equity (TTM) amounts to a (65.03)% compared to the industry average of 19.03%.
Finishing up with Yahoo, we can see that there are 65.53 million shares outstanding with 55.83 milion that float. Currently, there are 8.14 million shares out short representing 17.5 days of trading volume, a significant short-ratio imho using my own '3 day rule' of significance on short interest.
No dividends are paid and the last stock split was a 2:1 split back on June 15, 2001.
What does the chart look like?
Looking at the StockCharts.com 'point & figure' chart on KKD, we can see that the stock actually moved higher from October, 2002, when it was at $28 until my 'pick' and then peaked at $49 in August, 2003. The stock has had a dismal track record dipping first to $4.00 in October, 2005, rebounding up to $13.50 in January, 2007, only to dip down to a low of $2.25 in January, 2008. The stock is struggling at its current price, but it appears that most (?) of the damage may already have been done.
Summary: What do I think about this stock now?
First of all, in a Peter Lynch sort of fashion, I really like Krispy Kreme Doughnuts....ok they are fattening and all, and I am on a diet, but they are a nice treat.

The fundamentals on this stock are dismal. The only good thing I can say is that they are losing less money, are free cash flow positive, and have an adequate balance sheet. Revenue has been declining and the chart looks horrendous. It is just that so much of the damage has been done and the value of the stock is starting to look compelling with the Price/Sales ratio under 0.5.
Now if they could just turn profitable and start growing their revenue once again.
In general, I would like to say this is rated a "SELL" but with so much of the damage done, and the Kuwaiti investor starting to accumulate shares, I am forced to rate this differently:
KRISPY KREME DOUGHNUTS (KKD) IS RATED A HOLD
O.K. I hoped I didn't wimp out on this one. Just cause I love thouse doughnuts and am still in mourning after our own local Krispy Kreme outlet closed up. It has been easier to diet since then :). It just seemed that it would be 'too late' to start advising a sale on a stock that is this beaten up already!
Thanks again for visiting! If you get a chance, be sure and visit my Covestor.com website where my actual trading portfolio is reviewed, my SocialPicks Page where my stock picks from the past year or so are examined, and my Podcast Page where you can download mp3's of me discussing some of the many stocks I write about here on the blog. Good-luck next week investing. Be sure and maintain trading rules whatever you do! Limit your losses and exercise caution; it is getting ugly outside.
Yours in investing,
Bob
"Looking Back One Year" A review of stock picks from the week of August 28, 2006
Hello Friends! Thanks so much for stopping by and visiting my blog, Stock Picks Bob's Advice! As always, please remember that I am an amateur investor, so please remember to consult with your professional investment advisers prior to making any investment decisions based on information on this website.
I try to review past stock picks on weekends going a week at a time. Last weekend I examined the selections on this blog from the week of August 21, 2006. Going a week ahead to August 28, 2006, I took a break on the blog, not posting any selections that week. Thus, I am entitled to a break here with this review. I shall move to the next week in the future. Meanwhile, have a wonderful weekend and maybe a better week trading next week?
Yours in investing,
Bob
Posted by bobsadviceforstocks at 10:50 AM CDT
|
Post Comment |
Permalink
Updated: Sunday, 16 March 2008 10:51 AM CDT
Newer | Latest | Older


