


Hello Friends! Thanks so much for stopping by! I took a break from the Democratic Convention (I am a total political junkie and love to watch all of the politicians from both parties speak!), and decided I had better take care of my blog! Please remember, as always, that I am an amateur investor, so please consult with your professional investment advisors before taking any action based on information on Stock Picks Bob's Advice.
 National Instruments (NATI) had a very nice day today, closing at $27.89, up $3.13 or 12.64%. According to the Yahoo "Profile", NATI "...is a supplier of measurement and automation products. Its products consist of application software, and hardware components together with industry-standard computers, networks and the Internet to create measurement and automation systems." If THAT is less than clear to YOU, well, you are not alone. Clearly this is a high-tech manufacturing firm....but THAT is not what attracted me in some Peter Lynch style, but the NUMBERS...which I will review for you!
 Yesterday, after the close of trading, NATI announced 2nd quarter results. In a nutshell they were terrific: second quarter revenue was up 27% to $127 million, operating income was up 70% from last year, fully diluted earnings were $.14/share, up 56% from $.09/share the prior year. In addition, the company released guidance for the next two quarters anticipating continued growth in earnings and revenue. As always, these actions and results are very helpful in pushing a stock price higher, and NATI obliged!
How about longer-term? Looking at "5-Yr Restated" financials from Morningstar.com, we can see that revenue, although slightly erratic, has grown from $329.6 million in 1999 to $451.4 million in the TTM.
Earnings, while improving the last couple years, have been inconsistent, peaking at $.69/share in 2000, dropping to $.39/share in 2002, and then improving steadily since. Free cash flow looks nice with $(8) million reported in 2001, improving the $41 million in the TTM.
 Looking at the balance sheet on Morningstar, we find a superb set of numbers starting with $198.8 million in cash compared to $83.1 million in current liabilities and only $10.3 million in long-term debt. In addition, NATI has $156.2 million in other current assets. This looks very nice!
How about "valuation"? Looking at "Key Statistics" on Yahoo, we can see that this is a Mid-Cap stock with a market cap of $2.20 billion. The trailing p/e is steep at 52.33, with a forward p/e (fye 31-Dec-05) of 28.46. The PEG is also a bit rich at 2.09, and the Price/Sales is 4.08.
Yahoo reports 78.84 million shares outstanding with 48.10 million of them that float. There are a LOT of shares out short. As of 7/8/04, there were 3.31 million shares out short representing 13.127 trading days. The move today 'might' be a bit of a squeeze of the short-sellers as they scrambled to buy back pre-sold shares. This short interest is most likely due to the steep valuation (p/e), but with the latest quarterly results, I would be hard pressed defending anyone who was interested in selling this company short. (just my opinion.)
The company does pay a small dividend which it initiated in 2003, paying $.20/share yielding 0.81%. The last stock split was a 3:2 in February of this year.
How about the chart? Taking a look at a stockcharts.com Point & Figure Chart:
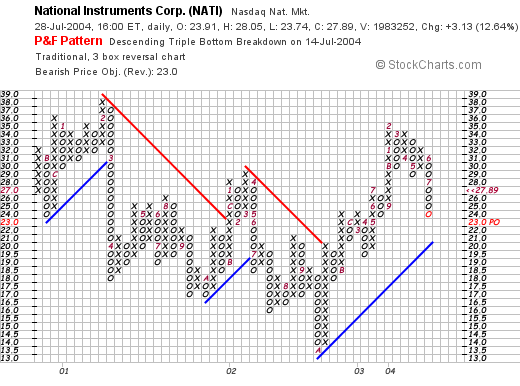
looking at the chart, and I am NOT a technician by any means, but you can see that this stock was trading lower between February, 2001 through October 2002, when it bottomed at $13.50. Since then it has been trading higher. The chart looks nice to me as the stock is currently heading higher and doesn't appear over-extended. Then again, take a look yourself at the graph and see what you think!
Well, what do I think? Well, I like the recent quarterly report a lot. I like the fact that NATI is predicting a continued growth in revenue and earnings for the next two quarters. I wish I had a better feel for their products....but the numbers aren't bad. The "valuation" is a bit steep both with a high p/e and a PEG just over 2.0, however, if the current explosive earnings growth continues, these numbers will be adjusted in a positive fashion. NATI is generating loads of cash and the balance sheet is superb. In addition, the recent initiation of cash dividends is always a plus as this will add additional investors who are looking for dividends as well as growth. Technically, the graph looks just fine and I like the fact that there are a LOT of short sellers out there. That is bullish imho. I would even consider buying some shares, but you know the story....I have to wait to sell something at a gain from my current portfolio!
Thanks so much for bearing with me! I hope that my discussion and links were helpful to you. If you have any questions, comments, or words of encouragement, please feel free to email me at bobsadviceforstocks@lycos.com .
Bob