Stock Picks Bob's Advice
Thursday, 16 February 2006
February 16, 2006 Barnes Group (B)
Click
***HERE*** for my PODCAST ON BARNES GROUP (B)Hello Friends! Thanks so much for stopping by and visiting my blog,
Stock Picks Bob's Advice. As always, please remember to consult with your professional investment advisors prior to making any investment decisions based on information on this website.

Earlier today I sold 33 shares (1/6th of my position) of Morningstar at a 30% gain level. This 'entitled' me, according to my trading strategy, to add a new position to my portfolio. With that nickel burning a hole in my pocket, I turned to the
list of top % gainers on the NYSE to find a suitable candidate for purchase. A new stock, Barnes Group (B), appeared to fit the bill and I went ahead and purchased 180 shares earlier today for my trading account. As I write, B is trading at $39.11, up $2.06 or 5.56% on the day.
And what does Barnes Group actually do?

According to the
Yahoo "Profile" on Barnes, the company
"...engages in the manufacture of precision metal components and assemblies; and distribution of industrial supplies. It operates through three segments: Barnes Distribution, Associated Spring, and Barnes Aerospace."
What drove the stock higher today, as is often the case, was an outstanding
4th quarter earnings report. Revenue for the quarter came in at $276.4 million, a 10% increase from the $251.6 million reported in the same quarter last year. Income for the quarter was $11.6 million, or $.47/share, up approximately 200% from $3.9 million or $.16/share last year. In addition, to complete the "trifecta", the company
raised guidance with expectations of earning $2.50 to $2.60/share in 2006. Currently analysts are expecting $2.44/share for the year.
How about longer-term?

Looking at the
"5-Yr Restated" financials on Barnes from Morningstar.com, we can see the steady increase in revenue from $.7 billion in 2000 to $1.0 billion in 2004 and $1.1 billion in the trailing twelve months (TTM).
Earnings during this period have been a bit erratic, dropping from $1.90/share in 2000 to $1.01 in 2002, increasing to $1.49/share in 2003, dipping to $1.40/share in 2004 and increasing to $2.14/share in the TTM. The company has been paying a dividend during this period increasing it from $.79/share in 2000 to $.80/share in 2004 and $.82/share in the TTM.
Free cash flow has been positive with $35 million reported in 2002, increasing to $45 million in the TTM.
The balance sheet as presented on Morningstar looks reasonable with $31.5 in cash and $354.9 million in other current assets. This is balanced against current liabilities of $247.8 million, giving B a current ratio of just under 1.5. In addition, the company is reported to have $369.4 million in long-term liabilities.
And what about some valuation numbers?

Looking at
Yahoo "Key Statistics" on Barnes, we can see that this is a mid-cap stock with a market capitalization of $924.95 million. The trailing p/e is reasonable (imho) at 18.10 with a forward p/e (fye 31-Dec-06) of 15.90. With the growth expected, the company based on 5 yr expected earnings, comes in with a PEG of 1.70.
Barnes is in the "Misc. Fabricated Products" industrial grup. Within this group, according to the
Fidelity.com eResearch website, Barnes is reasonably valued with a Price/Sales ratio of 0.8. Only Shaw Group (SGR) is more reasonable with a Price/Sales ratio 0f 0.7. Topping this group in richness in valuation is Ceradyne (CRDN) with a Price/Sales ratio of 4.2, followed by American Science and Engineering (ASEI) at 4.1, Parker Hannifin (PH)at 1.1, and Masco Group (MAS) at 1.0.
Going back to Yahoo for some additional numbers, we can see that the company has only 23.84 million shares outstanding with 16.16 million of them that float. Of these, 743,540 shares were out short as of 1/10/06, or 3.60% of the float, for a short ratio of 6.1. With this many shares out short, today's stock rise on good news good well represent (imho) a bit of a squeeze on the short sellers.
As I noted earlier, the company does pay a dividend, which in today's low interest environment is actually significant, at $.88/share or 2.40% yield on the common shares. The last stock split reported per Yahoo was a 3:1 split in April, 1997.
And what does the chart look like?
Examining the
"Point & Figure" chart on Barnes from Stockcharts.com:
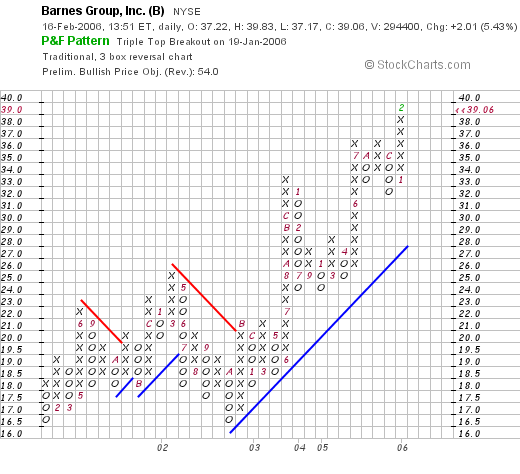
We can see that this stock was trading sideways between January, 2001, when it was at the $16.50 level, until January, 2002, when it peaked at the $25 level. The stock backed off again to the $16.50 level in October, 2002, and since then, has been moving steadily higher to the current $39.06 level.
So what do I think? Well, I liked the stock enough to buy some shares :). This is in an industrial area that is not well represented in my trading portfolio. I like the latest earnings report, the increased guidance, and the steady growth in revenue the past five years. Earnings have indeed been a bit erratic, but have been strong recently. Valuation is nice with a p/e is the teens to twenties, and the PEG is close to 1.5. The Price/Sales ratio is near bottom of its group, and the chart looks strong.
That's my update! Thanks again for visiting. If you have any comments or questions, please feel free to leave them on the blog or email me at bobsadviceforstocks@lycos.com.
Bob
Posted by bobsadviceforstocks at 1:59 PM CST
|
Post Comment |
Permalink
Updated: Sunday, 19 February 2006 2:54 PM CST
"Trading Transparency" Barnes Group (B)
Hello Friends! Thanks so much for stopping by and visiting my blog,
Stock Picks Bob's Advice. As always, please remember that I am an amateur investor, so please consult with your professional investment advisors prior to making any investment decisions based on information on this website.
A few moments ago I purchased 180 shares of Barnes Group (B) at $39.09/share. Barnes is having a nice day in the market today. I haven't reviewed this stock previously, so I shall try to get around to a few comments on this company this afternoon if possible.
Bob
"Trading Transparency" Morningstar (MORN)
Hello Friends! Thanks so much for stopping by and visiting my blog,
Stock Picks Bob's Advice. As always, please remember that I am an amateur investor, so please consult with your professional investment advisors prior to making any investment decisions based on information on this website.
A few moments ago, I sold 33 shares of my Morningstar (MORN) stock at $43.27/share. I had purchased 200 shares of MORN on 11/22/05 at a cost basis of $32.57, giving me a gain of $10.70/share or 32.9% appreciation since purchase. The 30% level is my first targeted appreciation level for a partial (1/6th position) sale. Since I am just at 21 positions, this also gives me a "chit" to purchase a new position if something comes up that seems to fit my strategy!
And you know that nickel is just burning a hole in my pocket already! Thanks for stopping by! If you have any comments or questions please feel free to email me at bobsadviceforstocks@lycos.com or leave your comment right here on the blog.
Bob
Wednesday, 15 February 2006
A Reader Writes "I was wondering about PMTI"
Hello Friends! Thanks so much for stopping by and visiting my blog,
Stock Picks Bob's Advice. As always, please remember that I am an amateur investor, so please remember to consult with your professional investment advisors prior to making any investment decisions based on information on this website.

My mailbox is practically humming! Just when I think it is safe to get back into the water....Anyhow, I was delighted to get a short email from Shawn who wrote:
Hi Bob:
i have been following your picks for awhile. I was wondering about PMTI. you had posted a while ago last month but the stock has been lagging lately. could you reevaluate the company.
Shawn
Shawn, thanks for writing! Please do remember I am a fellow amateur. I obtain my information from easily available free websites that I believe to be reputable and that you can access as well as I can.
Before I comment on Palomar, I want to encourage you to think critically about all of your investments. Do not get too attached to them :). I hold a stock only as long as it behaves as I want it to. If it develops an 8% loss, I sell it quickly. I have other sell points that I am sure you are familiar with.
But let me take a look at Palomar. As you pointed out, I
posted Palomar Medical Technologies (PMTI) on Stock Picks Bob's Advice on January 9, 2006, just a bit over a month ago. At that time the stock was trading at $39.05. Palomar closed today (2/15/06) at $32.35, thus it is down $(6.70) or (17.2)% since posting.
I have not been following this stock closely, but let's take a look at a chart and see when the damage was done. Here is a
one month chart on PMTI from CNN.Money.com:
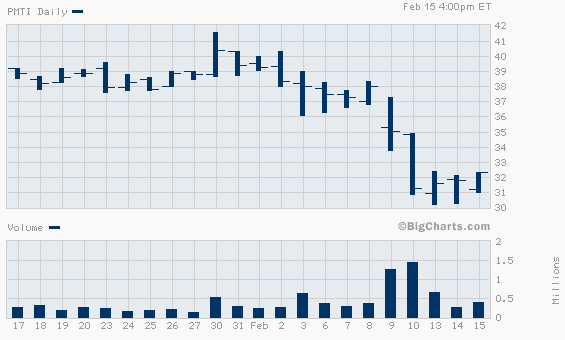
I think you can see on this chart, that while the stock was indeed drifting lower after the February 2nd close, the big drop in price came on February 9, 2006 when the stock which closed on February 8, 2006 at $38, dropped on the 9th to $35, and then down to $31.00 and change on February 10, 2006. So what happened that day to drive the stock lower?
As is often the case, on both good and bad news, we can see rather significant motion in stock prices after the release of earnings reports.
On February 9, 2006, before the opening of trading, Palomar announced 4th quarter 2005 results. While revenues for the quarter ended December 31, 2005, came in at $21.6 million, up from $16.4 million, buried in the story is this simple statement:
"The Company reported net income of $5.3 million, or $0.27 per diluted share for the fourth quarter of this year versus net income of $5.4 million, or $0.29 per diluted share, for the fourth quarter of 2004 which included a benefit from income taxes of $1.1 million due to the reduction of tax reserves."
While the revenue growth was great, I am sure that "the street" didn't like that drop in earnings, which while small, and which also had a reason, was disquieting for all of those momentum investors much like myself who are banking on persistence of revenue and earnings growth to drive a stock price higher!
I hope this answers your question. I am sure there may be other explanations for this drop, this is my best bet on an examination of the news and developments on Palomar! Thanks again for dropping by. Be sure to visit often, and let me know if you have any other questions or comments by writing me at bobsadviceforstocks@lycos.com.
Bob
A Reader Writes "I will appreciate if you can give your OPINION on how will you spend HYPOTHETICAL ten grand of your own today."
Hello Friends! Thanks so much for stopping by and visiting my blog,
Stock Picks Bob's Advice. As always, please remember that I am an amateur investor, so please remember to consult with your professional investment advisors prior to making any investment decisions based on information on this website.
I received a nice email from Imran who writes:
Dear Mr. Freeland, Good Evening, I am a resident (physician in
training), and have 10K to invest. However, I am not vary savvy when
it comes to finances. I was going to buy some index fund and leave
the money there. While surfing net, I came across your site and spent
close to three hours there. I was impressed with your indepth
analyses. I must say that I learnt a lot in those three hours about
how to look at stocks. I went to morningstar, stockcharts and other
sites first time in my life. I am still lost how to navigate your
site to look at your current stock-postions as I was going to simply
follow those positions. I understand that one should spend time to
learn financial know how, but it may take some time for me. I will
appreciate if you can give your OPINION on how will you spend
HYPOTHETICAL ten grand of your own TODAY. It will help me a lot.
Thank you very much for your time. Have a good day ad I am looking
forward your email. With kindest personal regards, I remain,
Sincerely yours, HeartDoc
East Lansing, MI
Imran, thank you for taking the time to write and taking the time to read my blog! I hope that what I introduced you to is educational and provides you with some ideas of your own on how to invest in the stock market. First of all, there is nothing wrong with an index fund either. Many mutual funds have failed to keep up with the broader indices.
Please excuse the disorganization on my blog. I write quite a bit, but haven't kept up with some of the other pages on the website. But if you go back about three or four pages, you will find an entry describing my current holdings. Also, on almost every weekend, I have been going alphabetically through my holdings reviewing one at a time, my history with the particular stock and my current plans and an update on some of the information surrounding those investments.
I am not qualified to advise you about your own specific $10,000. What I want to convey to you is my approach to identifying stocks that I believe to be good quality investment candidates. With $10,000, I would probably start with four stocks of $2,500 in each position. You might want to consider setting up a discount brokerage account online with a company like Fidelity or Schwab. Set up a regular debit from your checking or savings each month so that the account will grow. For instance, if you can deposit $250.00 regularly, then in ten months you will have enough for a fifth position. I would try to get to five positions and consider this your minimum # of positions. Go to a 6th position only if a portion of your five stocks is sold at a gain. Maybe consider going to a maximum of 20 positions. Read through my blog, I think you will understand my own strategy.
I cannot tell you which stocks to own. Be sure to sell your losing stocks quickly and your gaining stocks slowly.
Good luck and keep me posted. Let me know if you have any more specific questions on my personal approach to thinking about stocks! With a smart guy like you, this should be a cinch.
Bob
February 15, 2006 Roper Industries (ROP)
Click HERE for my ***PODCAST*** on Roper Industries (ROP).
Hello Friends! Thanks so much for stopping by and visiting my blog,
Stock Picks Bob's Advice. As always, please remember that I am an amateur investor, so please remember to consult with your professional investment advisors prior to making any investment decisions based on information on this website.

To refresh your memory, let me once again remind you that when I am looking for a new stock to discuss on this blog, I start with the top % gainers lists. Today, looking through the
top % gainers on the NYSE, I came across Roper Industries (ROP) which closed at $42.31, up $1.79 or 4.42% on the day. I do not own any shares nor do I have any options of this company.
Contributing to the bullish sentiment on this stock was
last week's announcement that 2005 earnings should be at the "high-end of forecast" which had previously been forecast at the range of $1.64 to $1.70/share.
And what exactly does Roper do? According to the
Yahoo "Profile" on Roper, the company
"...engages in the design, manufacture, and distribution of energy systems and controls, scientific and industrial imaging products and software, industrial technology products, and instrumentation products and services. It operates in five segments: Instrumentation, Industrial Technology, Energy Systems and Controls, Scientific and Industrial Imaging, and RF Technology."

And how about the latest quarterly result? On October 27, 2005, Roper Industries
reported 3rd quarter 2005 results. For the quarter ended September 30, 2005, net sales came in at $365 million, 52% higher than the $240 million reported in the same quarter a year earlier. Net earnings increased to $39.2 million from $27.4 million the prior year, and on a diluted eps basis, came in at $.45/share, up 25% from $.36/share last year during the comparable quarter.
And what about longer-term results? Looking at the
"5-Yr Restated" financials on ROP from Morningstar.com, we can see the steady growth in revenue from $.5 billion in 2000 to $1.0 billion in 2004 and $1.2 billion in the trailing twelve months (TTM). Earnings have increased a bit erratically, climbing from $.79/share in 2000 to $.89/share in 2001, then dipping to $.63/share in 2002. However, since 2002, earnings have had a steady growth to $1.24/share in 2004 and $1.42/share in the TTM.
Dividends have also been increasing steadily from $.14/share in 2000 to $.19/share in 2004 and $.20/share in the TTM.
The company has been increasing its number of shares outstanding, apparently for acquisition purposes, from 61 million in 2000 to 74 million in 2004 and 86 million in the TTM. This has not been an excessive growth in shares, with an approximately 50% increase in the float while revenue has nearly tripled and earnings doubled during the same period.
Free cash flow has been positive and growing from $79 million in 2002 to $153 million in 2004 and $183 million in the TTM.
The balance sheet, as reported by Morningstar.com looks strong with $68.4 million in cash and $458.8 million in other current assets. Balanced against current liabilities of $244.1 million, this gives us a 'current ratio' of approximately 2:1. In addition, the company does have a significant long-term debt load of $1.04 billion.
And how about some valuation numbers? Looking at the
"Key Statistics" from Yahoo on Roper, we can see that this is a large cap stock with a market capitalization of $3.63 billion. The trailing p/e isn't too bad at 28.08, with a forward p/e (fye 31-Dec-06) even nicer at 21.37. The PEG ratio works out to a nice 1.46 (under 1.50 is reasonable imho.)
And the Price/Sales ratio? According to the
Fidelity.com eResearch website, Roper is in the "Diversified Machinery" industrial group, and in fact is priced the richest in valuation relative to this parameter with a Price/Sales ratio of 2.6. Following ROP is Illinois Tool Works (ITW) with a ratio of 2.0, then Pall (PLL) with a Price/Sales ratio of 1.9. Next is Ingersoll-Rand (IR) at 1.3 and Eaton (ETN) at 1.0.

Going back to Yahoo.com for some additional numbers on this stock, Yahoo reports that there are 85.80 million shares outstanding and 83.19 million of them float. Of those that float, 1.80% are out short as of 1/10/05, representing 6.4 trading days of volume. This is significant imho, as it is greater than my own cut-off of 3 days of short interest. With the company raising guidance, she short-sellers may be starting to cover their short sales with purchases. Just a hunch.
As I noted above, the company pays a small dividend of $.24/share, yielding 0.60%. The last stock split, a 2:1 split, was on August 29, 2005.
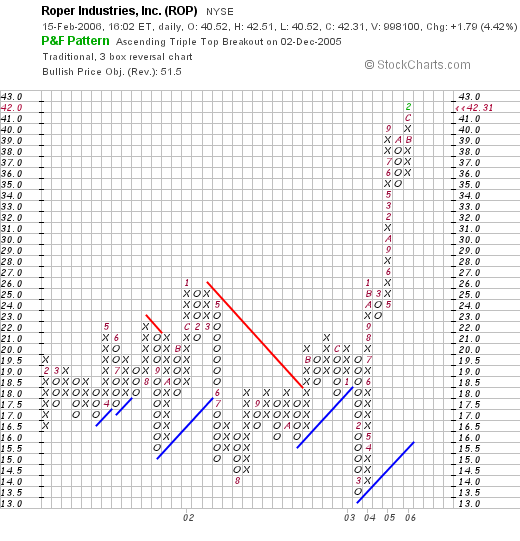
And how about a chart? Looking at the
"Point & Figure" chart on Roper Industries from Stockcharts.com, we can see that the stock was really moving sideways to lower between February, 2001, when it was trading at $19/share, to a low of $13.50 in February, 2003. The stock broke through resistance in June, 2003, at approximately $18.50, and has trading strongly higher since!
So what do I think? Well, I like this stock! That's why I wrote it up :). Seriously, the stock moved nicely higher today, they guided to the high end of estimates last week and shall be reporting the final quarter's results soon. The Morningstar numbers look nice with fairly steady revenue growth, and strong earnings growth the past few years. The company, in addition, has a small dividend, and has been steadily increasing the amount. The p/e and the PEG are nice, but the Price/Sales ratio suggests, at least within its group, a bit of a high-end valuation. Free cash flow is positive and growing and the balance sheet has a current ratio of over 2.0. There is a large amount of long-term debt however. In addition, the chart looks strong!
Anyhow, that's another stock for you to review! Thanks so much for stopping by and visiting. If you have any comments or questions, please feel free to email me at bobsadviceforstocks@lycos.com or leave your comments right in the blog.
Bob
Posted by bobsadviceforstocks at 4:07 PM CST
|
Post Comment |
Permalink
Updated: Wednesday, 15 February 2006 10:10 PM CST
A Reader Writes "I noticed that BOOM had dropped well below your purchase price...."
Hello Friends! Thanks so much for stopping by and visiting my blog,
Stock Picks Bob's Advice. As always, please remember that I am an amateur investor, so please remember to consult with your professional investment advisors prior to making any investment decisions based on information on this website.
Checking my mail/comments this morning, I saw that I had an interesting comment from Steve who had some concerns about my trading discipline. Before I answer his specific question, I would certainly like to point out that I endeavor to maintain as transparent a trading policy as possible. When I buy a stock, I post the purchase, and when I sell a stock I do the same. That being said, I do this manually, so it is always possible that I make a mistake with about 20 investments that I am following.
Steve writes:
Hi Bob,
I noticed that BOOM had dropped well below your purchase price a few days ago for a good portion of the day. Since you had already sold some shares at a profit, did you sell all of your remaining shares when it dropped below your purchase price? If not, why was this stock the exception to your rule?
Thanks,
Steve
Let me review my trading activity and my strategy in general on this stock and my other investments.
I am glad that you are keeping a close track on my trades and my blog and I am glad you took the time to write!
Currently I own 200 shares of Dynamic Materials Corp. (BOOM). These shares were acquired 12/05/05 at a cost basis per share (including commissions) of $28.32. I sold 40 shares of my original 240 share purchas (1/6th of my position) on 1/27/06 with proceeds of $1,489.00, giving me a price/share sale price of $37.23, or a gain of $8.91 or 31.4%. According to my avowed strategy :), I should be selling my remaining shares if they hit my cost or if they get down to $28.32 after a single purchase. Currently BOOM is trading at $29.78, so it is above my purchase price, but let's take a look at a chart for the past three months and see if the stock did dip below that $28.32 level. Here is a
chart from CNNMoney.com:
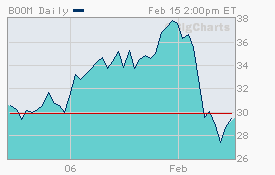
Clearly, BOOM did drop down under that $28.32 level. So you are correct. If I had a programmed sale in my portfolio the stock would be gone! So I stand corrected and you have made an excellent observation. I didn't make any exceptions to my trading rules, I just missed the price drop as I went about my business that day!
Meanwhile, BOOM is once again above my cost, so I shall not be entering a sale but if it dips back down to the $28.32 level, the stock, as long as I am paying attention :), will be gone!
Thanks so much for commenting and catching my trading error. Thus far, that sale would not have added any gains or protected me from any additional losses.
Bob
Tuesday, 14 February 2006
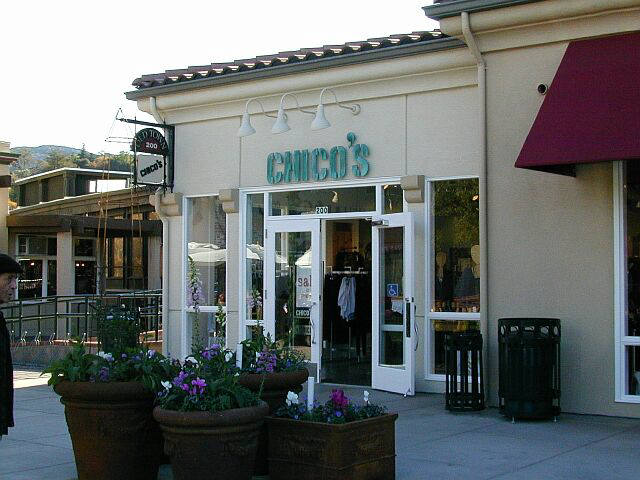
Chico's FAS (CHS) "Revisiting a Stock Pick" February 14, 2006
Hello Friends! Thanks so much for stopping by and visiting my blog,
Stock Picks Bob's Advice. As always, please remember that I am an amateur investor, so please remember to consult with your professional investment advisors prior to making any investment decisions based on information on this website.

I was looking through the
list of top % gainers on the NYSE today and came across Chico's FAS (CHS) which closed at $47.61, up $2.76 or 6.15% on the day. I do not own any shares nor do I have any options on this stock.
Chico's is an old favorite of mine on
Stock Picks. I actually first
posted Chico's on Stock Picks on July 31, 2003, when it was trading at $27.22. CHS had a 2:1 split on 2/23/05, giving me an effective "pick price" of $13.61, and thus, with CHS trading at $47.61, this represents a gain of $34.00 or 249.8% since first posting.
I like to wait at least a year before "revisiting" a stock pick. On January 6, 2005, I
revisited Chico's on Stock Picks Bob's Advice when it was trading at $48.98. Adjusted for the stock split, this second "pick" was at $24.49. Thus, even this pick, based on today's close at $47.61, had a gain of $23.12 or 94.4% since posting!

And what exactly
is Chico's? According to the
Yahoo "Profile" on Chico's, the company
"...engages in the design and retail of private label, casual-to-dressy clothing, intimates, complementary accessories, and other nonclothing gift items in the United States, the U.S. Virgin Islands, and Puerto Rico. The company offers its products under the Chico’s, White House|Black Market (WH|BM), and Soma by Chico’s brand names."
Since we are looking at a retailer, I like to review the "same store sales" reports which come out monthly for most retail stores. For the most part, any same store sales figures over 5% are imho healthy. CHS did better than this,
reporting January same-store sales up 14.6% with overall sales climbing 34.2% for the four weeks ended January 28, 2006.
And what about the latest quarterly result? On November 29, 2005, Chico's
reported 3rd quarter results. Net sales for the quarter ended October 29, 2005, increased 33% to $359 million from $270 million for the same quarter ended October 30, 2004. Net income climbed 43.5% to $53 million or $.29/diluted share compared with $37 million or $.21/diluted share last year. This was s solid report!
How about longer-term results? Chico's has a beautiful evaluation on the
"5-Yr Restated" financials from Morningstar.com. Here we can see that sales have grown steadily from $259 million in 2001 to $1.07 billion in 2005 and $1.3 billion in the trailing twelve months (TTM). Earnings have also steadily been increasing from $.17/share in 2001 to $.78/share in 2005 and $1.00/share in the TTM.
Free cash flow has also been positive and growing with $44 million in 2003, $131 million in 2005, and $166 million in the TTM.
The balance sheet as presented on Morningstar.com also looks nice with cash of $400.3 million and $140.2 million in other current assets; which, when balanced against the $151 million in current assets gives us a "current ratio" of $540/$210 or about 2.5:1. The current assets and cash easily cover the current liabilities
and the long-term liabilities totalling $62.9 million.

And how about some valuation numbers? Looking at
Yahoo "Key Statistics" on CHS, we find that this is now a large cap stock with a market capitalization of $8.62 billion. The trailing p/e is a bit rich at 47.42. However the forward p/e (fye 29-Jan-07) is a bit better at 36.07. Since such rapid growth has been reported and is expected, the PEG comes in at a reasonable 1.37.
According to the
Fidelity.com eResearch website, Chico's is in the "Apparel Stores" industrial group. In fact, Chico's tops the list in terms of price compared to sales with a ratio of 6.2. This is followed by Abercrombie & Fitch (ANF) at 2.5, American Eagle (AEOS) at 1.9, Pacific Sunwear (PSUN) at 1.4, ant Limited Brnads (LTD) at 1.0.
Going back to Yahoo for some other stats, we can see that there are 180.98 million shares outstanding and 178.08 million of them actually float. As of 1/10/06, there were 11.23 million shares out short representing 6.30% of the float or enough shares to cover a volume of 5.5 trading days at the current level of volume. This is somewhat significant and may well be contributing to the intensity of the rally higher today. Just a thought :).
As I noted above, the company does not pay a dividend and the last stock split was a 2:1 split 2/23/05.
And what about a chart? Taking a look at the
"Point & Figure" chart on CHS from Stockcharts.com:
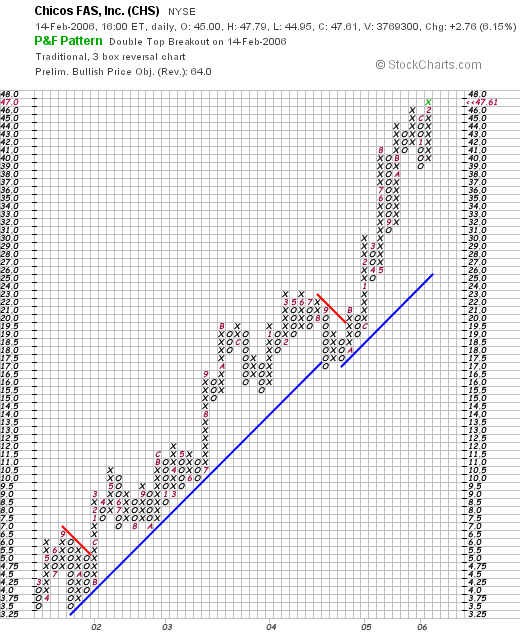
We can see an absolutely GORGEOUS chart, with the stock climbing from $3.50 level in September, 2001, to the current level at around $47.61. I don't have any prettier charts that this one on Chico's.
So what do I think? Well, as I like to say, I sure wish I had purchased some shares on either of my previous posts :(. But I didn't. The company reported strong same store sales, had a solid quarterly report, the Morningstar.com report was perfect, but valuation was a bit rich although the PEG was nice, the Price/Sales was the highest in its industrial group.
Will the stock go higher? Time will tell. Meanwhile, thanks so much for stopping by and visiting. Please feel free to email me at bobsadviceforstocks@lycos.com if you have any comments or questions. (Or leave your comments right on the blog!)
Bob
Saturday, 11 February 2006
A Reader Writes, "How do you narrow down the list for your (almost) daily selection?"
Hello Friends! Thanks so much for stopping by and visiting my blog,
Stock Picks Bob's Advice. As always, please remember that I am an amateur investor, so please remember to consult with your professional investment advisors prior to making any invesment decisions based on information on this website.
I was checking my mailbox this morning, and I saw that I had a nice letter from a regular reader of mine who raises some interesting questions. She wrote:
Hi Bob,
I'm still following your website and am amazed at how many good stocks you've selected over the years.
As I look at the top % gainers each day, I am surprised how many there are and the various reasons they are on the list that day. (stock splits, earnings, takeovers, news, rumors, announcements when earnings will be announced...)
How do you narrow down the list for your (almost) daily selection?
Thanks and as always -- keep the great blog going.
Lisa G
First of all I would like to thank you for your kind words! I often think that I have been blessed or just lucky to have fallen on to so many great stocks! I don't really think it is luck but rather a bit of homework that lands me some of these selections.
As you know, I am a big fan of the top % gainers list. I concentrate most on the NASDAQ but also look at the NYSE and the AMEX as well. Surprisingly with the long list of top % gainers there are often only one or two stocks that meet my own particular criteria. I also eliminate stocks that are much under $10, I am not a big fan of ADR's (foreign stocks trading in the US), and financial stocks.
I certainly do not write up all of the stocks I identify. Just don't have the time or energy :). In addition, I do also use a little seat of the pants approach to the stock. If I have a couple of different ones that I can "pick", then I will often gravitate to the medical stocks with the good numbers or the retail issues that show evidence of being able to expand and grow their business long-term. But I try to write up as many different kinds of stocks as possible.
For instance, I was taking a look at Tractor Supply (TSCO) the other day and didn't get around to writing it up. This company had a great quarterly report, solid Morningstar results, nice same-store sales (up 10% the prior month), and a nice chart. That is about all I need to write up a stock.
There are certain factors that are "must-haves" for me when selecting a stock, and those include the latest quarterly result, the presence of positive free cash flow, and a decent balance sheet. The chart is often the last thing I examine.
Does this answer you question? Probably not. But seriously, I will often go through virtually every single stock (over $10) on the top % gainers lists before finding a stock that meets even my basic criteria.
Is this the only way to buy stock or select stock ideas? Absolutely not. I don't even know if it is the best way, or even if it will be profitable long-term. Just something I have been doing and writing about :).
Much of my thoughts have been drawn from William O'Neill's CANSLIM theories but there are many differences as well. In any case, thanks so much for visiting. If you find a stock that you think belongs on my blog, and I haven't done anything about it, well please let me know!
Bob
"Looking Back One Year" A review of stock picks from the week of November 22, 2004

Hello Friends! Thanks so much for stopping by and visiting my blog,
Stock Picks Bob's Advice. As always, please remember that I am an amateur investor, so please remember to consult with your professional investment advisors prior to making any investment decisions based on information on this website.
One of my weekend tasks on this blog is to take a look at previous posts and see how things are working out. This review assumes a "buy and hold" approach to investing. In practice, I do
not just buy and hold stocks. I sell my holdings quickly if they develop an 8% loss, and I sell my gaining stocks slowly and partially as they hit appreciation targets. In any case, this continuing review may be helpful in determining what works and what doesn't!

On November 22, 2004, I
posted Manitowoc Co. (MTW) on Stock Picks Bob's Advice on November 22, 2004, when it was trading at $38.29/share. Manitowoc Co. closed at $69.11 on 2/10/06, for a gain of $30.82 or 80.5% since posting!

On February 1, 2006, MTW
announced 4th quarter 2005 results. For the fourth quarter ended December 31, 2005, revenue climbed 16% to $589 million. Diluted eps came in at $.47/share (excluding special items), up 34% from the same quarter last year. This was a strong report for MTW!

On November 26, 2004, I
posted RPC (RES) on Stock Picks Bob's Advice when it was trading at $27.07. RES closed at $28.21, so at first glance it appears that the stock hasn't moved much since posting. However, a closer examination reveals that the stock had a 3:2 split 3/11/05, and then another 3/2 split on 12/13/05, giving my pick price an adjusted price of $27.07 x 2/3 x 2/3 = $12.03 (!). Thus, the pick had a gain of $16.18 or 134.5% since posting. Unfortunately, I didn't buy any shares of either of these two companies :(.
On October 26, 2005, RES
reported 3rd quarter 2005 results. For the quarter ended September 30, 2005, revenues increased 30.5% to $115.8 million, compared with $88.7 milion in the same quarter the prior year. Net income for the quarter was $23.1 million or $.53/diluted share compared with $10.2 million or $.24/diluted share the prior year. This was a terrific quarter and the stock continued to climb higher!
So how did we do? Do you have to ask? I was pretty lucky that week in November, 2004, with two stock picks; MTW gaining 80.5% and RES gaining 134.5%, for an average performance of 107.5% for these two stocks on the blog since their selection.
Please remember that past performance is NO guarantee of future price performance. And that I truly am an amateur investor. Anyhow, that's the review for the week. Next week I shall try to get to the week of November 29, 2004.
Thanks again for visiting. If you have any comments or questions, please feel free to email me at bobsadviceforstocks@lycos.com or just leave your comments right on the blog!
Bob
Newer | Latest | Older


