Hello Friends! Thanks as always for stopping by my blog, Stock Picks Bob's Advice. As I always like to remind you, I am an amateur investor, so please consult with your investment advisors before making any investment decisions based on information on this website. If you have any comments or questions, please feel free to email me at bobsadviceforstocks@lycos.com .
 I came across Manitowoc Co. (MTW) this morning when it was on the list of top % gainers, but as I write it has pulled back a little and is trading at $38.29, up $.91 or 2.43% on the day. It doesn't make the cut as I write, but I like what I saw earlier and would like to share it with you! I do not own any shares or options on this company.
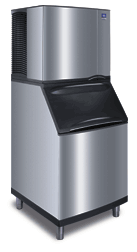
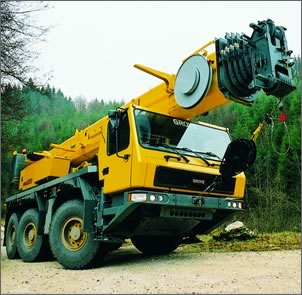
 According to the Yahoo "profile", MTW "...is a diversified industrial manufacturer with three operating segments: Cranes and Related Products, Foodservice Equipment and Marine." Personally, I have seen the name mostly on ice machines (!) but they are active in industrial ship-building and cranes as well!
On October 27, 2004, Manitowoc announced 3rd quarter 2004 results. For the quarter, sales rose 21% to $491.1 million from $407.2 million last year. They earned $12.7 million, or $.47/share, a 77% increase from the $7.2 million or $.27/share last year. As strong as this was, this was still a penny below expectations!
 How about longer-term? Taking a look at the "5-Yr Restated" financials on Morningstar.com, we can see that revenue has grown steadily, and impressively, from $680 million in 1999 to $1.8 billion in the trailing twelve months (TTM).
Earnings, however, have been erratic, dropping from $2.55/share in 1999 to a loss of $(.80)/share in 2002, but have been improving since then to $1.23/share in the trailing twelve months.
Dividends have also been erratic, increasing from $.30/share in 1999 to $.63/share in 2002, but dropping the next year down to $.28/share where it stands now.
Free cash flow has been strong at $78 million in 2001, hitting $119 million in 2003, and still at $79 million in the TTM.
The balance sheet looks adequate if not spectacultar with $49.2 million in cash, and $700.7 million in other current assets, plenty to cover the current liabilities of $603.5 million, and to start to make a small dent in the $790.7 million in long-term liabilities.
 How about valuation questions? Looking at Yahoo "Key Statistics", we find that the market cap is a mid-cap sized $1.03 Billion. The trailing p/e is a moderate 27.52, but the forward p/e is a very reasonable 14.62 (fye 31-Dec-05), giving us a PEG of 0.83, which is very reasonable imho, and a Price/Sales of 0.55...also under 1.0.
Yahoo reports 26.86 million shares outstanding with 21.90 million of them that float. Of these 957,000 shares are out short, representing 4.37% of the float, as of 10/8/04. This is lower than last months 1.27 million shares out short so about 20% of the short-sellers have thrown in the proverbial "towel" on the downward movement of this stock. The shares out short are significant representing 7.362 trading days which is also bullish for the stock (imho) if we use the 3 day rule I have started to apply.
Yahoo shows that the company still pays the small dividend of $.28 yielding .75%. The last stock split reported was a 3:2 in April, 1999.
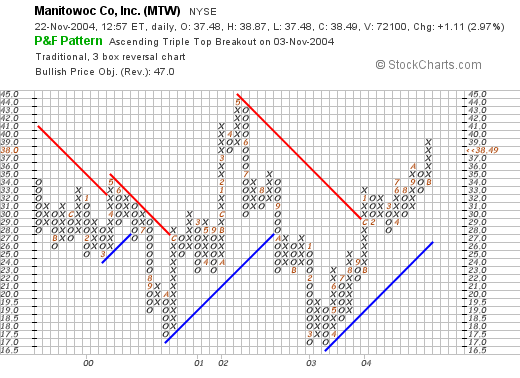
And what about "technicals"? If we take a look at a Point & Figure chart from Stockcharts.com:

We can see that the stock has really been trading sideways since 1999 when it initially declined to a low of around $17/share in October, 2000, climbed to a high of $45/share in May, 2002, then declined once again to a low of around $17 where it bottomed twice in March, 2003. Since that time the stock broke through a resistance level at around $30 in August, 2003, and has been trading higher since. The graph, in my humble opinion, looks strong, but not overpriced!
So what do I think? Well let's review, first the latest quarterly report looks strong, the five year revenue growth is excellent but the earnings and dividend record are erratic, although they look strong the last few years. Valuation is terrific with a PEG under 1.0 as is the Price/Sales. There are even a significant number of short sellers out there who need to cover their negative "bets". The graph looks nice as well. Frankly, this is my kind of stock....now if I just had a sale that would allow me to pick up some shares...but I shall be waiting to sell a portion of one of my holdings at a gain before adding a new position. I AM close with VMSI and a second sale of AMMD is not out of the question!
Thanks so much for stopping by! I hope that this discussion helps you frame some of your own investment decisions in a manner that is relatively easily understood. If you have any questions or comments, please feel free to email me at bobsadviceforstocks@lycos.com .
Bob


