Hello Friends! Thanks so much for stopping by and visiting my blog, Stock Picks Bob's Advice. As always, please remember that I am an amateur investor, so please remember to consult with your professional investment advisors prior to making any investment decisions.
 It is a bit late here and I wanted to try to get a post in before crashing for the evening. I went to the local college production of Evita tonight; that was a great musical! If you haven't gotten around to seeing that Andrew Lloyd Weber show, take it in if you get a chance wherever you may happen to be living.
 Let me try to get right to the point this evening and share with you an old favorite of mine that showed up on the list of top % gainers on the NYSE today, C R Bard, Inc. (BCR) which closed at $66.74, up $2.88 or 4.51% on the day. I do not own any shares nor do I have any options on this stock.
I say it is an "old favorite" because I have posted this stock previously on this blog. In fact, I posted BCR on Stock Picks Bob's Advice on December 19, 2004, when it was trading at $63.90/share. You can see that this stock has really gone almost nowhere since posting a bit over a year ago. Currently the stock is ahead of the post by $2.80 or 4.4% since posting (less than the % gain today alone!).
Well then, why do I still like the stock?
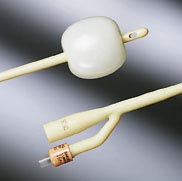
First of all, let's review what they do--according to the Yahoo "Profile" on C R Bard, the company
"...engages in the design, manufacture, packaging, distribution, and sale of medical, surgical, diagnostic, and patient care devices. It has four product groups: Vascular, Urology, Oncology, and Surgical Specialties."
 And how about the latest quarterly report?
 On January 25, 2006, Bard announced 4th quarter 2005 results. Net sales for the quarter came in at $452.0 million, a 7% increase over the prior-year period. Net income for the quarter was $80.1 million with $.75/diluted share in earnings. This was a 15% increase over the prior-year period.
How about longer-term? Reviewing the Morningstar.com "5-Yr Restated" financials on BCR, we can see the steady pattern of revenue growth from $1.1 billion in 2000 to $1.66 billion in 2004 and $1.74 billion in the trailing twelve months (TTM).
Earnings have also steadily increased from $1.05 in 2000 to $2.82 in 2004 and $3.02 in the TTM. The company also pays a dividend which has been increasing each year, from $.41/share in 2000 to $.47 in 2004 and $.49 in the TTM.
The company has not been rapidly expanding the number of shares with 101 million in 2000 and 104 million in 2004 and 105 million in the TTM.
Free cash flow has remained strongly positive with $221 million reported in 2002, $203 million in 2004 and $273 million in the TTM.
 The balance sheet, as presented by Morningstar.com looks solid to me, with $596 million in cash, enough to pay off both the $338.3 million in current liabilities and the long-term liabilities of $233.4 million combined. With the other current assets of $519.1 million, this gives BCR a 'current ratio' of approximately 3.
How about some valuation numbers?
Looking at Yahoo "Key Statistics" on C R Bard, we can see that this is a large-cap stock with a market capitalization of $7 billion. The trailing p/e is moderate at 21.38 with a forward p/e (fye 31-Dec-07) even nicer, estimated at 17.80. The estimated growth rate is sufficient to result in a PEG of 1.40 (1.5 or less is considered a good value.)
And the Price/Sales ratio? Within the industrial group of "Medical Instruments/Supplies" according to the Fidelity.com eResearch website, Bard is moderately priced. Alcon (ACL) is most expensive with a Price/Sales ratio of 8.1, followed by Guidant (GDT) at 6.9, Stryker (SYK) at 4.1, then C R Bard (BCR) at 4. Following Bard is Boston Scientific (BSX) with a Price/Sales ratio of 3.1, and last in the group is Baxter (BAX) with a ratio of 2.4.
 Going back to Yahoo for a few more statistics, we find that there are 104.87 million shares outstanding with 104.23 million of them that float. Of these, 1.17 million shares are out short as of 1/10/06. This represents 1.10% of the float or 1.7 trading days of volume. This doesn't look very significant to me.
The company does pay an estimated $.52/share yielding 0.8% on the stock price. The last stock split was a 2:1 split in June, 2004.
And what about the chart?
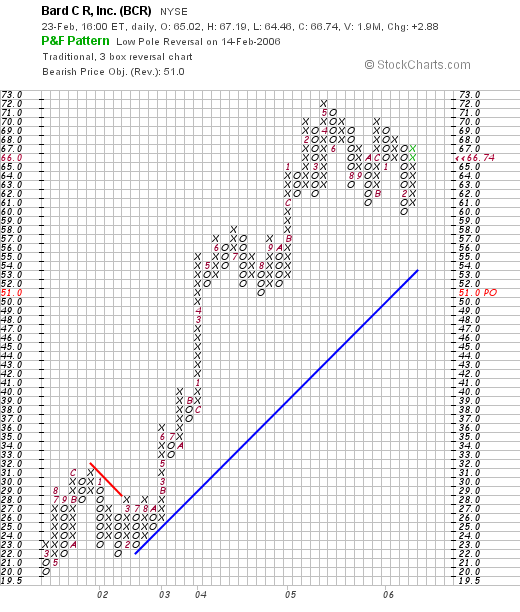
If we review the "Point & Figure" chart on BCR from StockCharts.com:

We can see that the stock has moved strongly higher since January, 2002, when it was trading at $22/share. The stock peaked at $72 in May, 2005, and has been moving sideways since. The stock price appears to have consolidated well during much of 2005 and 2006.
So what do I think? I like this stock for its consistent revenue and earnings growth, reasonable valuation, solid free cash flow, a very nice balance sheet, an a chart that looks encouraging.
Anyhow, it is very late and I am fading quickly! So have a great night and a great day tomorrow! Be sure to drop me a line at bobsadviceforstocks@lycos.com if you have any comments or questions and please feel free to leave messages on my blog!
Bob


