


Hello Friends! Thanks so much for stopping by and visiting my blog, Stock Picks Bob's Advice. As always, please remember that I am an amateur investor, so please consult with your professional investment advisors prior to making any investment decisions based on information on this website.
 What I like to do on this blog is to pick stocks :). There really isn't very much "magic" about my thinking process; I just use an approach involving looking at stocks making nice percentage gains and then examining their fundamentals.
This evening, while looking at the list of top % gainers on the NASDAQ, I came across Raven Industries (RAVN). I do not own any shares of this company nor do I own any options.
 RAVN had a nice day today, closing at $24.12 on the day, up $2.36 or 10.85%. According to the Yahoo "Profile" on Raven, the company "...operates as an industrial manufacturer in North America. The company operates in three divisions: Flow Controls, Engineered Films, and Electronic Systems."
What drove the stock higher today was the announcement of 2nd quarter 2005 earnings. For the quarter ended July 31, 2005, sales rose 22% to $45.3 million from $37.1 million for the same quarter last year, and net income climbed 31% to $4.8 million or $.26/share, up from $3.6 million or $.20/share the prior year same quarter. This was ahead of forecast beating expectations by a penny and was enough to push the stock price higher!
 Looking longer-term at the Morningstar.com "5-Yr Restated" financials, we can see that revenue did dip from $132.9 million in 2001 to $118.5 million in 2002, but has steadily increased since then to $180.4 million in the trailing twelve months (TTM).
Earnings, which increased from $.62/share in 2001, jumped to $.93/share in 2002 before dropping to $.60/share in 2003. Since then earnings have grown steadily to $1.07 in the TTM.
Free cash flow while a bit inconsistent has stayed positive increasing slightly from $7 million in 2003 to $8 million in the TTM.
The balance sheet, as reported by Morningstar.com, looks solid with $4.1 million in cash and $56.4 million in other current assets, plenty to cover both the $18.5 million in current liabilities and the $1.4 million in long-term liabilities combined three times over.
What about other "Key Statistics"? Looking in Yahoo for this, we can see that RAVN is a small mid-cap stock with a market capitalization of $435.41 million. (In some lists, this size would be considered small cap!). The trailing p/e is reasonable at 22.58 with a forward p/e (fye 31-Jan-07) even nicer at 16.52. The "5 yr expected" PEG is only 1.05.
 In terms of the price/sales ratio, looking at other stocks in the "Printed Circuit Boards" industrial group, per Fidelity.com, we see that RAVN with a price/sales ratio of 2.2 leads the group with the other stocks lower. Jabil Circuit (JBL) comes in at 0.8, Flextronics (FLEX) at 0.5, Solectron (SLR) at 0.4, Celestics (CLS) at 0.3, and Sanmina (SANM) at 0.2. Thus, in this particular parameter, Raven actually comes in pricey!
Other information on Yahoo shows Raven with 18.05 million shares outstanding with 15.80 million of them that float. Currently there are 530,000 shares out short (as of 7/12/05), representing 3.30% of the float or 4.6 trading days. Being above 3 days, this looks like it may be a factor imho.
The company does pay a small dividend of $.22/share yielding 1.02%. The last stock split was a 2:1 split on October 18, 2004.
What about a chart? Looking at a "Point & Figure" Chart on Raven from Stockcharts.com:
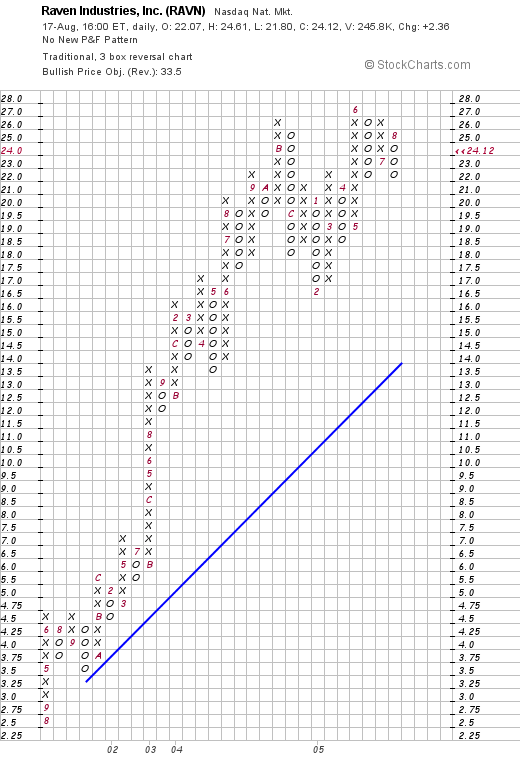
We can see what appears to me to be a rather gorgeous graph with a strong upward move from $2.50/share in August 2001 to the current close of $24.12. The graph looks nice if not a tad over-extended.
So what do I think? Well, let's review: the stock made a nice move higher today in a bit of a sloppy market on what appears to be a great earnings report that did beat expectations. The company has been growing steadily for at least the last several years, is generating growing free cash flow, has a solid balance sheet and is valued reasonably with a PEG just over 1.0. The Price/Sales figure is a bit rich for the group it is in but otherwise valuation seems fine. In addition the company pays a small dividend and has a chart that would be tough to beat :). So I like it. Even though it is a bit small!
Anyhow, I don't have any money right now to buy any stocks; although I am close, and could possibly add a 25th position if I can generate a sale on a gain. In fact, my Joseph Bank (JOSB) is trading fairly weakly on anemic same store sales growth of 0.5%. The jury is still out on that one!
Thanks so much for stopping by! If you have any comments or questions, please feel free to email me at bobsadviceforstocks@lycos.com or just leave a message right on the blog!
Bob