


Hello Friends! Thanks so much for stopping by and visiting my blog, Stock Picks Bob's Advice. As always, please remember that I am an amateur investor, so please remember to consult with your professional investment advisors prior to making any investment decisions based on information on this website.
 Looking through the list of top % gainers on the NYSE today, I came across an old "favorite" of mine, Cantel Medical (CMN) which I have owned in the past, but no longer have any shares or options, and have also posted this stock previously on Stock Picks (3/2/04). Cantel is having a nice day today, trading, as I write, at $22.37, up $2.61 or 13.21% on the day.
 When I posted Cantel on this blog on 3/2/04, the stock was trading at $18.40. Since the stock underwent a 3:2 stock split on 1/13/05, the effective pick price for the blog was actually $12.27, so we actually have an appreciation in stock price of $10.10 or 82.3% on this stock pick since originally listing it early last year! I purchased shares of CMN in 6/04, and sold my remaining shares on 6/05 after the stock pulled back to a selling position. (retracing 50% of the greatest percentage gain that I had 'experienced'.)
According to the Yahoo "Profile" on CMN, the company "...through its wholly owned subsidiaries, provides infection prevention and control products, and technical maintenance services internationally. The company designs, develops, markets, and distributes disinfection and sterilization reprocessing systems, sterilants, and other supplies. The company also markets and distributes medical equipment, scientific instruments, and industrial equipment."
 What drove the stock higher today, was the release of earnings. Cantel reported 4th quarter 2005 results just prior to the opening of trading this morning. For the quarter ended July 31, 2005, sales came in at $52.0 million, a 15% increase over sales of $45.2 million the prior year same period. Net income came ina $4.7 million, up 48% from net income of $3.2 million last year. On a diluted per share basis this worked out to $.29/diluted share, up 45% from $.20/diluted share last year. All-in-all a solid report, and the street responded accordingly!
How about longer-term? What does the Morningstar.com report look like? Well, looking at the Morningstar.com "5-Yr Restated" financials, we can see a beautiful progression of revenue growth from $41.3 million in 2000 to $190.6 million in the trailing twelve months (TTM). During this period, earnings have grown steadily from $.28/share in 2000 to $.88/share in the TTM.
Free cash flow has also been steadily increasing from $10 million in 2002 to $20 million in the TTM.
The balance sheet is solid with $24.7 million in cash and $59.5 million in other current assets, as opposed to the $28.5 million in current liabilities and the $25.4 million in long-term liabilities.
 Looking at Yahoo "Key Statistics" for some valuation numbers, we find that the company is a small cap stock with a market capitalization of only $331.86 million.
The trailing p/e is moderate at 25.49 and the forward p/e (fye 31-Jul 06) is nicer at 20.35. The PEG is a bit over 1.0 at 1.16 so valuation isn't bad.
Using Fidelity.com eresearch, we can see that Cantel is downright cheap in the industrial group of "Medical Instruments/Supplies". Leading this group in price/sales ratio is Alcon (ACL) at 9.6, Guidant (GDT) at 6.1, Stryker (SYK) at 4.4, Boston Scientific (BSX) at 3.1, and Baxter (BAX) at 2.5. Cantel 'brings up the rear' at a price/sales ratio of only 1.7.
Looking back at Yahoo, we find that there are only 14.96 million shares outstanding. Currently (7/12/05) there are 684,970 shares out short representing 5.80% of the float or 3 trading days. This doesn't look too significant to me.
There are no cash dividends, and as I mentioned above, the company last split 3:2 on 1/13/05.
What about the chart? Taking a look at the "Point & Figure" chart on CMN from Stockcharts.com:
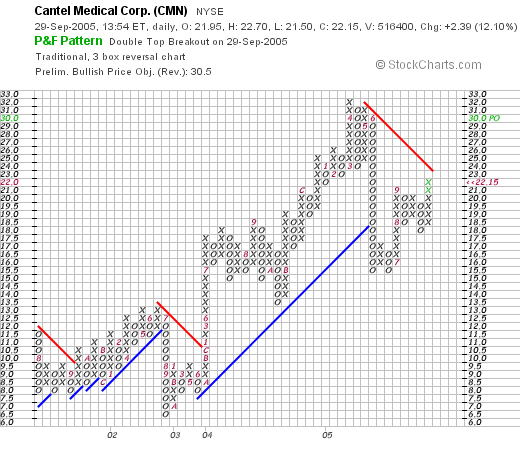
We can see that the stock has had a bit of a volatile move higher. The stock broke down once in June, 2002, when it dropped from $13 down to $6.50, and then resumed climbing higher. I got "shaken out" of the stock in June, 2005, when the stock plummeted from $32 down to $15 level. The stock consolidated, started moving higher, and is poised to break through resistance at $23. The chart looks fine to me. Not overwhelming in strength but I am sold!
So what do I think? Well, this company appears to be back on track after a gross over-reaction to a penny miss on earnings earlier this year. The last quarterly report (issued today) was superb, the Morningstar.com analysis looks fantastic with steady revenue and earnings growth, increasing free cash flow, and a solid balance sheet. To top this off, the p/e isn't bad in the mid 20's (imho), with a PEG just over 1.0. The price/sales is also a nice indicator suggesting the stock is reasonably priced within its industrial group! Now, if I just needed a new position :). Oh well, still sitting on my hands for now!
If you have any comments, or questions, please feel free to leave them right on the blog, or email me at bobsadviceforstocks@lycos.com. Happy trading everyone!
Bob