Hello Friends! Thanks so much for stopping by and visiting my blog, Stock Picks Bob's Advice! As always, please remember that I am an amateur investor, so please remember to consult with your professional investment advisers prior to making any investment decisions based on information on this website.
I am now getting well into my fifth year of blogging here on Stock Picks. There are many entries and I am sure many of you find it difficult to find entries on the website. I know that I do. In fact, when looking for whether I have reviewed stocks, I often need to Google myself! Don't laugh, it works.
This past year I have been trying to dig way back into the early days of this website to find out how those early picks turned out. As I like to point out, these reviews also depend on a buy and hold strategy. In practice, I advocate and employ a very different strategy of closely monitoring the actual stocks in my own portfolio, selling the losing stocks quickly and completely and selling gaining issues slowly and partially. Much of my success or failure long-term will depend on this strategy. But for this review, I assume a buy-and-hold approach to these investments.
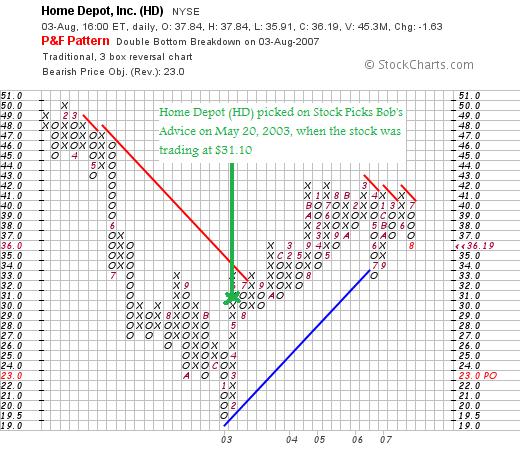
My last 'long-term' review was on July 8, 2007, when I reviewed my May 19, 2003 write-up of Bradley Pharmaceuticals. Let's take a closer look at Home Depot (HD) which I wrote up on May 20, 2003:
"May 20, 2003
Home Depot (HD)
Thanks for stopping by. Taking a look first at the NYSE biggest advancers we find Home Depot near the top. We find HD trading currently at $31.10, up $3.03 or 10.79%. I have to confess to some bias in reviewing these charts and let me explain. I have found that the larger cap issues overall tend to perform better with this technique and also stocks over $10. If I can find issues on the NYSE, stocks even like Dell or Krispy Kreme, then I will go with them....many of the smaller issues I have been "shaken out" as they say in the business because a company trading at $4.00 a share, needs to go down only $.32 to reach the 8% stop.
Back to Home Depot. This is a long time growth stock favorite. Recently, it has sold off with relatively slower growth, presumably due to stiff competition with Lowes among other retail outfits.
Last quarter, just reported today (!), sales increased to $15.1 billion from 14.2 billion. However same store sales dropped 1.6% (a negative) although EXPECTATIONS were for a 2-4% drop in same store sales. what is important here is what the 'street' was expecting and HD outperformed.
Looking at Morningstar we find that sales have grown from $24.2 billion in 1998 to $30.2 billion in 1999, $38.4 billion in 2000, $45.7 billion in 2001, and $53.6 billion in 2002. Extrapolating out the first quarter...which is probably unreasonable due to somewhat seasonality of retail business, we can see a near $60 billion rate for the year 2003.
The cash flow of this company has really turned around as well from a -762 million in 2001 to a positive 2.57 billion in 2002 and the TTM as Morningstar says...is $3.6 billion in positive cash flow (TTM is 'trailing twelve months').
Anyhow, the issue is not perfect....but at a p/e of 17.9, this issue is ripe for the picking. Good luck and remember to hold to the 8% stop loss. I do own some shares of this stock among my different accounts...as do members of my family. Bob"
 Home Depot (HD) closed at $36.19 on August 3, 2007, for a gain of $5.09 or 16.4% since posting.
On May 15, 2007, Home Depot announced 1st quarter 2007 results. Net earnings came in at $1.0 billion or $.53/diluted share, down from $1.5 billion or $.70/diluted share the year earlier same period. Sales for the quarter came in at $21.6 billion, up 0.6% from the prior year same period. More telling, however, was the figure on 'same-store sales' which showed a (7.6)% decline year over year.
Reviewing the Morningstar.com "5-Yr Restated" financials, we can see the recent dip in revenue, earnings dipped from 2005 steadily to 2007 and are up in the trailing twelve months. Free cash flow is nicely positive and the balance sheet is adequate.
Looking at the "Point and Figure" chart on Home Depot from StockCharts.com, we can see the dip in 2003, the recovery in March, 2006, and the apparent resistance to upward price moves. Overall, the chart is less than exciting.