Hello Friends! Thanks so much for stopping by and visiting my blog, Stock Picks Bob's Advice. As always, please remember that I am an amateur investor, so please remember to consult with your professional investment advisors prior to making any investment decisions based on information on this website.
 The market appears to be taking a pause after yesterday's euphoric rise! However, that doesn't mean we can't keep looking for those stocks we like to discuss on this website. Reviewing the list of top % gainers on the NYSE today, I came across NS Group (NSS), which as I write is trading at $47.09, up $1.77 or 3.91% on the day. I do not own any shares nor any options on this stock.
 According to the Yahoo "Profile" on NS Group, the company
"...engages in the manufacture and supply of the tubular products to the energy market in North America. The company’s energy related products include seamless and welded tubular products, such as drill pipe, casing, and production tubing used in oil and natural gas drilling and production operations."Let's take a closer look at this stock.
First, the latest quarterly earnings report.
NSS reported 4th quarter 2005 results on February 14, 2006. For the quarter ended December 31, 2005, net sales came in at $154.2 million, a 10% increase over the $140.0 million reported in the same quarter the prior year. Net income was up nicely at $39.8 million or $1.76/share, from $30.8 million or $1.35/share the same quarter last year. According to this report, the company beat expectations of $1.67 on the net income, but the revenue came in a bit under expectations of $158.3 million.
 How about longer-term results?
Reviewing the Morningstar.com "5-Yr Restated' financials on NSS, we can see that revenue actually dropped from $315.5 million in 2001 to a low of $192.4 million in 2002. Since then, revenue has climbed steadily and strongly to $600.9 million in 2005.
Earnings have improved steadily since 2001 when the company posted a loss of $(2.68)/share to a profit of $3.45/share in 2004 and $5.62/share in 2005.
No dividends are paid and the shares outstanding is readily constant with 21 million shares reported in 2001, increasing to 22 million in 2005.
Free cahs flow which was negative at $(15) million in 2003, turned positive at $25 million in 2004 and $111 million in 2005.
The balance sheet is quite solid with $145.1 million in cash and $93.4 million in current liabilities. Including the $215.7 million in other current assets, this gives us a current ratio of over 3.5. In fact, the company has enough cash to pay off the combined $106 million in current and long-term liabilities with another $40 million in cash left over!
 And what about some valuation numbers?
 Reviewing Yahoo "Key Statistics" on NS Group, we find that the market cap is a mid-cap size $1.06 billion. The trailing p/e is a downright cheap 8.40 with a forward p/e of 7.43. No PEG is rreported.
According to the Fidelity.com eResearch website, this company is in the "Steel & Iron" industrial group and is moderately priced relative to its Price/Sales ratio of 1.7. Topping this group is Precision Castparts (PCP) at 2.4, followed by NSS at 1.7, and Allegheny Technologies (ATI) at 1.7. Steel Dynamics (STLD) comes in at 1.4 and Nucor (NUE) at 1.3. At the bottom of the group is Gibraltar Industries (ROCK) with a Price/Sales ratio of 0.7.
Going back to Yahoo for a few more numbers, we find that there are 22.42 million shares outstanding with only 20.20 million that float. Currently (3/10/06) there are 1.81 million shares out short which represents 8.10% of the float or 4 trading days of volume (the short ratio). Exceeding my 3 day rule for the short ratio, this is of some significance imho.
No cash dividend is reported, and no stock splits are noted on Yahoo either.
What about a chart?
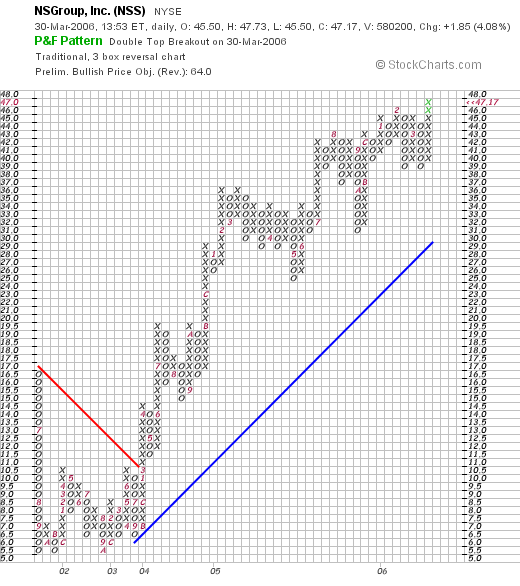
Looking at the "Point & Figure" chart on NSS from StockCharts.com:

We can see that the company traded lower from $17 to a low of $5.50 in October, 2002. The company's stock price then moved higher, breaking through resistance in March, 2003, at the $10.50 level, and has subsequently been steadily moving towards the current level of approximately $47/share. The chart looks nice to me.
So what do I think? Well this is another oil-related company on the move. They have several years of steady growth, the latest quarterly result appears solid, free cash flow is positive and growing, the number of shares is stable, the balance sheet is beautiful, valuation is nice with a p/e under 10, and the Price/Sales is satisfactory. I don't have a PEG to evaluate, but it sure looks like it would be well under 1.0. Finally, the chart is solid. What is there not to like? I suppose if the oil market collapsed, this stock would go down with it, but what do you think the chances are for that?
Anyhow, thanks so much for stopping by and visiting. If you have any comments or questions, please feel free to leave them on the blog or email me at bobsadviceforstocks@lycos.com.
Bob


