


Hello Friends! Thanks so much for stopping by and visiting my blog, Stock Picks Bob's Advice. As always, please remember that I am an amateur investor, so please remember to consult with your professional investment advisors prior to making any investment decisions based on information on this website.
 This afternoon, while looking through the list of top % gainers on the NYSE, I came across Phillips-Van Heusen (PVH) which as I write is trading at $38.51, up $3.26 or 9.25% on the day. I do not own any shares nor do I have any options on this stock.
 According to the Yahoo "Profile" on Phillips-Van Heusen, the company
"...operates as an apparel company worldwide. The company designs and markets branded dress shirts, sportswear, footwear, and other related products, as well as licenses its brands for an assortment of products. Its sportswear products include men's knit and woven sport shirts, sweaters, bottoms, swimwear, boxers, and outerwear. The company’s footwear products include casual and dress casual shoes for men, women, and children, and apparel and accessories, such as handbags, belts, and travel gear, for men and women. The company’s licensed brands comprise Geoffrey Beene, Kenneth Cole New York, Reaction Kenneth Cole, BCBG Max Azria, BCBG Attitude, MICHAEL Michael Kors, Chaps, Sean John and, Donald J. Trump Signature Collection."What drove the stock higher today was the announcement of 4th quarter 2005 results after the close of trading yesterday. For the quarter ended January 29, 2006, revenues increased 11% to $460.1 million from $413.8 million in the prior year same period. Net income worked out to $22.9 million or $.41/share, which exceeded previous guidance by $.04/share. This was a 32% increase over the prior year's net income of $17.3 million or $.33/share. In addition, the raised guidance for 2006. In my book this is a 4/4 earnings report with: increased earnings, increased revenues, exceeding of guidance, and raising of guidance, all in the same report.
 How about longer-term results?
 Taking a look at the Morningstar.com "5-Yr Restated" financials, we can see that the company was fairly stagnant between 2001 and 2003 when revenue slipped from $1.46 billion to $1.41 billion. Earnings also dropped from $1.10/share to $1.08/share in 2003 and $(.18)/share in 2004. However, since 2003, revenue has grown steadily and substantially to $1.86 billion, and earnings have improved from the loss in 2004 to $1.14/share in 2005 and $1.79 in the trailing twelve months (TTM).
Since 2001, the company has also paid a dividend, paying $.15/share each year. The company has been expanding its number of shares, a development that we should pay attention to, increasing from 27 million shares in 2001 to 31 million in 2005 and 42 million in the trailing twelve months.
Another big plus on this report is the free cash flow which although dropping from $76 million in 2003 to $24 million in 2004 has since increased strongly to $96 million in 2005 and $149 million in the TTM.
 Looking at the balance sheet on Morningstar.com, we can see that the company is reported to have $170.3 million in cash and $473.5 million in other current assets for a total of approximately $614 million. Compared to the current liabilities of $217 million, this works out to a 'current ratio' of almost 3. The company also has an additional $943.1 million in Long-Term liabilities.
 What about some valuation numbers on this stock?
Reviewing the Yahoo "Key Statistics" on Phillips-Van Heusen, we can see that this is a mid-cap stock with a market capitalization of $1.63 billion. The trailing p/e is a reasonable 23.80 with a forward p/e (fye 30-Jan-07) of 17.78. The PEG works out to 0.95.
Examining the Fidelity.com eResearch website, we can see that this company is in the "Textile-Apparel Clothing" industrial group. Topping the group relative to the Price/Sales ratio is BEBE Stores (BEBE) with a ratio of 3, followed by Columbia Sportswear (COLM) at 1.8, then Phillips-Van Heusen (PVH) and VF Corp (VFC) at 1.0, and Hot Topic (HOTT) at 0.9, and Quiksilver (ZQK) at 0.9. Thus valuation by this parameter looks pretty reasonable as well.
Finishing up with Yahoo we find that there are 42.33 million shares outstanding with 36.52 million that float. Of these, 1.82 million shares are out short representing 5.2 trading days of average volume (the short ratio). Thus, with an announcement of good news today, and a sharp move higher, one can only speculate about a 'squeeze' of the shorts resulting in additional buying pressures.
As noted above, the company does pay a small dividend of $.15/share yielding 0.40%. The last stock split reported on Yahoo was more than 14 years ago when the stock split 2:1 in October, 1991.
What about a chart?
Looking at a "Point & Figure" chart on Phillips-Van Heusen (PVH) from StockCharts.com:
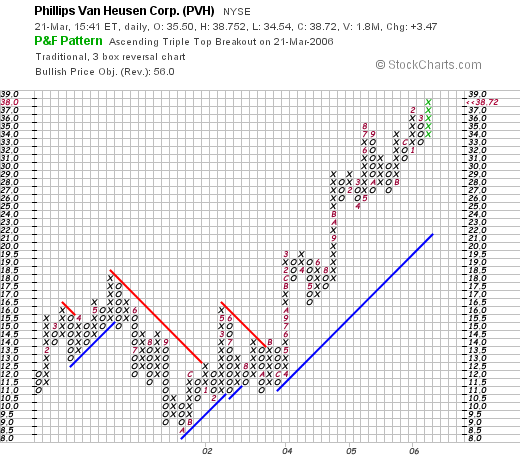
We can see that this stock also floundered in price between January, 2001, when the stock was at $11.00/share, until October, 2001, when the stock bottomed at $8.50. Since then, the stock has been climbing fairly steadily, breaking through resistance in October, 2003, at $13, and steadily moving to the current level at $38.72 today. The chart looks nice to me.
So what do I think? Well, I like this stock. The earnings report was solid, fulfilling the four things I like to see in a report: increase earnings, increased revenues, the exceeding of guidance in the quarter and the raising of guidance going forward.
The Morningstar.com report, while not perfect, shows a very nice improvement in results the past few years. Free cash flow is solid and growing. The company pays a small dividend, and valuation is nice with a PEG under 1.0, and a Price/Sales at 1.0 which was on the lower end of its group. In addition, the chart looks nice.
On a negative note, the company is issuing new shares and has a bit of a significant long-term debt. However, this appears to be related to acquisitions which appear to be managed successfully.
Now, if only I had the permission to be buying a new stock! Thanks so much for stopping by! If you have any comments or questions, please feel free to leave them on the blog or email me at bobsadviceforstocks@lycos.com.
Bob