Stock Picks Bob's Advice
Tuesday, 20 February 2007
A Reader Writes "IRIS...I was wondering...."
Hello Friends! Thanks so much for stopping by and visiting my blog, Stock Picks Bob's Advice! As always, please remember that I am an amateur investor, so please remember to consult with your professional investment advisors prior to making any investment decisions based on information on this website.
I always enjoy receiving email from readers and commenting on stocks. I cannot predict whether stocks will rise or fall in the future. I also do not have any inside information as to what a company will be reporting in the future. Stock prices usually rise when a company exceeds expectations and prices often drop when companies fail to meet those same financial expectations.
Also, when you do email me at bobsadviceforstocks@lycos.com, and I look forward to your emails, please be aware that I am likely to write up your question/comment so that I may respond in a transparent fashion and also so that other readers who may have a similar question, may take advantage of our discussion.
 With all of that in mind, I was glad to receive an email today from Mike P. who wrote:
"Hello Bob
I purchased myself a bunch of Iris stock right around
the 11.70 level. I was wondering what your outlook is
for the company prior to the March 7th financial
report.
Thanks
-Mike"
So first of all, thanks for writing Mike. From what Mike writes, I assume he is long Iris at the $11.70 level. Coincidentally, IRIS is trading at $11.70, down $(.03) on the day as I write.
As you probably know, I first covered IRIS back on October 4, 2005, on Stock Picks Bob's Advice when it was trading at $20.97. So this particular stock is considerably below the price where I wrote it up.
In general, my assessment of a stock includes whether a company has had a good recent quarter, whether longer-term results is consistent, and if the chart looks nice. If a company has had a 'down quarter' as the latest report, I don't look further. This doesn't mean that the stock isn't likely to move higher. Furthermore, as even my own post on Iris back in 2005 demonstrates, the fact that a company meets my own criteria doesn't mean that the stock price will necessarily rise. This is just something that I have found useful.
As you note, Iris has announced that they will be releasing 4th quarter results on March 7, 2007. If the company is able to meet or exceed expectations, the stock price may well appreciate. But that would be anyone's guess I suppose. I am not prepared to guess.
So I am stuck looking at the 3rd quarter 2006 results, which while a bit hard to locate, are found right on the company website.
The company reported:
"CHATSWORTH, Calif., Nov. 14, 2006 — IRIS International, Inc. (NASDAQ: IRIS) today announced revenue of $18.0 million for the third quarter ended September 30, 2006, a 13% increase over revenue of $16.0 million in the third quarter of 2005.
Net income for the third quarter of 2006 was $0.8 million or $0.04 per diluted share after the effect of reserves, increased professional fees and inventory adjustments totaling $1.1 million or $0.04 per share. Third quarter 2006 earnings reflect additional reserves taken for sales return allowances, increased warranty reserves for iQ®200, physical inventory losses of service parts, increased inventory reserves and additional accrual for increased professional fees associated with compliance with Sarbanes Oxley Section 404."
Well that is all well and good. But the earnings of $.8 million or $.04/diluted share, regardless of whatever accounting requirements are explained, is below the net income of $1.5 million or $.09/diluted share reported in the same period the prior year. So I am unable to say that this stock meets my requirements. But I am also unable to tell you which direction the stock price is likely to move in the future. Since you are a holder of the stock, I hope the stock price appreciates and you make a ton of money.
I hope that this is helpful for you. I do not mean to be discouraging, but as I said in the prior entry, I try very hard to be honest and consistent as well as transparent in everything I write about here on this website. I do not own any shares in IRIS nor do I have any options.
If you have any comments or questions you would like me to address, please feel free to leave your comments on the blog or email me at bobsadviceforstocks@lycos.com. If you get a chance, be sure and visit my Stock Picks Podcast Website, where you can get a chance to listen to me talk about some of the many stocks I write about here!
Bob
Posted by bobsadviceforstocks at 1:43 PM CST
|
Post Comment |
Permalink
Updated: Tuesday, 20 February 2007 1:45 PM CST
Monday, 19 February 2007
A Reader Writes: "SGMS. Care to revisit?"
Hello Friends! Thanks so much for stopping by and visiting my blog, Stock Picks Bob's Advice! As always, please remember that I am an amateur investor, so please remember to consult with your professional investment advisors prior to making any investment decisions based on information on this website.
One of the favorite things about writing a blog is to receive comments and emails from all of you readers. I cannot promise to always provide you with the answer you are looking for, but I shall try to provide you with as honest a response as I am able.
I had a nice email yesterday from Anthony G. who wrote:
"Bob
I have been reading your articles on this for a couple years now...
Care to revisit? I'm bullish on it going higher and wanted to know what your views were.
Thanks and I appreciate your feedback you've shared on the web!
Anthony"
First of all, thank you so much for writing! There really are two parts to your question, 'do I agree with you that we should be bullish on this stock', and 'would I care to revisit Scientific Games' on the blog'?
For the first question, I do not have any opinion on whether Scientific Games goes higher or not. Apparently you own some shares, so I shall be rooting for you and your stock purchase that you make a lot of money. There are indeed a lot of nice things about SGMS that could lead to the price moving higher.
Next, would I revisit this stock. In general I like to wait a full year after discussing any stock that I have reviewed previously.
I first posted Scientific Games on Stock Picks on September 12, 2003 when the stock was trading at $11.55. I then "revisited" the stock on January 14, 2005, when the stock was trading at $25.87. The stock closed at $34.14 on February 16, 2007, so the initial pick and the second pick were both good calls and the stock has appreciated significantly since being mentioned here on the blog. I do not own any shares or options on this stock.
But this begs the question. The real issue is whether the stock still meets my criteria for inclusion; not whether there is a possibility that the stock appreciates strongly from here.
One of my requirements for a company to be posted is whether the latest quarter shows increasing earnings as well as revenue compared to the year earlier period. It is rather an arbitrary and rigid approach to picking stocks but it is what I do.
On November 2, 2006, SGMS reported 3rd quarter results. As reported:
"NEW YORK, Nov. 2 /PRNewswire-FirstCall/ -- Scientific Games Corporation (Nasdaq: SGMS) today reported third quarter 2006 revenues of $217.4 million, up 10 percent from $196.8 million in the third quarter of 2005. Net income was $11.5 million or $0.12 per diluted share, net of $4.6 million of stock compensation expense and $10.2 million of pari-mutuel asset impairment charges, down from $19.2 million or $0.21 per diluted share in the third quarter of 2005. Non-GAAP adjusted net income before stock compensation expense and asset impairment charges for the third quarter of 2006 was $22.8 million or $0.24 per diluted share, compared to non-GAAP adjusted net income of $24.9 million or $0.27 per diluted share for the third quarter of 2005."
You can see from the above report, that while revenue did climb 10% to $217.4 million from $196.8 million, net income declined to $.12/share vs. $.21/share in the year earlier period. Even by using non-GAAP adjusted results we have $.24/diluted share vs. $.27/diluted share the prior year. Either way we cut it, earnings declined year-over-year. For now, this precludes an 'endorsement' of the stock from me. However, if the company returns to growth, and the next quarter should be reported soon, that would certainly change my outlook.
I hope this answers your question. Thanks so much for writing and reading my blog. If you or anyone else have any questions or comments, please feel free to reach me on the blog or email me at bobsadviceforstocks@lycos.com. If you get a chance, be sure you stop by and visit my Stock Picks Podcast website.
Bob
Saturday, 17 February 2007
Precision Castparts (PCP) "Weekend Trading Portfolio Analysis"

Hello Friends! Thanks so much for stopping by and visiting my blog, Stock Picks Bob's Advice! As always, please remember that I am an amateur investor, so please remember to consult with your professional investment advisers prior to making any investment decision based on information on this website.
I try to accomplish a lot of different objectives on this blog simultaneously. Since 2003, I have been writing up stocks that I believe meet my criteria for investment, I have been discussing different ways of managing your portfolio, and have also shared with all of you readers my actual trading portfolio; letting you know what I own, when I buy shares, and when I sell them. As part of this "transparency" I have been trying to review my actual trading portfolio going through a different position every two or three weeks going alphabetically through the list. Currently, I am up to 15 positions (below my maximum of 25 and above my minimum of 6). Three weeks ago I reviewed my Morningstar position and going alphabetically, I am up to my Precision Castparts (PCP) holding.
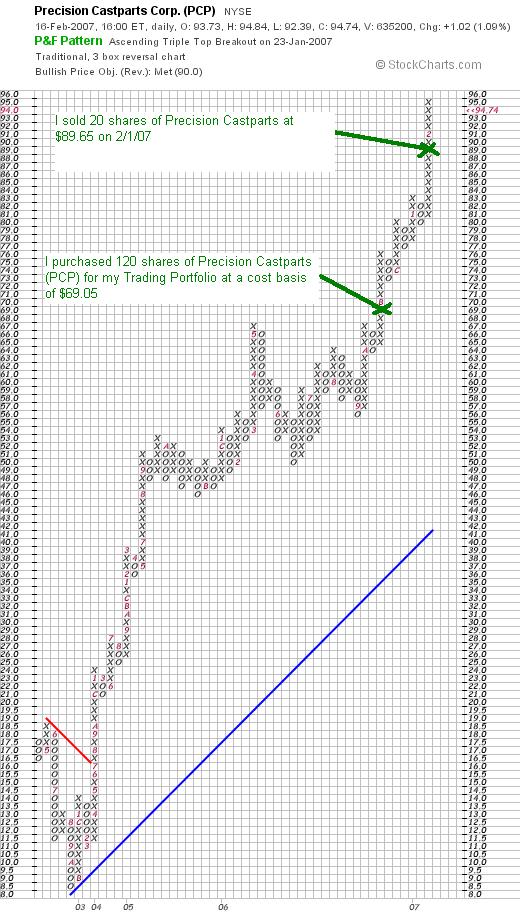
 I currently own 100 shares of Precision Castparts (PCP) in my Trading Portfolio which were acquired on October 24, 2006, at a cost basis of $69.05/share. PCP closed on February 16, 2007, at a price of $94.74, representing an unrealized gain of $25.69/share or 37.2%.
As is my practice, I sold a portion of my holding of PCP, 1/6th to be exact, or 20 shares of my original 120 shares at $89.65 (net) for a realized gain on these shares of $20.60 or 29.8%. It is my strategy to sell 1/6th of holdings if they should appreciate to 30, 60, 90, 120, 180, 240, 300, 360, 450, etc. appreciation points. I plan on selling another 1/6th of my holding or 16 shares if PCP should appreciate to a 60% gain level or 1.6 x $69.05 = $110.48. On the downside, after a single sale at a gain, I plan on selling all remaining shares if the stock should decline back to break-even or $69.05.
Let's take another look at this company and see if it still deserves a spot on this blog!
What exactly does this company do?
According to the Yahoo "Profile" on Precision Castparts, the company
 "...engages in the manufacture of metal components and products; and the provision of investment castings, forgings, and fasteners/fastener systems for critical aerospace and industrial gas turbine applications. It operates through four segments: Investment Cast Products, Forged Products, Fastener Products, and Industrial Products."
How did they do in the latest quarter?
On January 23rd quarter 2007 results.3, 2007, Precision Castparts reported 3rd quarter 2007 results. Total sales for the quarter came in at $1.4 billion, growing 61.5% over the $857.3 million in sales the prior year. Net income for the quarter came in at $158.3 million or $1.15/diluted share vs. net income of $93.7 million or $.69/diluted share the prior year.
The company beat expectations of earnings of $.98/share and also beat revenue expectations of $1.3 billion.
What about longer-term financial results?
Reviewing the Morningstar.com "5-Yr Restated" financials, we can see that after a dip in revenue from $2.19 billion in 2002 to $1.81 billion in 2003, the company resumed a sharp increase in revenue to $3.5 billion in 2006 and $4.3 billion in the trailing twelve months (TTM).
Earnings have indeed been erratic, climbing from $.41/share in 2002 to $1.17/share, only to drop the next two years to $(.01)/share in 2005. Since then, the stock has turned sharply around reporting $2.58/share in earnings in 2006 and $3.39/share in the TTM.
The company has been paying a dividend of $.06/share from 2002 through 2005. In 2006 the company raised the dividend to $.11/share and has paid $.12/share in the TTM.
The company has also increased the number of shares outstanding modestly from 103 million in 2002 to 133 million in 2006 and 136 million in the TTM. This 30% increase in shares has been accompanied by a nearly 100% increase in revenue and a 500% increase in earnings. This is a dilution that seems quite reasonable to me!
Free cash flow, while not completely steady, has been positive and growing with $87 million reported in 2004, $132 million in 2006 and $286 million in the TTM. The balance sheet, as presented by Morningstar.com, appears solid with $108.7 million in cash and $1,781.9 million in other current assets. This total of $1.89 billion of current assets, when compared to the $1.10 billion in current liabilities yields a current ratio of 1.72 which appears healthy to me. In addition, the company has another $1.16 billion in long-term liabilities reported on Morningstar.
What about some valuation numbers?
Reviewing Yahoo "Key Statistics" on PCP, we can see that this is a large cap stock with a market capitalization of $12.99 billion. The trailing p/e is a moderate 24.58, with a forward p/e (fye 02-Apr-08) more reasonable at 17.98. Thus the PEG (5 yr expected) works out to an estimated 1.01. Generally PEG ratios between 1.0 and 1.5 are reasonable to me from a GARP perspective.
Checking the Fidelity.com eresearch website, we see that PCP comes in with a Price/Sales ratio (TTM) of 2.70, well ahead of the industry average of 1.37. Fidelity also shows that the Return on Equity (ROE) (TTM) works out to 21.59%, ahead of its two main competitors per Fidelity: Alcoa (AA) with a ROE of 15.03% and Ladish (LDSH) which has an almost as good ROE of 20.36%.
Finishing up with Yahoo, we find that there are 137.12 million shares outstanding with 136.50 million that float. As of 1/9/07, there were 2.75 million shares out short representing 2% of the float or 3.2 trading days of volume. This short intererst is just a bit over my '3 day rule' for significance.
As noted above, the company pays a forward dividend of $.12/share yielding 0.1%. The company last split its stock 9/9/05, when it had a 2:1 stock split.
What does the chart look like?
If we review the "Point & Figure" chart on Precision Castparts from StockCharts.com, we can see one of the strongest charts I have on the blog. However, with the stock climbing almost vertically it does appear to be a bit overextended at least short-term.
Summary: What do I think about this stock?
Well, first of all, I do own shares of PCP, so I am quite prejudiced :). However, let's review a few of the things I wrote up above. First of all the stock is continuing to move higher since I purchased shares. The latest quarter was incredible! They reported a HUGE increase in revenue and earnings, and beat expectations on both. Longer-term, they have been growing revenue strongly the past few years. Earnings have been a bit more erratic, but have increased very strongly the past couple of years.
The company pays a small dividend and has been recently increasing the payment. The number of shares is relatively stable compared to the sharp revenue and earnings increase.
Free cash flow is strongly positive and the balance sheet appears solid. Valuation appears reasonable with a moderate p/e and a PEG just over 1.0. The Price/Sales ratio does appear steep, but the ROE is better than at least a couple of its largest competitors. Finally the chart looks quite strong if not overextended. The stock may well be due to a correction short-term, but I see nothing holding it back from future appreciation. Much will of course depend on the next quarter's results. Anyhow, this is a great stock that has done well for me!
Thanks so much for stopping by and visiting. If you have any comments or questions, please feel free to leave them on the blog or email me at bobsadviceforstocks@lycos.com. If you get a chance, please feel free to visit my Stock Picks Podcast Website. Have a great weekend everyone!
Bob
"Looking Back One Year" A review of stock picks from the week of October 3, 2005

Hello Friends! Thanks so much for stopping by and visiting my blog Stock Picks Bob's Advice! As always, please remember that I am an amateur investor, so please remember to consult with your professional investment advisers prior to making any investment decisions based on information on this website.
It is once again the weekend, and last weekend I never did get around to reviewing prior stock picks. So now I am another week behind that 'year' :(. So let's get this review going before I crash for the night!
I try to do a lot of different things on this website. First of all, I like to present stocks that I find worthy of consideration for investment and I like to share with you the reasons I have concluded this. In addition, I actually share with you my trading portfolio, letting you know how and when I have made decisions. In order to determine if my strategy is working, and if it needs adjustment I also like to review past stock picks and find out how they would have turned out if I had indeed purchased shares. I review lots of different stocks, but only have the resources to purchase a few!
This review assumes a buy and hold strategy. In practice, I recommend and I also employ a disciplined trading strategy that requires me to sell losing stocks quickly and completely on small losses and sell gaining stocks slowly and partially at targeted appreciation levels. Certainly, this difference in strategy will greatly affect outcomes. For the purpose of this review, and for the ease of calculation, I assume equal dollar purchases of each stock 'picked' during that particular week, and a 'buy and hold' strategy employed to determine the 'performance'. Please take these differences into consideration as you go over my review.
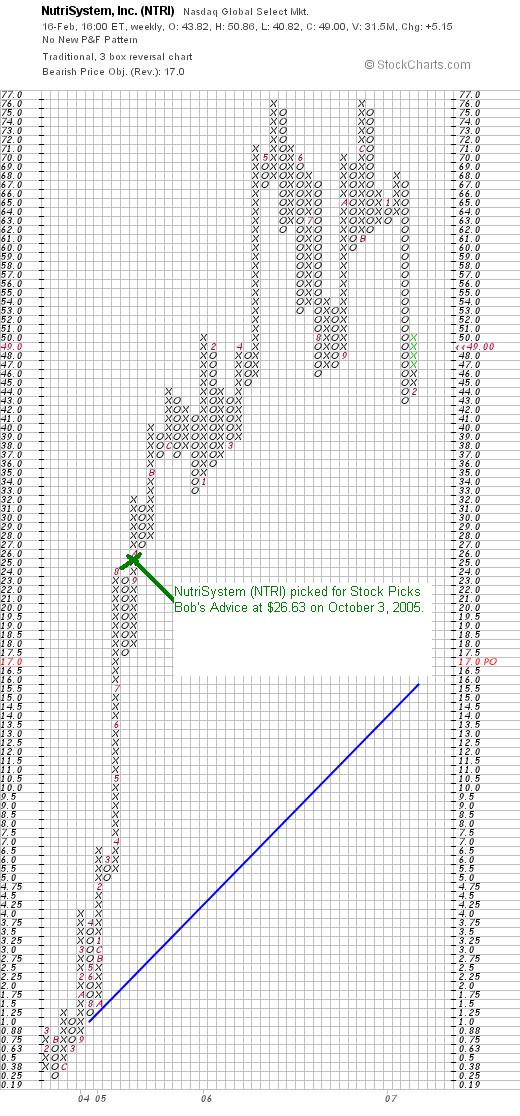
 On October 3, 2005, I "picked" NutriSystem (NUTRI) for Stock Picks Bob's Advice when it was trading at $26.63. NTRI closed at $49.00 on February 16, 2007, for a gain of $22.37 or 84% since posting.
 On February 14, 2007, NutriSystem reported 4th quarter 2006 results. For the quarter ended December 31, 2006, revenue increased 92% to $133.6 million, from $69.6 million in the same quarter in 2005. Net income jumped 213% to $19.6 million or $.53/diluted share, compared with net income of $6.3 million or $.17/diluted share in the fourth quarter of 2005.
The company beat expectations handily. Analysts expected fourth-quarter earnings of $.51/share (the company came in at $.53) on revenue of $130.9 million (the company reported revenue of $133.6 million).
In the same report, the company also raised guidance both for the upcoming quarter as well as all of fiscal 2007. They forecast first quarter earnings of $.88 to $.92/share on revenue of $205 million. (Analysts are currently expecting first quarter earnings of $.85/share on sales of $208.3 million). For the full year, the company guided to earnings of $3.00 to $3.10/share on revenue of $720 million. (Analysts had been expecting earnings of $2.89/share on $739.9 million in revenue.) Thus the guidance was mixed: raised for earnings and actually guiding lower for revenue.
Looking at the "Point & Figure" chart on NutriSystem from StockCharts.com, we can see that the stock has recently pulled back from its short-term highs:
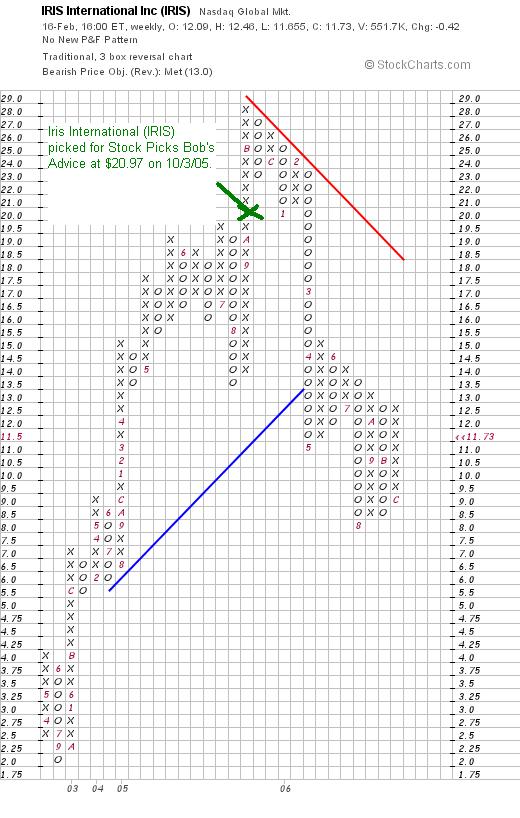
 On October 4, 2005, I posted IRIS International (IRIS) on Stock Picks Bob's Advice when it was trading at $20.97. IRIS closed at $11.73 on February 16, 2007, for a loss of $(9.24) or (44.1)% since posting.
 On November 14, 2006, Iris reported 3rd quarter 2006 results, for the quarter ended September 30, 2006. Revenue for the quarter came in at $18 million, up 13% from the $16 million reported in the same quarter in 2005. Net income for the quarter came in at $800,000 or $.04/diluted share, down from $1.5 million or $.09/diluted share in the 2005 same quarter.
Looking at the "Point & Figure" chart on Iris from StockCharts.com, we can see how the stock climbed to $28/share in August, 2005, only to break through support at $16 and trade lower. In fact the stock is coming off its recent low of $8.00/share at $11.73, still well below its resistance level.
Summary: How did I do with these picks from the week of October 3, 2005?
Well, my NTRI stock pick moved sharply higher, while my IRIS pick moved in the opposite direction :(. Thus, the average of the two stocks was a gain of 20.0%. Not too shabby after all :).
Thanks so much for stopping by and visiting my blog! Please remember that past performance is no guarantee of future price moves. If you have any comments or questions, please feel free to leave them on the blog or email me at bobsadviceforstocks@lycos.com. If you get a chance, be sure and visit my Stock Picks Podcast Site where I discuss some of the many stocks I write about on the blog.
Bob
Friday, 16 February 2007
Hurco (HURC) "Revisiting a Stock Pick"
Hello Friends! Thanks so much for stopping by and visiting my blog, Stock Picks Bob's Advice! As always, please remember that I am an amateur investor, so please remember to consult with your professional investment advisors prior to making any investment decisions based on information on this website.
 As many of you probably know, I like to start my 'search' for stocks for this blog on the list of the top % gainers. These stocks, with good current price momentum, are a good place, from my experience, to find stocks that may well turn out to be long-term winners. That is, if you do your homework and 'look under the hood' so to speak :).
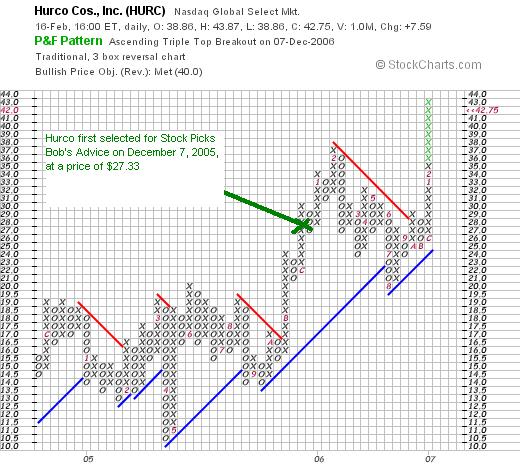
Anyway, between everything else I was doing today, I managed to take a look at the list of NASDAQ top % gainers, and was pleased to see another 'old friend', a stock that I had reviewed previously on December 7, 2005, Hurco (HURC) which closed today at $42.75, up $7.59 or 21.59% on the day (!), in an otherwise flat market for the NASDAQ. Since I had selected this stock at a price of $27.33 on 12/7/05, this represents a gain on the stock pick of $15.42 or 56.4% since posting.
I generally try to wait a full twelve months before 'revisiting' stocks so that I can keep this blog from being too repetitive. I do not own any shares, nor do I have any options on this company.
Hurco deserves a place on Stock Picks. Let me share with you why I say this and why I believe the stock moved strongly higher.
What exactly does this company do?
If we review the Yahoo "Profile" on Hurco, we find that the company is
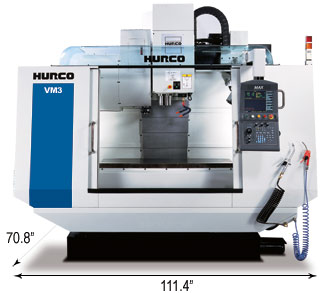
"...an industrial technology company, engages in the design, manufacture, and sale of computer control systems, software, and computerized machine tools for the metal cutting and metal forming industry. Its products include general purpose computerized machine tools primarily vertical machining centers and turning centers."
How did they do in the latest quarter?
It was Hurco's 1st quarter 2007 results, that were reported just prior to the open of trading that pushed the stock strongly higher today! Sales and service fees for the first quarter of fiscal 2007, which ended January 31, 2007, came in at $46.9 million, a 47% over last year's $31.9 million reported in the same period. Net income came in at $5.4 million or $.84/share, up 78% from the $3.03 million or $.48/share last year.
This result exceeded the expectations of at least one analyst, who according to Reuters Estimates, had been expecting $.66/share.
How about longer-term results?
Review of the Morningstar.com "5-Yr Restated" financials is impressive. The company has shown a steady increase in revenue, except for a dip from $92 million in 2001 to $70 million in 2002, and then increasing steadily each year to $126 million in 2005 and $140 million in the trailing twelve months (TTM).
Earnings also showed a similar dip from a loss of $(.28)/share in 2001 to a loss of $(1.48) in 2002. Since 2003, the company has been profitable and has increased earnings from $.08/share in 2003 to $1.04 in 2004, $2.60 in 2005 and $2.82 in the trailing twelve months (TTM).
Since 2001, the number of outstanding shares has held steady at 6 million.
Hurco has been reporting positive and increasing free cash flow with $2 million reported in 2003, $6 million in 2004, $10 million in 2005 and $13 million in the trailing twelve months (TTM).
Their balance sheet, as reported by Morningstar.com, also looks solid, with $24.5 million in cash and $71.3 million in other current assets. This total of $95.8 million in current assets, when compared to the current liabilities of $43.2 million yields a current ratio of 2.22. IMHO, current ratios of 1.25 or higher are considered healthy. In addition, the company has a small amount of long-term liabilities totaling $4.4 million.
What about some valuation numbers on this stock?
Checking Yahoo "Key Statistics" on Hurco (HURC), we can see that this is a small cap stock with a market capitalization of only $272.5 million. the trailing p/e is a very reasonable 17.67, with a forward p/e (fye 31-October-08) of only 12.72. Currently the PEG is estimated at 1.43, but with the current quarter's phenomenal results, this PEG is likely to drop below 1.0 unless the stock price should appreciate significantly.
Checking the Fidelity.com eresearch website for some additional valuation numbers, we find that the Price/sales ratio (TTM) for Hurco is at 1.50 just above the industry average of 1.40. Profitability is also listed as close to average with HURC coming in with a Return on Equity (TTM), of 22.31%, just under the industry average of 22.78%.
Finishing up with Yahoo, we can see that there are actually 6.38 million shares outstanding with 5.56 million that float. Of these, as of 1/9/07, there were 567,260 shares out short, representing 7.8 trading days of average volume (the short ratio). This could possibly explain some of today's huge volume of 1.06 million shares (HURC trades an average of 62,540 shares usually). Many of these short sellers may well have been scrambling to find shares of this rather thinly traded stock as the announcement of terrific earnings was released. Thus, the sharp increase in price, one of the hallmarks of a short squeeze.
No dividend is reported, and the last dividend reported on Yahoo was apparently way back in November, 1992.
What does the chart look like?
If we review a "Point & Figure" chart on Hurco from StockCharts.com, we can see that the stock has been trading higher since at least January, 2004, when it was as low as $4.25. The stock has mad '3 steps forward and two back' so to speak over the last several years, but has not broken-down its basic upward direction. The stock recently has climbed to new highs in the $43 level.
Summary: What do I think about this stock?
Basically I like this stock a lot! Unfortunately, I am not a stockholder, but it is the kind of company I would be buying, if I were buying any shares today. Let me review some of the findings I have written about above: first of all, the company moved sharply higher today in what may well have been partially due to short-sellers scrambling to cover in the face of better than expected and in general simply superb results. The company has been doing quite well for the past several years with steadily increasing revenue and earnings. They have done this without issuing many shares, keeping at the 6 million share level. Free cash flow has been positive and growing and the balance sheet is solid.
Valuation-wise, the p/e is in the teens, and with the current growth, the PEG is likely to be adjusted down to under 1.0. The price/sales and the ROE appear to be reasonable relative to other companies in the same industry. Finally, the chart looks great, if not a tad overextended to me.
Thanks again for stopping by and visiting. I hope you all have a wonderful weekend and stay warm! If you have any comments or questions, please feel free to leave them on the blog or email me at bobsadviceforstocks@lycos.com. If you get a chance, please feel free to visit my Stock Picks Podcast Website, where I discuss many of the same stocks I write about here on the blog.
Bob
Laboratory Corporation of America (LH) "Revisiting a Stock Pick"
Hello Friends! Thanks so much for stopping by and visiting my blog, Stock Picks Bob's Advice! As always, please remember that I am an amateur investor, so please remember to consult with your professional investment advisors prior to making any investment decisions based on information on this website.
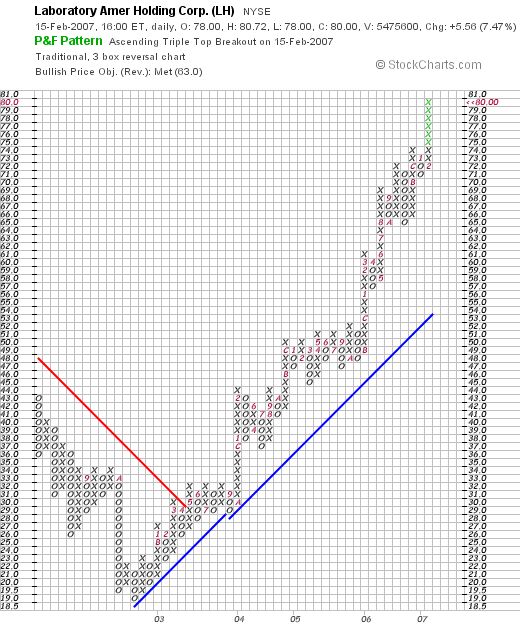
 Again, I am going to try to be extremely brief with a post. Looking through the top % gainers on the NYSE today, I came across an old favorite of mine, Laboratory Corporation of America (LH) which closed at $80.00, up $5.56 or 7.47% on the day. I do not own any shares of this stock, nor do I own any options.
I first posted LH on Stock Picks Bob's Advice on June 20, 2003, as one of the earliest posts on this blog. At that time, the stock was trading at $30.68. With today's close at $80.00, this represents a gain of $49.32 or 160.8% since posting.
What drove the stock higher this morning was the announcement of 2006 4th quarter results. Net sales for the quarter came in at $898.6 million, up 9.3% compared to the 2005 same quarter. Net earnings climbed 16.6% to $103.7 million, up from $88.9 million last year. Earnings per diluted share grew 26.6% to $.81 compared with $.64/diluted share last year.
Analysts had expected earnings of $.72/share on revenue of $874 million, so the company thus beat expectations on both earnings and revenue. In addition, the company raised guidance to earnings of $3.93 to $4.09 from prior outlook of $3.86 to $4.01 and indicated revenue growth of 11 to 13% to $3.98 billion to $4.06 billion. Analysts had been estimating earnings of $3.91 on sales of $3.98 billion. From my perspective, this was a perfect kind of report with strong earnings and revenue growth, beating expectations as well as raising guidance!
Some of the highlights from the Morningstar.com "5-Yr Restated" financials on LH include steady revenue growth from $2.2 billion in 2001 to $3.3 billion in 2005 and $3.5 billion in the trailing twelve months (TTM). Earnings have also steadily increased from $1.27/share in 2001 to $2.71/share in 2005 and $3.07/share in the TTM. Interestingly, the number of shares outstanding, after growing from 139 million in 2001 to 144 million in 2003 has been decreasing, with 140 million in 2004, 134 million in 2005, and 125 million in the TTM as the company has been apparently buying back significant number of shares actually enhancing shareholder value!
The company has had solid free cash flow with $533 million reported in the TTM, up from $481 million in 2005. The balance sheet is adequate with $1.03 billion in total current assets compared to $903.5 million in current liabilities. LH also has $1.1 billion in long-term debt, but this doesn't appear to be a big burden with the over $500 million in free cash flow being generated annually.
Checking the Yahoo "Key Statistics" on LH, we find that this is a large cap stock with a market capitalization of $10.03 billion. The trailing p/e is moderate at 26.09, with a forward p/e of 20.46 and a PEG ratio of 1.80. There are 125.4 million shares outstanding with 124.87 million that float. As of 1/9/07, there were 4.72 million shares out short, representing 5.6 average days of trading volume (the short ratio). This is fairly significant and may well have triggered today's sharp rise with short-sellers scrambling to buy back short shares (just my guess.) In any case, with all of the good news, it is comforting to know that so many shares need to be purchased just to cover pre-sold shares!
Finally, looking at a Point and Figure chart on LH from Stockcharts.com, we can see that after dipping to a low of $19 in October, 2002, the stock started moving higher, breaking through resistance in May, 2003, at about the $30 level, where I "picked" the stock shortly thereafter. The stock has risen sharply and steadily since that time and does appear a bit overextended at the $80 level. Overall, I like the look of this graph a lot.
To summarize, I still like this stock a lot and only regret that I didn't purchase any shares back in 2003. They just reported a great earnings report, the Morningstar.com picture looks solid with shares outstanding even declining, and the valuation appears reasonable with a strong chart.
Thanks so much for stopping by and visiting! If you have any comments or questions, please feel free to leave them on the blog or email me at bobsadviceforstocks@lycos.com. If you get a chance, drop by and visit my Stock Picks Podcast Website.
Bob
Wednesday, 14 February 2007
Arrhythmia Research Technology (HRT) "Revisiting a Stock Pick"
Hello Friends! Thanks so much for stopping by and visiting my blog, Stock Picks Bob's Advice! As always, please remember that I am an amateur investor, so please remember to consult with your professional investment advisors prior top making any investment decisions based on information on this website.
 It was a great day in the market with the indices closing at 12,741.86, up 87.01 and the NASDAQ closing at 2,488.38, up 28.50.
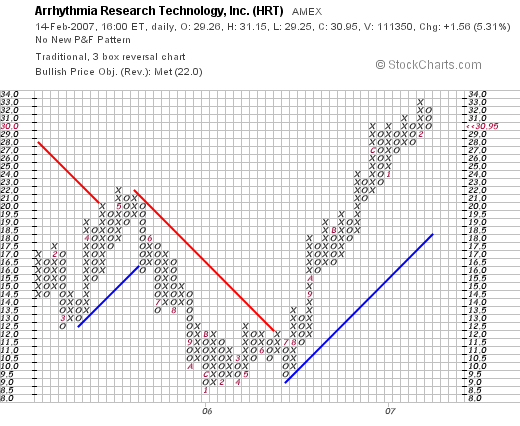
Checking the list of top % gainers on the AMEX today, I saw Arrhythmia Research, an old favorite of mine, on the list closing at $30.95, up $1.56 or 5.31% on the day. I do not own any shares of HRT nor do I have any options. (Don't you think that HRT is a great stock for Valentine's Day?)
According to the Yahoo "Profile" on Arrhythmia Research, the company
"...engages in the development and licensing of medical software that acquires data and analyzes electrical impulses of the heart to detect and aid in the treatment of potentially lethal arrhythmias."
I first posted Arrhythmia Research Technology on Stock Picks Bob's Advice on July 11, 2005, when the stock was trading at $14.55. With today's close at $30.95, this represents an appreciation of $16.50 or 113.4% since posting this stock about 1 1/2 years ago!
It is getting a bit late so let's take a quick look at some of the current bits of information on this company: as found on the company's website, HRT reported 3rd quarter 2006 results on November 3, 2006. Revenue for the quarter ended September 30, 2006 increased by 32% to $4.4 millioon from $3.3 million last year. Net income came in at $510,000 or $.19/share, up from net income of $263,000 or $.10/share in the prior year.
If we review the Morningstar.com "5-Yr restated" financials on HRT, we can see the increase in revenue from $7.2 million in 2002 to $12.9 million in 2005 and $15.3 million in the trailing twelve months (TTM). Earnings have been increasing, except for a dip between 2004 and 2005 from $.07/share in 2001 to $.59/share in 2005 and $.68/share in the TTM. The company is reported to have started paying dividends of $.05/share in 2003 and has increased it to $.12/share in the TTM. Since 2001, the number of shares outstanding has been stable (and small) at 3 million.
Free cash flow is positive if not growing at $1 million in the TTM (the same as in 2003). The balance sheet looks fine with $2.6 million in cash, enough to pay off the current liabilities of $1.5 million with over a million left over. No long-term liabilities are even reported. In addition, HRT is reported to have an additional $5.2 million in other current assets.
Checking Yahoo "Key Statistics" on HRT, we can see that this stock is really a 'micro-cap stock' with a market capitalization of only $82.57 million. The trailing p/e is a bit rich at 40.78. No PEG is reported (probably no analysts willing to estimate earnings going out five years on such a small company).
Yahoo reports 2.67 million shares outstanding with 2.05 million that float As of 12/12/06, there were only 175,170 shares out short, representing 7.3% of the float or only 1 trading day of volume (the short ratio).
Yahoo reports the company paying a trailing dividend of $.06/share yielding 0.2%. No stock split is reported.
Checking a "Point & Figure" chart on HRT, we can see that the stock, which bottomed at around $9 in January, 2006, did not climb out of its base until August, 2006, when it broke through resistance at $12 and resumed an upward trend. The stock has been trading strongly higher since that time to its current level of $30.95.
To summarize, Arrhythmia Research Technology (HRT) is a very small company which made a nice move higher today. They have been reporting strong financial results, have a great Morningstar report, have kept their shares outstanding stable, pay an increasing dividend, and have a very solid balance sheet. The company has done well from a 'pick' point of view, and deserves another revisit here on the blog.
Thanks so much for stopping by and visiting! If you have any comments or questions, please feel free to leave them on the blog or email me at bobsadviceforstocks@lycos.com. Also, be sure and visit my Stock Picks Podcast Site where I discuss some of the many stocks I write about here on the website.
Bob
Posted by bobsadviceforstocks at 11:08 PM CST
|
Post Comment |
Permalink
Updated: Wednesday, 14 February 2007 11:16 PM CST
Tuesday, 13 February 2007
Additional Thoughts on Investing.
I came back from my accountant this evening after spending time last night getting information for my taxes together and submitting it to her for submission. She lectured me about the wisdom of writing about investments on the Internet as an amateur. Maybe it would be wiser to have a CFP after my name, or some other set of credentials, like CFA, or CPA. I don't have any of those.
For I truly am an amateur investor. Sometimes I pick great stocks and other times they trip up and fail to meet my own expectations.
There are not guarantees about anything I write. No guarantees that the choices I make are any better than random. I leave that all up to you to decide and to monitor.
All I can bring to you is my own experience. The ideas that I have adopted and adapted from many wiser investors and financial thinkers. People like William O'Neil who developed the CANSLIM approach to investing. Or others as varied as Paul Sturm from Smart Money or Robert Lichello who believed in the AIM System of automatic investing. Nothing I write is exactly like what any of them believed; and yet, nothing I write is without the inspiration I received from those writers as well. I strongly encourage you to read as much as you can from as many writers as possible so that you can decide about what works for you.
But what I do bring to you is my own perspective about identifying quality stocks. Just the process of determining what is quality is open to debate. But I do believe that my perspective is valuable.
I also try very hard to give you some ideas about dealing with market volatility. Finding ways to manage your stocks without being whip-sawed and forced out of investments only to find them climbing once again but without you. I also don't want to find myself strapped to sinking equities, feeling helpless and not knowing when to bail. Rules give you framework and frameworks can give you freedom.
So as I write about stocks day in and day out, think about my comments about vocabulary of investing. These stocks are the words that you or I can put together to build a powerful language of investing. Each of us may make different sentences and different paragraphs with these words, but we shall all be talking the same language.
Neither I nor you have time to own every stock. Nor do we wish to. So we need to decide which stocks to own. Only the best for me. Only the stocks that can consistently perform over time, relentlessly growing earnings, revenue, and producing free cash flow. Only those with solid balance sheets need apply to my portfolio. Hopefully this will help me to do just a bit better than the market. If so, I shall be satisfied with my own success.
I write this blog because I am able to. Because I enjoy sharing ideas. I enjoy pointing out things that I can see that others may find hidden in front of them. I believe that I can add something to the entire discussion. Maybe somebody somewhere will learn more about approaching stocks from what I write and they shall remember me somewhere to someone. If so I shall be successful.
In addition, I write so that I can learn. Like telling all of my friends that I am on a diet (I am), you become witnesses to my new-found discipline in investing (or eating) and you become my support group as I work to maintain that discipline, buying only when I need to buy and selling only when indicated. When I call you my friends; I do this because all of you are. You are my friends and witnesses to my own trading and investment investigation. I bring you all along for the ride because I need you, not the other way around.
So I shall apologize once again to my accountant who prudently suggested I pull this blog because somebody somewhere may indeed lose money on something I have written about and even though I may also lose money on investments they may blame me. You all need to know that I am an amateur, I am not qualified to advise you on what to do with your money, and that my discussions may well lead to losses as easily or more easily than to gains. Time will tell in this regard.
But meanwhile, I write because I need to. I write because there is so much to say and so little time to say it.
Thank you for coming along for the journey. So few of you comment; but for those of you who do and for those of you who email me, let me express my appreciation. You all make it worthwhile!
Bob
Varian Semiconductor Equipment (VSEA)
Hello Friends! Thanks so much for stopping by and visiting my blog, Stock Picks Bob's Advice! As always, please remember that I am an amateur investor, so please remember to consult with your professional investment advisors prior to making any investment decisions based on information on this website.
First of all I would like to apologize for not doing my weekend reviews this past weekend. Things were pretty hectic around my house--I am sure you know how that can be--and one thing led to another....well no excuses, but I didn't get to it! So I shall have to work double-time to get it posted this coming weekend. In fact, today is pretty rushed as well, so let me try, I know how hard it is for me to do this, but try to be brief and get a stock posted.
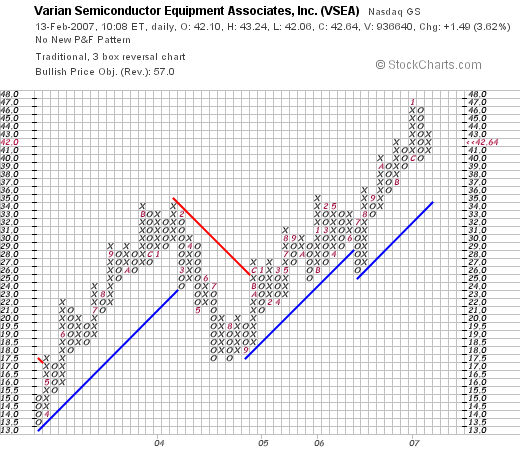
 I was looking through the list of top % gainers on the NASDAQ today and came across Varian Semiconductor (VSEA). I do not own any shares of VSEA nor do I own any options. But it is an interesting stock and deserves a place on the blog. As I write, VSEA is trading at $43.16, up $2.04 or 4.98% on the day.
According to the Yahoo "Profile" on VSEA, the company
 "...engages in the design, manufacture, marketing, and servicing of semiconductor processing equipment used in the fabrication of integrated circuits. It primarily offers ion implantation systems required to build the transistors that are the basis of integrated circuits."
Insofar as the latest quarter is concerned, Varian reported 1st quarter 2007 results on January 25, 2007. The company came in with a very strong quarter with total revenue of $225.6 million, up from $160.9 million last year. Earnings were $37 million or $.66/share, up from $22.3 million or $.39/share last year. The company very importantly imho, beat expectations on both revenue and earnings and then went ahead and raised guidance for the upcoming quarter.
Looking at the Morningstar.com "5-Yr Restated" on Varian, we can see that revenue has improved steadily from $335 million in 2002 to $731 million in 2006. Earnings have increased steadily from $.17/share in 2002 to $1.66/share in 2006. This almost ten-fold increase in earnings accompanied by a more than doubling of the revenue was associated with only a mild increase in shares, about 10% from 50 million in 2002 to 55 million in the trailing twelve months (TTM).
Free cash flow has grown as well from $19 million in 2004 to $129 million in 2006! The balance sheet is equally strong with $413.7 million in cash which by itself is able to easily cover both the $159.2 million in current liabilities and the $24.3 million in long-term liabilities combined. In addition, the company has $309.6 million in other current assets on their balance sheet. This combined $723.3 million, when compared to the $159.2 million in current liabities yields an extremely strong current ratio of over 4!
Looking at a few of the Key Statistics on VSEA from Yahoo, we find that this is a mid-cap stock with a market capitalization of $2.34 billion. The trailing p/e is a reasonable (imho) 22.27, with a forward p/e of 16.37. The PEG (5 yr expected) is a dirt-cheap 0.95. (Generally I find PEG's between 1.0 and 1.5 to be reasonable).
According to the Fidelity.com eresearch website, the company has a reasonable Price/Sales ratio (TTM) of 2.90, compared to an industry average of 3.92. Also from Fidelity, we find that their Return on Equity (TTM) is close to the industry average of 14.78%, with a number of 14.52% for Varian Semiconductor.
Returning to Yahoo, we can see that there are 54.86 million shares outstanding with 54.58 million that float. Of these, 3.84 were out short as of 1/9/07, with a short ratio of 3.6 days. This is a bit over my arbitrary 3 day rule but not by much. No dividends are paid and the last stock split was a 3:2 split on March 1, 2006.
If we examine the VSEA "Point & Figure" chart from StockCharts.com, we can see that the stock has fairly steadily been appreciating in price, except for a bit of a correction in 2004. The stock appears to be behaving strongly without being overextended from its 'base'. Again, I am not a technician, but I believe that the chart simply looks nice :).
In conclusion, I am always a bit concerned about buying into semiconductor-related companies as their business appears to be very cyclical with boom and bust cycles. However, that being said, this particular company has a gorgeous report. Their last quarter did everything right with increasing revenue and earnings, beating expectations, and raising guidance. Furthermore, they have been reporting strong numbers for at least the past five years. Their chart looks great. Valuation is excellent. Free cash flow is spectacular. Their balance sheet is phenomenal. I think I am in love. (Maybe it is just because it is Valentine's Day tomorrow?).
If I were buying stock today, this is the kind of stock I like to find :).
Thanks again for stopping by! If you have any comments or questions, please feel free to leave them on the blog or email me at bobsadviceforstocks@lycos.com. Also, be sure and visit my Stock Picks Podcast Website. If you aren't tired of reading what I write, you can listen to me!
Bob
Thursday, 8 February 2007
Alcon (ACL)
Hello Friends! Thanks so much for stopping by and visiting my blog, Stock Picks Bob's Advice! As always, please remember that I am an amateur investor, so please remember to consult with your professional investment advisors prior to making any investment decisions based on information on this website.
 I was looking through the list of top % gainers on the NYSE this evening and came across Alcon, ACL, which closed at $129.77, up $9.02 or 7.47% on the day. I do not own any shares of Alcon, but my son does own 5 shares in an account that I monitor. I believe this company deserves a spot on my blog so let me go over a few of the points that I think justifies its inclusion here.
What exactly does this company do?
According to the Yahoo "Profile" on Alcon, the company
 "...engages in the development, manufacture, and marketing of pharmaceuticals, surgical equipment and devices, and consumer eye care products to treat diseases and disorders of the eye. Its pharmaceutical products include a line of products to treat glaucoma; anti-infectives, anti-inflammatories, and combination therapies to treat bacterial, viral, and fungal infections of the eye, as well as to control ocular inflammation; products for the treatment of ocular allergies; and generic ophthalmic products and otic pharmaceuticals."
How did they do in the latest quarter?
Yesterday, after the close of trading, the company announced 4th quarter 2006 results. It was this announcement of strong earnings that drove the stock higher today. Sales for the quarter ended December 31, 2006, climbed 16.1% to $1.22 billion, from $1.05 billion in the same quarter in 2005. Even accounting for the positive effects of currency exchange rates, sales grew a strong 13.5%. Net earnings for the quarter came in at $354.7 million or $1.16/diluted share up from $60.7 million or $.19/diluted share last year. (Adjusting for one time items, net earnings in the 4th quarter 2005 would have been $257.9 million or $.83/diluted share, with a resultant 39.8% increase in earnings/share with the adjusted figure!)
The company beat expectations of $1.03/share according to Thomson Financial, on revenue of $1.2 billion. The company also raised guidance for the upcoming year with 2007 per-share earnings of $5.10 to $5.20 on revenue of $5.45 billion expected. Analysts had been expecting earnings of $4.93/share on revenue of $5.34 billion. This was a very strong quarterly report for Alcon!
What about longer-term financial results?
Reviewing the Morningstar.com "5-Yr Restated" financials, we can see the steady increase in revenue from $2.7 billion in 2001 to $4.37 billion in 2005. With the latest quarter, 2006 revenues came in at $4.90 billion.
Earnings were reported at $1.92/share in 2003 with $2.98/share reported in 2005. With the latest quarter, earnings for 2006 totaled $4.37/share.
The company paid $.36/share in dividends in 2004, increased it to $.99/share in 2005, and $1.36/share in 2006.
The number of shares outstanding has been very stable with 309 million in 2003 decreasing to 306 million by 2005. The company is reducing this number further with 302.29 million shares reported on Yahoo.
Free cash flow increased from $758 million in 2003 to $1.07 billion in 2005.
The balance sheet on Morningstar.com shows $1.8 billion in cash, $1.4 billion in other current assets, easily covering the $2.3 billion in current liabilities as well as the $394 million in long-term liabilities combined. The current ratio works out to a 'healthy' 1.43.
How about some valuation numbers on Alcon?
Reviewing Yahoo "Key Statistics" on ACL, we find that this is a large cap stock with a market capitalization of $39.23 billion. The trailing p/e is a bit rich at 38.20 with a forward p/e of 26.32. Yahoo doesn't list a PEG ratio.
According to the Fidelity.com eresearch website, the 5 Year PEG is estimated at 1.57, below the industry average of 1.94. IMHO, PEG's between 1.0 and 1.5 are reasonably valued, and a PEG of 1.57 is acceptable.
Fidelity also shows Alcon with a Price/Sales (TTM) of 7.50, well below the industry average of 21.26, again suggesting reasonable valuation. The company is also quite profitable with a Return on Equity (ROE) (TTM) of 47.94 per Fidelity, compared to an 'industry average' of 34.10%. Again suggesting that the company is more profitable than average as well as being relatively 'cheaper' than average compared to similar companies.
Finishing up with Yahoo, we can see that while there are 302.29 million shares outstanding only 75.18 million float. Of these, 1.89 million are out short as of 1/9/07, representing 4 trading days of volume (the short ratio). With today's sharp rise on an otherwise down day in the market, this bit of a significant short interest may well have been 'squeezed' as short-sellers were likely scrambling to cover their bets by buying shares to close out their positions. Now that is just speculation on my part, but a sharp rise after posting good news may well be evidence of a squeeze.
As noted, the company is paying a forward dividend of $1.36 yielding 1.10%. No stock splits are reported on Yahoo.
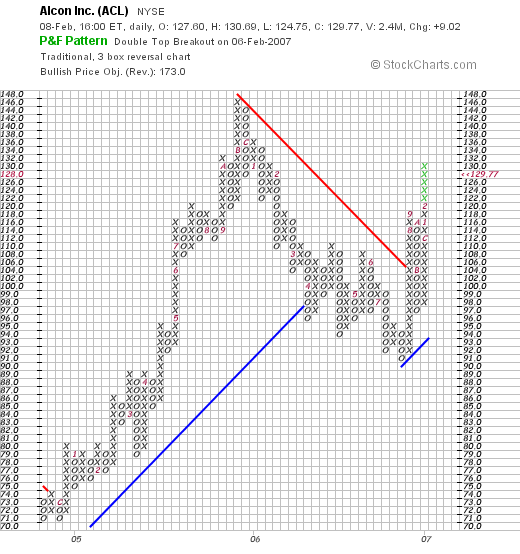
What does the chart look like?
Looking at the "Point & Figure" chart on Alcon from StockCharts.com, we can see how the stock which was trading between $63 and $85 during much of 2004, broke out strongly higher in 2005 to a high of $146 in October, 2005. The stock traded lower throughout much of 2006, hitting a low of $91 in July, 2006, only to turn higher once more, breaking through resistance at $116, and now pushing towards the $130 level. Overall, the stock looks strong to me without being overextended.
Summary: What do I think about this stock?
Taking into consideration my son's small investment in this stock, I have a small bias towards the stock. However, seriously, the stock traded nicely today in an otherwise weak market. The latest quarterly report did everything an investor could wish in a report: they reported increased revenue and earnings, beat expectations on both, and raised guidance on both! Longer-term, they have been reporting strong results for the past 3-4 years, pay a dividend and have been increasing the dividend, reporting increasing free cash flow, and they are even retiring shares enhancing shareholder equity. Finally the balance sheet is strong.
Value-wise, the p/e is a bit rich but with a PEG just over 1.5, it isn't really that bad. The Price/Sales is lower than the average for the industry, while their profitability as measured by ROE is higher. In conclusion, even the chart looks promising as the stock moves towards historic highs.
I like this stock! Only wish it was a bit cheaper. But then again, it isn't the price/share that counts, it is the quality underlying that stock certificate and Alcon fits the bill!
Thanks so much for stopping by and visiting! If you have any comments or questions, please feel free to leave them on the blog or email me at bobsadviceforstocks@lycos.com. If you get a chance, be sure and visit my Stock Picks Podcast Website where you can download mp3's of me discussing many of the same stocks I write about here on the blog!
Bob
Posted by bobsadviceforstocks at 9:10 PM CST
|
Post Comment |
Permalink
Updated: Thursday, 8 February 2007 9:11 PM CST
Newer | Latest | Older


