


Hello Friends! Thanks so much for stopping by! If you are new here, please feel free to browse my blog. As always, please remember that I am an amateur investor, so please consult with your professional investment advisors prior to making any decisions regarding any information on this website. If you have any questions or comments, please feel free to email me at bobsadviceforstocks@lycos.com .
Almost every day, when looking for stocks, I start with the list of top% gainers on the NASDAQ. (I also usually take a look at the NYSE and AMEX lists as well!) Emphasizing stocks with prices over $10 (my preference to avoid excessive volatility and hopefully to improve the quality of the underlying companies), I then check many of these stocks on Morningstar.com to see if they have solid fundamentals as well.
 Today I came across Petco Animal Supplies (PETC) which had a great day closing at $32.90, up $3.18, or 10.70% in an otherwise weak trading day. I do NOT own any shares nor do I own any options on this stock. As an added plus, the stock is trading up $.20 as I write in after hours trading another gain of 0.61%.
 What drove the stock higher today, was that yesterday, after the close, PETC reported 2nd quarter 2004 results. Net sales for the second quarter ended July 31, 2004, came in at $438.5 million, a 12.9% increase over the second quarter of fiscal 2003. Pertinently, the same-store net sales increased 6.7% during the quarter which was quite solid imho. Net earnings came in at $19.3 million, or $.33/diluted share, compared with $13.5 million, or $.23/diluted share in the same period a year earlier. The company forecast continued 5%-6% sames store sales growth for the third quarter, and RAISED GUIDANCE for fiscal 2004 to $1.48 to $1.49, over the previous guidance of $1.43 to $1.44/diluted share...representing a greater than 25% increase over last year's results. The "street" like what it heard and the stock price responded!
 If we look at Morningstar.com "5-Yr Restated" financials, we can see that revenue growth has been steady from $1.0 billion in 2000, increasing to $1.7 billion in 2004. Earnings per share are reported at $1.11 in 2004 and $1.19 in the trailing twelve months. Free cash flow has been also improving with $24 million reported in 2002, and $87 million in the trailing twelve months.
The balance sheet, as reported on Morningstar.com, appears adequate if not spectacular with $65.1 million of cash and $189.1 million of other current assets reported as compared with $189.3 million in current liabilities, and $312.2 million in long-term liabilities. Enough to cover the current liabilities easily, but not so lucky as to have enough current assets to cover the long-term liabilities as well. (Aren't these animal pictures from the Petco website absolutely charming?)
 For a "valuation" assessment, I like to check the easily understandable "Key Statistics" on Yahoo.com. Here we can see that the market cap is a Mid-Cap $1.89 billion. The trailing p/e isn't bad at 25.56, and the forward p/e (fye 31-Jan-06) is even nicer at 18.59. With the solid earnings growth, the calculated PEG comes in at a pretty 0.83. The Price/Sales ratio is also cheap at 1.00.
According to Yahoo, there are 57.49 million shares outstanding with 51.60 million of them that float. Currently there are 1.42 million shares out short, which sounds like a lot, but with the solid daily volume, comes in at 2.75% of the float or 2.385 trading days. (Using my 3 day trading cut-off...totally arbritrary on my part...this isn't quite as bad a short interest as in some stocks.)
No dividend is paid, and Yahoo does not report any stock splits.
How about a graph? Looking at a Point & Figure chart from Stockcharts.com:
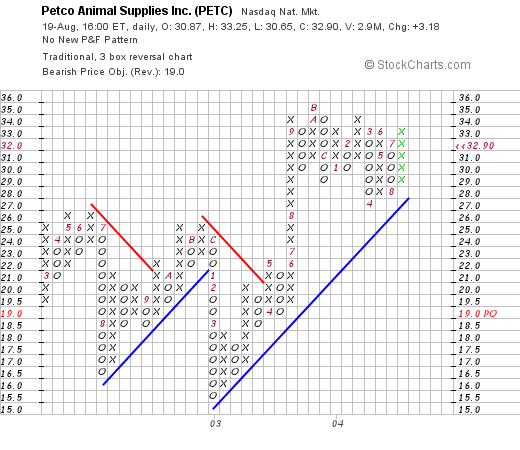
we can see that the stock was really trading sideways between 2002 and 2003 when in April, 2003, it broke through a resistance level at about $20/share and has traded higher since that time. Recently it has run into the same support level at around $28 and now is trading higher once again. The graph looks fine to me at this time.
So what do I think? Well, I like this stock. The earnings report is great with same store sales exceeding 5% in this week retail market, and with the company raising guidance...so important for subsequent stock price appreciation. The record this past five years is solid, the company is generating increasing free cash flow, while the balance sheet which is good, may very well be improving in the face of the free cash flow generation. Valuation-wise, the P/E isn't bad and the PEG is even nicer at 0.83. Finally, the graph looks fine to me!
Well, I am NOT in the market to buy any shares, but if I were....well you never know, I might just pick up a few!
Thanks so much for stopping by! Remember, I am an amateur investor, so take everything I write with a grain of salt and consult with your investment advisors! Regards to all of my friends!
Bob