


 Hello Friends! I cannot think of a more timely post...maybe a few years late? We are focussed on the stock market on this , but sometimes, quite frankly, I have "blog-envy". I kind of wish I could dabble into the political issues facing America today. But that would be enough for a whole different blog, so I will try to stay on topic and get down to some stock picks! As always, please remember that I am an amateur investor, so please remember to consult with your professional investment advisors. If you have any comments, questions, or words of encouragement (discouragement?), please feel free to email me at bobsadviceforstocks@lycos.com .
 As is my usual habit, I start my search for the "great stock pick" by looking through the lists of top % gainers. Emphasizing stocks over $10, I came across Perot Systems (PER) which is currently trading at $16.14, up $.61 on the day or 3.93%. I do not own any shares of PER nor do I own any options.
This company is the same on associated with the third party candidate Ross Perot.
 On September 24, 2004, PER announced management changes That included Ross Perot's giving up the title of President and CEO; a position to be assumed by Peter Altabef, the current Vice President of the Company. According to the Yahoo "Profile", PER "...is a worldwide provider of information technology (IT) services and business solutions to a range of customers.
 Another thing driving the stock higher, besides the semi-retirement of the founder, is the announcement by Perot that 3rd quarter results would be higher than expected. The latest company guidance was for $.21 to $.21/share in earnings on revenue of $448 to $460 million. Previously, they had guided to $.17 to $.18/share of earnings with a revenue target of $430 to $445 million for the quarter. Quite frankly, the raising of estimates is one of the strongest indicators I know that is predictive for future price appreciation.
On August 3, 2004, Perot Systems announced 2nd quarter 2004 results. For the quarter ended June 30, 2004, revenue was $434 million, a 20% increase in revenue. Net Income came in at $21.9 million vs. $4.9 million the prior year. On a per share basis, this worked out to $.18/share this year compared to only $.04/share last year.
How about longer-term? For this, I like to turn to the "5-Yr Restated" financials from Morningstar.com. Her we can observe the fairly uninterrrupted revenue growth (except for a dip between 1999 and 2000) from $1.2 billion in 1999 to $1.6 billion in the trailing twelve months (TTM). Earnings per share have been erratic dropping from $.49 in 2000 to $(.03) in 2001, up to $.68 in 2002 and only $.62/share in the TTM.
Free cash flow looks nice, with $64 million in 2001, improving to $89 million in the TTM. The balance sheet, as a result of the free cash flow, also looks excellent, with $166.9 million in cash, $313.2 million in other current assets, $295.9 million in current liabilities and only $19.5 million in long-term liabilities.
 How about "valuation"? For this I like to check Yahoo "Key Statistics" where some interesting data is found. First, this is a mid-cap stock with a market cap of $1.85 billion. (Per Ameritrade definitions, Small-cap is less than $500 million, Mid-cap between $500 million and $3 billion, and Large-cap over $3 billion.) The trailing p/e is 26.18, and a forward (fye 31-Dec-05) p/e is at 18.94. The PEG isn't bad at 1.40. Price/sales is even more reasonable at 1.10.
Yahoo reports 114.97 million shares outstanding with 75.70 million of them that float. There are currently 2.52 million shares out short, representing 3.33% of the float, and 8.853 trading days. (I arbitrarily use 3 days of short interest as a cut-off for significance, and this stock with almost 9 days of short sales, is thus quite significant!)
Yahoo does not report any stock splits or cash dividends.
What about "technicals"? For this I turn to Stockcharts.com, where I like to look at a "Point & Figure" chart. I find these charts helpful to assess the short and long-term moves of a stock price.
For PER this looks like:
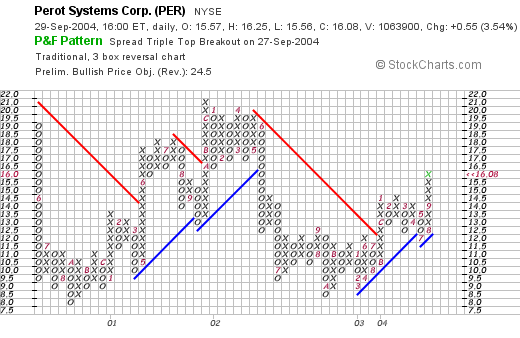
Basically, this stock appears to be trading sideways having hit $8.00 twice, once in 2000, and once again in early 2003. Since early last year, PER has been climbing steadily along its support line. The stock graph looks nice to me, with a short term breakout beyond the resistance line and a recent move higher.
So what do I think about Perot Systems? Well, I never DID vote for Ross, and have never owned any of his shares, but this one looks just fine to me. The latest increased guidance for the 3rd quarter is bullish, the latest quarterly report is just fine. Longer-term, the company continues to grow. And valuation isn't too bad at all. The graph looks positive and certainly not overdone. Now, if I just had some cash to buy some shares!
Thanks so much for stopping by! If this is your first visit, please feel free to browse through my many prior posts! Again, if you have any questions, or comments, please feel free to email me at bobsadviceforstocks@lycos.com .
Bob