Stock Picks Bob's Advice
Sunday, 17 October 2004
"Looking Back One Year" A review of stock picks from the week of September 8, 2003

Hello Friends! It is late Sunday, and I really got to get some shut-eye, but before I do, I wanted to post my "Weekend Review". It is one of the best ways I know to restore some humility to my sometimes inflated ego! Now of course, my reviews assume a buy and hold strategy, and I personally recommend selling if it drops 8%....so the performance of the picks isn't EXACTLY like it would be if it were in a managed account. But then again, there is not arguing witha stock price!
As always, please remember that I am an amateur investor so please do your own due diligence prior to making any decisions about any of these stocks and please consult with your professional investment advisors to make sure your ideas are timely, appropriate, and likely to be profitable for you! If you have any comments, questions, or words of encouragement, please feel free to email me at bobsadviceforstocks@lycos.com . I should warn you, that I may be answering your comments or questions right here in the blog!

On September 8, 2002, I
posted Merit Medical (MMSI) on
Stock Picks Bob's Advice at a price of $23.10. MMSI had a 4:3 split in December, 2003, reducing our stock price to $17.325. MMSI closed on 10/15/04 at $11.23 for a loss of $(6.10) or (35.2)%. Not a very auspicious start to the week!
On July 22, 2004, MMSI
announced 2nd quarter 2004 results. Revenue came in at $38.9 million, up from $34.6 million last year. Net income was $5.1 million compared to $4.2 million the prior year, and on a per share basis, this came in at $.18/share vs $.16/share last year. However, a few days ago, Merit
pre-announced 3rd quarter results which were below expectations but still higher than last year. Revenue is anticipated to come in about $35-$36 million (down from the prior quarter but ahead of last year), and earnings about $.14-$.15/share. Management attributed this to "...reduced demand for Merit's products during the third quarter." Not exactly encouraging and the stock price has reflected this outlook!
On September 8, 2003, I
wrote-up Hi-Tech Pharmacal (HITK) at $28.75. HITK closed at $16.59 on 10/15/04, for a loss of $(12.16) or (42.3)%.
On September 8, 2004, HITK
announced quarterly earnings. Net sales for the quarter ended July 31, 2004, were $12.1 million, a 31% increase in the prior year's sales of $9.3 million. Net income, however, came in at $869,000, down from $953,000, last year, a decrease of 9%. Earnings per diluted share came in at $.10/share, down 9% from $.11/share last year as well. Again, this shows the importance of INCREASING earnings, and the stock price reflects this report.

I
posted Scientific Games (SGMS) on this blog on 9/12/03 at $11.55. SGMS closed on 10/15/04 at $19.36, for a gain of $7.81, or 67.6%.
On July 28, 2004, SGMS
announced 2nd quarter 2004 results. Revenues jumped 38% to $178.1 million from $128.8 million in the same quarter last year. Net income (before preferred stock dividend) jumped 55% to $19.5 million or $.21/share compared to $12.6 million or $.14/share the prior year. These were great results!

Finally, on 9/12/04, I posted Hanger Orthopedig Group (HGR) at $14.75. Hanger closed at $5.48 on 10/15/04 for a loss of $(9.27) or (62.8)% over the past year.
On August 16, 2004, HGR
announced 2nd quarter results. Unfortunately, they have had accounting irregularities that are being cleared up and have taken the "stuffing" out of this stock price. For the quarter ended June 30, 2004, net sales increased by $6.2 million, or 4.5%, to $145.1 million from $138.9 million last year. Unfortunately, net income DECREASED to $2.2 million or $.10/diluted share from last year's $7.8 million or $.34/diluted share. There are plenty of footnotes on this report, and this is not something that results in stock price appreciation to say the least!
Anyhow, I could have just skipped THAT week. Why don't we review our TASER pick again??? lol. But seriously, that was a rough week with three losing issues and one strong gain. The average performance for the week was a loss of (18.2)%. Nothing to write home about!
Please remember that this illustrates the risk of picking "momentum" stocks! However, if we had cut our losses at near 8% on the three losers, and had stayed with our one gainer, well then we wouldn't really have done so badly would we?
If you have any comments, questions, or words of encouragement, please feel free to write me at bobsadviceforstocks@lycos.com . Have a great week investing everyone!
Bob
Friday, 15 October 2004
October 15, 2004 Dorel Industries "B" (DIIB)

Hello Friends! I am just getting geared up around here to push some voter interest! I cannot tell you how important I think it is that you all make sure you get your votes counted. It REALLY is a different sort of election!
As always, please remember that I am an amateur investor so please always consult with your professional investment advisors to make sure that all investments discussed are appropriate, timely, and likely to be profitable for you! If you have any questions or comments, feel free to email me at bobsadviceforstocks@lycos.com .

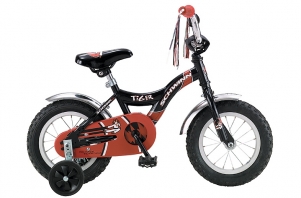
I was scanning through the lists of top % gainers today and came across Dorel Inds "B" (DIIB). I do NOT own any shares or options in this company. DIIB is having a great day today trading as I write at $28.24, up $2.13 or 8.16% on the day. According to the
Yahoo "Profile" on DIIB, Dorel "...specializes in two market segments: juvenile products and home furnishings. Dorel's product offering includes juvenile products such as infant car seats, strollers, high chairs, toddler beds, cribs, infant health and safety aids, play-yards and juvenile accessories, and home furnishings such as a variety of ready-to-assemble (RTA) furniture for home and office use...." Among the brands that I recognized when I went to the
Dorel website included Schwinn bicycles and Cosco car-seats and strollers.
On August 4, 2004, DIIB
reported 2nd quarter 2004 results. For the quarter ended June 30, 2004, revenues came in at $403.5 million this quarter, compared to $264.7 million last year. Net earnings were up 11.3% to $18.1 million or $.55/share compared with $16.3 million or $.50/share last year. These are fairly solid results!
How about longer-term? Checking the
Morningstar.com "5-Yr Restated" financials, we can see that revenue has been increasing steadily with $.6 billion in revenue in 1999, increasing to $1.2 billion in the trailing twelve months (TTM).
Earnings dipped from $1.36 to $.61 between 1999 and 2000, however, since then, earnings have been steadily improving with $2.36 reported in 2003. Free cash flow has also been solidly positive with $36 million reported in 2002, increasing to $111 million in 2002, with $76 millin reported in 2003.
The balance sheet is solid if not spectacular with $13.9 million in cash and $445 million in other current assets as opposed to the $263.7 million in current liabilities and the $352.0 million in long-term debt.
What about valuation? Taking a look at
"Key Statistics" from Yahoo, we can see that this is a mid-cap stock with a market capitalization of $922 million. The trailing p/e is cheap at 11.93 and the forward p/e is even nicer at 8.26. Even the Price/Sales ratio is reasonable at 0.60 and the stock is elling at 1.63 times "book".
Yahoo reports 32.76 million shares outstanding with 32.50 million of them that float. There are currently 513,000 shares out short representing 1.58% of the float. However, due to the low daily trading volume, the short ratio is an astronomic 128.25 trading days of short volume. This would certainly be 'ripe' for a squeeze!
Yahoo does not show any cash dividend and the last split reported was a 2:1 in August, 1998.
How about "technicals"? Using
Stockcharts.com, we can review a "Point & Figure" chart on Dorel:
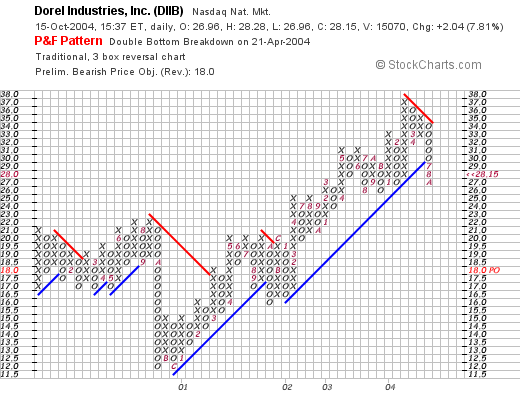
Here we can see that this stock broke down in price to about $11.50 in late 2000, Since that time it has successfully been trading higher to its current level at around $28. Looks nice to me!
 So what do I think? Well, it IS a Canadian company, so that gives it a little bit of a currency spin...but that really shouldn't be a problem. I like and am familiar with their brands (a Peter Lynch moment!), the latest quarter looks nice, the last five years has been steadily improving, free cash flow is solid, the balance sheet is good, valuation is excellent and the chart looks nice! What is there NOT to like? lol. Now if I just had some money to invest! As you may know, I like to wait for a sale of one of my pre-existing positions prior to adding funds to establish a new position in this portfolio!
Thanks again for stopping by! If you have any questions, comments, or words of encouragement, please feel free to email me at bobsadviceforstocks@lycos.com
Bob
Monday, 11 October 2004
"Charles Kirk responds"
Hello Friends! I am afraid I may be getting some notoriety out here in cyberspace! A few days ago I posted a letter about Stock Picks which mentioned The Kirk Report in a less than flattering fashion. This was not my opinion, and I apologize publicly to Mr. Kirk, a fellow blogger, who works hard at providing a quality product to the Internet Community. In fact, I have provided a link to The Kirk Report on each of my Blog Pages because I felt it was content that was worth reading!
Mr. Kirk writes:
Bob,
Thank you for posting the letter you received about my website at your
blog. A few dozen readers who apparently saw that post have contacted
me to say how much they appreciate my website and have found it very
useful despite what you printed.
Sincerely,
Charles E. Kirk, The Kirk Report
http://www.kirkreport.com
I very much hope this clears the air on this question. Thank you Mr. Kirk for taking the time to write! I hope that you come back often and visit, and I hope that my readers also visit your blog and take advantage of what your site has to offer!
Bob
Sunday, 10 October 2004
"Looking Back One Year" A review of stock picks from the week of September 1, 2003
Hello Friends! It has been a couple of weeks since I looked back at some past picks. I don't know about you, but my life sure gets busier and busier! O.K. so that ISN'T a very good excuse...well anyway, I am glad I am back on track for now. What I do in these reviews, if you are new to this website, is try to assess how selections that I posted here on
Stock Picks Bob's Advice have performed about a year later. I like to look at selections at a week at a time. This week, I am up to the week of September 1, 2003, about 13 months ago. As always, please remember that I am an amateur investor, so please consult with your professional investment advisors prior to making any investment decisions based on information on this website. And as I sometimes like to add, past performance, both good and bad, is no guarantee of future performance!

The first stock to be posted that week was Sohu.com, which I
posted on this blog on September 2, 2003, at a price of $33.47. This was a loss of $(16.01) or (47.8)%. NOT a very exciting selection. Please remember, that in actual practice, I utilize an 8% stop loss on all of my actual investments, but for the sake of this review, I assume a "buy and hold" strategy.
On July 28, 2004, SOHU
reported 2nd quarter 2004 results. They reported that revenues jumped 41% from the prior year to $27.3 million. Net income for the quarter came in $9.9 million or $.25/share compared with $7.5 million or $.19/share the prior year. In the same announcement, SOHU cut guidance to $28.1 to $29.1 million, with net income between $.23 and $.25/diluted share. They are thus predicting a sequential drop in net income. The "street" didn't like this report and the stock corrected.

On September 3, 2003, I
posted Take-Two Interactive (TTWO) on Stock Picks at a price of $35.75. On October 8, 2004, TTWO closed at $34.18, for a loss of $(1.57) or (4.4)%.
On September 9, 2004, TTWO
announced 3rd quarter 2004 results. For the third quarter ended July 31, 2004, sales grew 6% to $160.9 million from $152.1 million the prior year. However, the company lost $(14.4) million or $(.32)/share compared with a profit of $5.7 million or $.13/share in the year-ago period. This even exceeded First call estimates for a loss of $(.30)/share. Not exactly stellar results!

On September 4, 2003, I
posted Interpore International (BONZ) on Stock Picks at $17.50. Interpore was acquired by Biomet (BMET) on June 18, 2004, at a price of $14.50/share. This represented a loss of $(3.00)/share or (17.1)%.
So how did we do that week? Well in one word, AWFUL. This is one of the few weeks I can recall when ALL of the stock picks came in with losses. For the three stocks the average loss was (23.1)%. This only shows you the importance of having a loss limit in your strategy. As I have said many a time, I hold my stocks to an 8% loss and then out they go!
Thanks so much for stopping by! If you have any questions, comments, or words of encouragement, please feel free to email me at bobsadviceforstocks@lycos.com .
Bob
Posted by bobsadviceforstocks at 5:44 PM CDT
|
Post Comment |
Permalink
Updated: Sunday, 10 October 2004 9:52 PM CDT
Thursday, 7 October 2004
A Reader Writes, "...I think you do a great job with your blog."

Hello Friends! I really like getting mail, and Jeff was kind enough to write me this evening. (Ever since I was a kid, I have always liked getting regular mail....and now, with the blog, I am just as tickled!) (I enclosed a copy of "Refrigerator Pies" by Wayne Thiebaud, a wonderful artist I admire...wouldn't it be fun to share some art here as well?)
He wrote:
I'm a semi-professional too. And, I think you do a great job with your blog. I have been reading it for about a week. You do a great job of presenting good information on companies. You're fair and honest about it. In comparison to the Kirk Report. He has some good ideas. But, he seems to be trying to make money on the market instead of in the market, with donations,without legitimate credentials. Anyway, I think you do a great service. I hope you will keep it up..Now I don't want to make any comments about the
The Kirk Report, as he is a fellow blogger, but I appreciate the kind words that Jeff has written. (I really should warn readers that I may post their letters but I don't want to discourage them from writing!)
I will try hard to hang in there and write away....writing actually gets easier over time, and I hope that my entries are more informative as I go on. I am learning a lot right with you as well!
Thanks again for stopping by Jeff, and please keep those cards and letters coming...at bobsadviceforstocks@lycos.com .
Bob
October 7, 2004 Parlux Fragrances (PARL)

Hello Friends! I felt like I needed to liven up the website...so here it is a portrait of Christopher Columbus to commemorate the upcoming Columbus Day Holiday on October 12th. Hard to believe that it has been 500 years since Columbus "discovered" America. Seems like yesterday!
Thanks so much for stopping by and visiting my blog,
Stock Picks Bob's Advice. I have provided a link because some of you may well be reading this post on a third party site and might wish to stop by and visit the original! As always, please remember that I am an amateur investor, so please do your own investigation of all stocks discussed on this website and consult with your professional investment advisors prior to making any investment decisions to make sure that all investments are appropriate, timely, and likely to be profitable for you! Remember, I love to hear from all of you, so if you have any questions, comments or words of encouragement, please feel free to email me at bobsadviceforstocks@lycos.com .
As a quick review for any of you that are new to this blog, I like to present stocks for "consideration". Stocks that I believe may represent companies that have demonstrated qualities that could result in positive price appreciation.
In a nutshell, I start my search scanning the
lists of top % gainers in the market. From this list, lately, I try to stay with stocks at least $10. I have avoided financial issues because my methodology does not conform well to these types of investments. Otherwise, I check most of the stocks on the list looking first to the latest quarterly result, looking for increasing revenue and earnings; then the last several years on Morningstar.com, again looking at revenue and earnings, but also free cash flow, dividend growth, and the balance sheet; then checking Yahoo.com for a look at valuation, and finally, a quick inspection of a point & figure chart from Stockcharts.com.

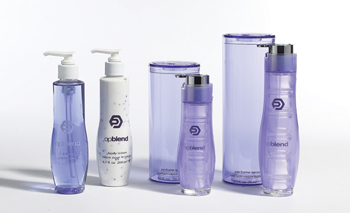
Today, while looking through the lists of top percentage gainers I came across Parlux Fragrances (PARL). I do not have any shares or options in this investment. PARL, as I write, is trading at $14.95, up $.98 or 7.02% on the day. According to the
Yahoo "Profile", PARL "...is engaged in the creation, design and manufacture, distribution and sale of prestige fragrances and beauty-related products marketed primarily through specialty stores, national department stores and perfumeries on a worldwide basis."

On August 5, 2004, PARL
reported 1st quarter 2005 results. For the quarter ended June 30, 2004, net sales increased to $23.0 million from $16.9 million last year. Net income was up 200% to $2.2 million compared with $.7 million last year. On a per share fully diluted basis this came in at $.21/share vs. $.08/share in the prior year.
How about longer-term? Checking the
"5-Yr Restated" financials on Morningstar.com, we can see a steady revenue growth from $66 million in 2000 to $87 million in the trailing twelve months (TTM). Earnings have been less steady, dropping to a loss of $(.57)/share in 2002, but increasing since then to $.76/share in the trailing twelve months.
Free cash flow has also been improving. Again, a negative $(6) million in 2002, but improving to $13 million in the TTM.
Balance-sheet-wise, they appear quite solvent with $7.6 million in cash and $60.4 million in other current assets balanced against $13.1 million in current liabilities and only $1.6 million in long-term liabilities.
How about "valuation"? Looking at
Yahoo "Key Statistics", we can see that this is a very SMALL cap stock, some might even say MICRO cap!, with a market cap of only $137.70 million. The trailing p/e is reasonable at 20.21. No forward p/e (? any analysts making estimates?), and thus, no PEG. Price/sales isn't bad at 1.46.
There are only 9.06 million shares outstanding with 7.80 million that float. Currently there are 215,000 shares out short, representing 2.76% of the float or 5.375 trading days of volume. This is a bit higher than my 3 day short coverage ratio that I use to consider a significant short position.
No cash dividend is reported and the last stock split was a 2:1 reported by Yahoo for November, 1995.
How about "technicals"? Looking at a point & figure chart from
Stockcharts.com:
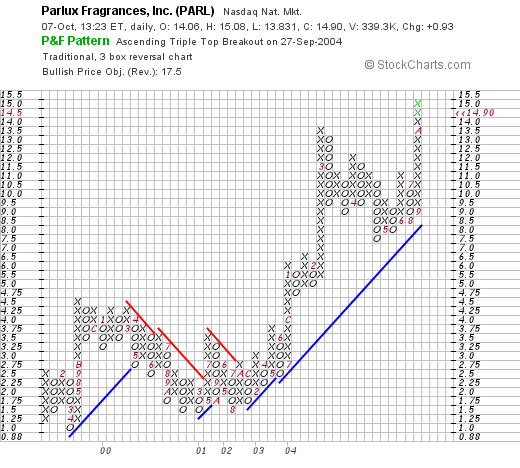
we can see that the stock, which was trading sideways between early 1999 and late 2002, in the range of $1.25 to $4.75, broke through resistance in September, 2003, at about $3.50, and has traded strongly higher since that time. The chart looks nice to me!
So what do I think? This is a very small stock and may represent opportunity, or volatility. The latest quarter looks solid, the five year record of increasing revenue is great. Earnings have been on the rise the last few years, free cash flow is improving, the balance sheet is nice, and valuation is reasonable. Furthermore, the chart looks strong to me!
But as you may know, I just SOLD my ANN to preserve my gain, and I cannot buy anything until the market signals me that the "coast is clear" by a sale of one of my holdings at a gain. That is why my latest transactions have been sales!
 Thanks so much for stopping by! Always remember that I am an amateur investor so please consult with your invesment advisors prior to making any investment decisions based on information on this website. Again, if you have any questions or comments, please feel free to email me at bobsadviceforstocks@lycos.com .
Bob
"Trading Transparency" ANN
Hello Friends! Just a quick note to update you on a trade in my Trading Portfolio. I just sold 225 shares of my Ann Taylor Stores (ANN) at $21.80 as it just got into the loss column. I had purchased these shares 10/1/03, a little over a year ago at $21.85/share. On December 1, 2003, I sold 50 of my original 200 shares for a gain of $376.40. Since I had already sold a portion at a gain, my trading rules dictates a sale as it approaches the break-even on the way down. And sell I did!
Will keep you posted!
Bob
Wednesday, 6 October 2004
October 6, 2004 Wolverine World Wide (WWW)
Hello Friends! Thanks so much for stopping by. If you are new to this website, you might want to see my main page:
Bob's Advice for Stocks, where I review some of the parameters I like to consider when evaluating a stock. In a nutshell, I like to start first evaluating the
lists of top % gainers for the day. Often I will start first with the NASDAQ, but sometimes, like today, I review the NYSE lists first. In any case, I go through a screening process, first checking the latest quarter financial results, then looking at the last 5 years on Morningstar, checking valuation issues with yahoo, and then look at a chart from Stockcharts.com.
There really isn't anything 'magic' about what I do. I had a semi-professional investor tell me what I was doing was just "due diligence". I guess that was a compliment. But please remember that I am an amateur investor, so consult with your own professional investment advisors prior to making any investment decisions based on information on this website.

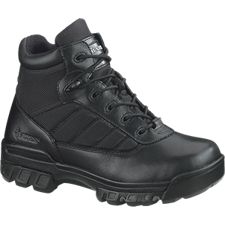
How about a shoe company for a change? I was scanning the
list of top % gainers on the NYSE, when I came across Wolverine World Wide (WWW). WWW was the second-best %-gainer on the NYSE today, closing at $28.90, up $2.53 or 9.59% on the day.

According to the
Yahoo "Profile", WWW "...is a designer, manufacturer and marketer of a broad line of casual shoes, outdoor and work footwear and constructed slippers and moccasins. The Company's footwear products are organized under five operating units: The Wolverine Footwear Group, the Outdoor Group, Caterpillar Footwear, The Hush Puppies Company and Other Branded Footwear."
What drove the stock higher today, was that the company
announced 3rd quarter 2004 earnings. For the quarter, revenue rose 13% to $260.9 million from $230.6 million last year. Earnings rose 34% to $21.9 million or $.55/share from $16.4 million, or $.40/share in the year-ago period. Even nicer, the company RAISED guidance for 2004 to a range of $1.60 to $1.62 per share on revenue of $975 to $985 million. Previously, they had guided to $1.44 to $1.52/share on revenue of $960 to $980 million.
'
How about longer-term? Well, if you have visited here before, you will know that the next place I like to look is the
Morningstar.com "5-Yr Restated" financials. There we can see the steady improvement in revenue from $665.6 million in 1999 to $937 million in the trailing twelve months (TTM).
Earnings have been a bit more erratic, dropping from $.78/share in 1999 to $.26/share in 2000, but then steadily improving to the current $1.43/share in the TTM.
Free cash flow has been outstanding, improving from $43 million in 2001 to $94 million in the TTM. The balance sheet also looks nice per Morningstar.com with $63.6 million in cash and $342.2 million in other current assets, enough to cover the current liabilities about four times over. In addition, the company has $62.9 million in long-term debt.

How about the "valuation" of WWW? Looking at
Yahoo "Key Statistics", we can see that the market cap is a mid-cap $1.13 billion. The trailing p/e is 20.21 with a forward p/e (fye 3-Jan-06) of 16.71. The PEG is at 1.35, a little steep.
Yahoo reports 39.12 million shares outstanding with 38.00 million of them that float. As of 9/8/04, there are 1.17 million shares out short, representing 3.07% of the float or 7.535 trading days (!). This appears significant to me as I use a 3 day cut-off for signifance for this figure.
WWW also pays a small dividend of $.26/share yielding 0.99%. The last stock split reported on Yahoo was a 3:2 split as of May 27, 1997.
Looking at a "Point & Figure" chart from
Stockcharts.com:
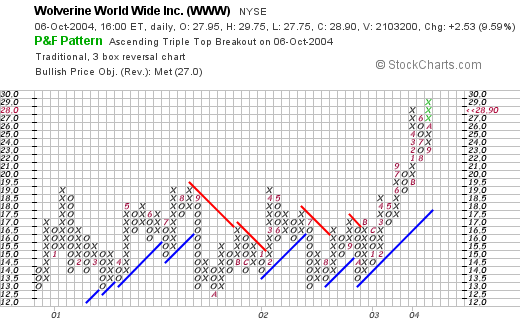
We can see that this stock has been trading sideways from 2001 through 2003 and in early 2004, this stock broke out to a higher level.
At this point in the discussion, I like to summarize. First, the stock had a nice move today, showing good daily momentum. The recent earnings are solid (came out today), the latest five years shows steady revenue growth and fairly steady free cash flow improvement, with an outstanding balance sheet. Valuation is reasonable. There are even a few shorts outstanding that may add to an upward move of this company.
By the way, I do not own any shares of this company nor do I own any options.
Currently, in my "Trading Portfolio", I am patiently waiting hopefully for American Healthways to hit a sale point (30% appreciation) which would permit me in my trading allowance to add a new position. If you have any comments or questions, please feel free to email me at bobsadviceforstocks@lycos.com
Bob
Posted by bobsadviceforstocks at 11:51 AM CDT
|
Post Comment |
Permalink
Updated: Wednesday, 6 October 2004 10:39 PM CDT
Monday, 4 October 2004
October 4, 2004 Wipro Ltd. (WIT)
Hello Friends! Thanks again for stopping by. We have had a few days in the market with some upward momentum and actually my Trading Portfolio is getting close to a sale on one or two issues at a gain....so MAYBE I will be adding a new position soon (?) As always, please remember that I am an amateur investor, so consult with your professional investment advisors prior to making any investment decisions based on information on this website; please make sure all of your investment decisions are appropriate, timely, and likely to be profitable for you! If you have any questions or comments, please feel free to email me at bobsadviceforstocks@lycos.com .

If you listened to the Presidential debate last week or the Vice-Presidential debate tomorrow evening, you are sure to know that "outsourcing" is one hot topic. Scanning through the
list of top % gainers on the NYSE today, I came across Wipro Ltd. (WIT). I do not own any shares of this stock nor do I own any options. WIT closed at $20.86 today, up $1.56 or 8.08%.

According to the
Yahoo "Profile", WIT "...is a global information technology (IT) services company." Based in India, it does a lot of business in "outsourcing" of software for many large corporations.
On July 23, 2004, WIT
announced 1st quarter 2005 results. For the quarter, WIT earned $71 million, up from $38.8 million the prior year. Revenues were up 51% to $385 million during the latest quarter up from $255 million the prior year. On July 22, the company
announced results in Rupees. On a per share basis, earnings per share were 4.69 Rupees, up 83% over the earnings per share of 2.57 Rupees the prior year.
How about longer-term? Taking a look at a Morningstar
"5-Yr Restated" financials, we can see that revenue has grown steadily from $424.3 million in 1999 to $883.9 million in 2003.
Earnings have been a little less dynamic but have improved from $.06/share in 1999, to $.24/share in the trailing twelve months. Free cash flow has also grown steadily from $71 million in 2001 to $105 million in 2003.

The balance sheet is solid with $295.8 million in cash, almost enough to pay BOTH the current liabilities of $150.2 million and the miniscule long-term debt of $4.1 million two times over. In addition, WIT has $294.9 million in other current assets. This company is quite solvent!
How about "valuation"? Looking at
"Key Statistics" from Yahoo, we can see that the market cap is a Large Cap $14.48 billion. The trailing p/e isn't cheap at 58.11 (quite steep actually), with a forward p/e (fye 31-Mar-06) of 37.25. Thus, the PEG, if these estimates are right, isn't too bad at 1.46. The Price/Sales is also quite rich at 9.53.
According to Yahoo, there are 694.33 million shares outstanding (!), with 111.0 million of them that float. Of these shares, 1.47 million are out short as of 9/8/04, representing 1.32% of the float or 10.131 trading days. In my view, this is significant (with anything over 3 days to cover significat.)
Yahoo reports a small dividend of $.0303/share yielding 0.16%. WIT recently had a 3:1 split on 7/2/04.
What about "technicals"? If we look at a graph from
Stockcharts.com:
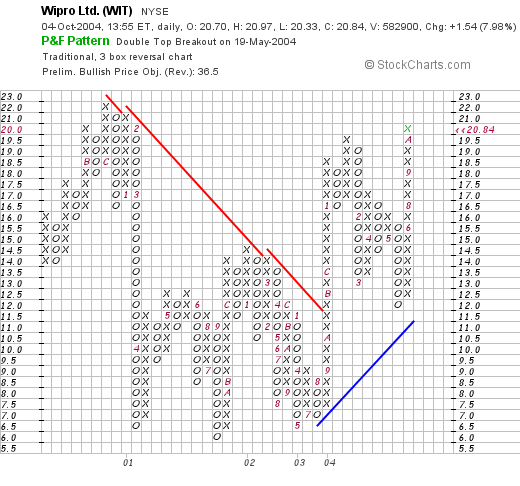
we can see that this stock actually peaked in February, 2001, at around $22/share and then declined sharply down to $6.50. It has consolidated at this level through August, 2003, and then broke through resistance in October, 2003, moving steadily higher along a new support level to its current level. Presently, it appears over-extended at the $22 level, and would look for it to pull back towards the $15 range before moving higher....but then again, that is just my take on the chart...please review as well!
 So what do I think about this stock? (Isn't this a great picture from the WIPRO website?) Overall, if we take away the lack of political correctness, this is a very dynamic company in a growing field. The earnings recently reported and the 5 year revenue growth is impressive. The balance sheet is superb, they are generating loads of cash and have relatively little debt with virtually NO long-term debt. Unfortunately, I am not the first to discover this stock and the valuation IS a bit steep. But then again, they are growing quickly so maybe it IS worth the price?
Currently, I have no cash to invest, that is, under my system, I need a partial sale from my trading portfolio before I add a new position....so I am sitting on my hands once again! If you have any questions, comments, or words of encouragement, please feel free to email me at bobsadviceforstocks@lycos.com .
Bob
Thursday, 30 September 2004
September 30, 2004 Sauer-Danfoss (SHS)
Hello Friends! I am so glad you stopped by. I hope that what I write is meaningful to you. If you have any comments on how you use this information, please email me at bobsadviceforstocks@lycos.com so that I may post a few of these comments on the website...matter of fact, I may do that anyhow! Please remember that I am an AMATEUR investor, so please consult with your professional investment advisors and do your own investigation on all stocks discussed on this website to make sure the investments are timely, appropriate, and likely to be profitable for you!

Looking through the NYSE
list of top % gainers, I came across Sauer-Danfoss (SHS), a stock that I had honestly NEVER heard of before, and that I do NOT own any shares or options. SHS had a nice day today, closing at $17.08, up $.74 or 4.53% on a day where the DJIA closed down 55.47, with the NASDAQ up only 2.90. According to the
Yahoo "Profile", SHS "...is a global manufacturer of components and integrated hydraulic, electric and electronic systems that generate, transmit and control power in mobile equipment."
On August 4, 2004, SHS
reported 2nd quarter 2004 results. Net sales for the quarter increased 23% to $379.1 million, compared to sales of $308.5 million the prior year. Even excluding currency effects, sales were still up 18% year-over-year. Net income for the quarter came in at $21.6 million, or $.46/share compared with second quarter 2003 results of net income of $11.3 million or $.24/share. This is almost a 100% increase in earnings! This was a solid report, with company raising guidance stating "...we are increasing our earnings expectations for the full year to $.70 to $.80 per share. The most recent earnings expectation, from May 3, 2004, was $.60 to $.75 per share." It is SO important, imho, to see earnings guidance RAISED. It is the icing on the cake of a good earnings report!

In another "bullish" move, the company, on September 23, 2004,
announced an increase in its quarterly dividend by 43% to $.10/share from $.07/share. While dividends aren't absolutely required for a great stock, if you can get them, they only help, and a company that RAISES its dividend is sending another bullish signal to the investment community!
How about longer-term? If we look at the
Morningstar.com "5-Yr Restated" financials, we can see that revenue has grown steadily from $0.5 billion in 1999 to $1.3 billion in the trailing twelve months (TTM).
Earnings have been positive but erratic, dropping from $.67/share in 1999 to $.09 in 2001, but have improved to $.48/share in the TTM.
Free cash flow has also been improving recently with $(2) million reported in free cash flow in 2001, improving steadily to $41 million in the TTM.
Looking at the balance sheet, we find what I would call a solid if not spectacular balance sheet (in my humble opinion), with $15.8 million in cash and $478.8 million in other current assets vs. $479.3 million in current liabilities and $237.1 million in long-term liabilities.
How about "valuation"? Checking
"Key Statistics" from Yahoo, we can see that this is a mid-cap stock with a market capitalization of $810.38 million. No trailing p/e, or PEG is reported but the forward p/e (fye 31-Dec-05) is quite reasonable at 14.98.
Yahoo reports 47.45 million shares outstanding with only 10.00 million shares that float. There are only 123,000 shares out short as of 9/8/04, however, with the low average trading volume this still works out to a ratio of 4.393 days. Sort of significant (?).
The stock currently yields $.40/share or 2.45%. No stock dividends are reported on Yahoo.
How about "technicals?" If we look at
Stockcharts.com for SHS we can see:
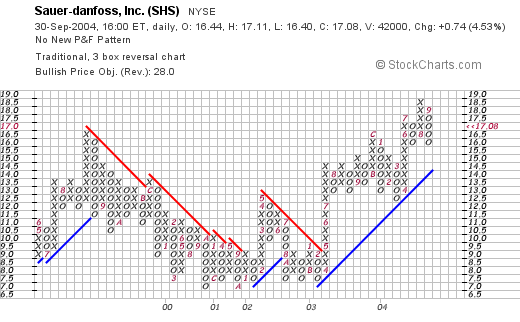
this stock had been trading lower between August, 1999, and bottomed several times around $7.00 between October 2000, and February, 2003. Since that time, it has been trading higher along a new support line closing today at $17.08. The graph looks nice to me!
So what do I think? The latest earnings report is solid. The five year record is good, except for a bit erratic record of earnings. The free cash flow is growing, the balance sheet is solid, valuation is reasonable, and the stock even pays a dividend, which has been recently increased! Technically, the chart looks great and doesn't appear over-extended.
I don't know much about the products directly, but the rest of the numbers look nice. Now, if I just had some money to be buying! LOL, but I am waiting for a buy signal...meaning a sale of one of my remaining positions at a sale target price. Otherwise, once again, I stay sitting on my hands!
Thanks so much for stopping by! If you have any questions, comments or words of encouragement, please feel free to email me at bobsadviceforstocks@lycos.com .
Bob
Newer | Latest | Older


