


Hello Friends! Well I have gotten to enjoy the single posts on this blog for stocks but Boston Scientific (BSX) came up today on some positive comments, and the numbers just cannot be ignored. In the past, I have posted Surmodics (SRDX) which makes the stent for Johnson & Johnson....but BSX is pulling in the lion's share of the market.
As ALWAYS, please consult with your PROFESSIONAL investment advisors as I am just an amateur investor, before taking action regarding this or any other investment on this website to make sure such investments are timely and appropriate for you!
 Boston Scientific (BSX) had a nice day today closing at $42.80, up $1.81 or 4.42% on the day. According to the Yahoo "Profile", BSX "...is a worldwide developer, manufacturer and marketer of medical devices whose products are used in a range of interventional medical specialties, including interventional cardiology, peripheral interventions, neurovascular invtervention, electrophysiology, vascular surgery, endoscopy, oncology, urology and gynecology."
  This is a GREAT picture of the Taxus covered cardiac stent, the device that is used to maintain the patency, that is keep the coronary arteries OPEN after angioplasty....hopefully preventing the need for bypass surgery.
On April 20, 2004, BSX announced 1st quarter 2004 results. For the quarter ended March 31, 2004, net sales came in at $1.08 billion compared to $807 million, a 34% increase. Even removing the favorable currency exchange effects, the revenue growth came in at 27%. Net income jumped 100% to $194 million or $.23/diluted share vs. $97 million, or $.11/diluted share the prior year. These are great results!
Checking the "5-Yr Restated" Financials from Morningstar.com, we can see that revenue was fairly stable between 1999 when it was $2.8 billion, and 2002 when $2.9 billion of sales were reported. Since, then, sales have grown to $3.8 billion in the TTM, on the back of the fabulous reception BSX's drug-coated stents have received (about 70% of the market agains J&J's Cypher stent.)
Earnings dropped initially from $.45/share in 1999 to a loss of $(.07)/share in 2001, then has increased each year to $.68/share in the TTM.
The free cash flow has been SOLID. $369 million reported in 2001, $624 million in 2002, $599 million in 2003, and $485 million in the TTM.
The balance sheet is adequate with $615 million in cash and $1.37 billion in other current assets vs. $1.74 billion in current liabilities and $882 million in long-term liabilities.
What about Valuation? Looking at "Key Statistics" on Yahoo, we can see that this is a Large Cap stock with a market cap of $35.74 billion. The trailing p/e is rich at 63.79, but the company is growing its earnings so quickly (estimated) that the forward p/e (fye 31-Dec-05) comes in at 17.98. Thus the PEG is only 1.16, and the Price/sales is a bit rich at 9.13.
Yahoo reports 835.08 million shares outstanding with 567.6 million of them that float. There are 14.18 million shares out short as of 6/7/04, representing 2.50% of the float, but only 1.942 trading days...so this isn't that much imho.
Yahoo reports NO cash dividends, but the company DID relatively recently split the stock 2:1 in November, 2003.
How about Technicals? Looking at a nice "Point & Figure" chart from Stockcharts.com:
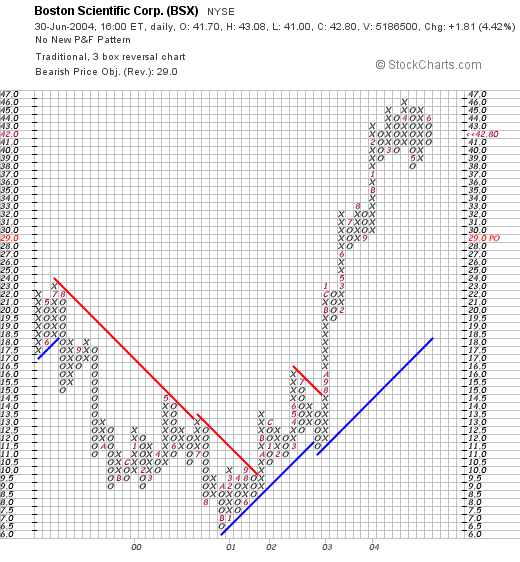
we can see that this stock, which traded lower from $24/share in July, 1999, dropped to a low of $6.5 in September 2000, only to climb steadily until breaking out in August 2003, when it broke through a resistance line of about $14.5 and has now traded very strongly higher....if anything maybe a bit ahead of itself.
What do I think? Well, the numbers are intriguing. The free cash flow is impressive, the valuation isn't that bad as long as the growth continues as the PEG is barely over 1.0. Technicals look nice as well. However, I would NOT write off J&J and their stent....and if that giant pharmaceutical firm every wakes up and stretches it big paws....relatively smaller fish like BSX may have to pay attention!
Thanks again for stopping by. It is getting late here, I posted the three posts I promised!....so off I go. If you have any questions, or comments, please feel free to email me at bobsadviceforstocks@lycos.com
Bob
Updated: Wednesday, 30 June 2004 11:06 PM CDT