Stock Picks Bob's Advice
Saturday, 9 September 2006
"Weekend Trading Portfolio Analysis" ResMed (RMD)
CLICK HERE FOR MY PODCAST ON RESMED!

Hello Friends! Thanks so much for stopping by and visiting my blog, Stock Picks Bob's Advice! As always, please remember that I am an amateur investor, so please remember to consult with your professional investment advisors prior to making any investment decisions based on information on this website.
One of the things I like to do on this blog is to share with you both ideas about investments that I am reviewing (my "stock picks") as well as let you know about the actual transactions I make (my "trading transparency"). A year or so ago, I thought I would add a regular review of stocks that I actually own...what I call my "Trading Portfolio". With only 11 positions, out of my maximum of 25 positions possible, I have been reviewing positions, going alphabetically, about every other week. Two weeks ago I reviewed Quality Systems (QSII). My next holding is ResMed (RMD).
 I currently own 150 shares of ResMed in my Trading Portfolio. RMD closed at $40.80 on September 8, 2006. These shares were purchased on 2/4/05, with a cost basis of $29.87. Thus I have an unrealized gain of $10.93 or 36.6% on these shares.
I have sold shares of ResMed twice since the original purchase. One portion at a 30% appreciation, and another at a 60% appreciation level. Thus, on the upside, I shall be selling approximately 1/6th of my position if the stock should reach a 90% appreciation at a price of 1.90 x $29.87 = $56.75. On the downside, the sale of all of my remaining shares would be at 50% of the highest sale point (my personal strategy) or at a 30% gain level (since the highest sale was at a 60% sale). Or all shares would be sold at 1.30 x $29.87 = $38.83. With ResMed pulling back from the latest sale, I am closer to a sale at the 30% level than a sale at a 90% appreciation target.
Let's take another look at this firm and see if it still deserves a spot on this website.
1. What does this company actually do?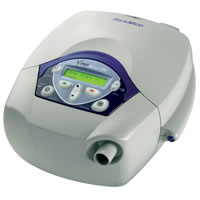
According to the Yahoo "Profile" on ResMed (RMD), the company
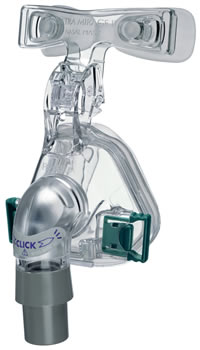
"... through its subsidiaries, engages in the design, manufacture, and marketing of equipment for the diagnosis and treatment of sleep-disordered breathing and other respiratory disorders, including obstructive sleep apnea. Its products include airflow generators; diagnostic products; mask systems; headgear; and other accessories, including humidifiers, cold passover humidifiers, carry bags, breathing circuits, Twister remote, the Aero-Click connection system, and the AeroFix headgear."
2. How did the company do in the latest quarter?
On August 17, 2006, ResMed reported their 4th quarter 2006 results. For the quarter ended June 30, 2006, revenue grew 36% to $171.2 million, up from $125.4 million the prior year same period. Diluted eps came in at $.30, up from $.22/share last year. Net income was $23.1 million, up sharply from $15.6 million in the same period the prior year.
3. How about longer-term results?
 Reviewing the Morningstar.com "5-Yr Restated" financials, we see a genuinely beautiful picture of steadily increasing revenue as represented by the increasing purple bars on the bar graph. Revenue has increased from $155.2 million in 2001 to $425.5 million in 2005 and $561.2 million in the trailing twelve months (TTM).
On a per-share basis, the company has reported earnings/share of $.18 in 2001, growing steadily and strongly to $.91/share in 2005 and $1.09/share in the TTM.
The company has not paid dividends and has increased the number of shares outstanding slightly from 63 million in 2001 to 69 million in 2005. 75 million shares were outstanding in the TTM. Thus, the float has grown about 16% from 2001 to currently, while revenue has almost gone up 400% and earnings are up more than 400% as well.
Free cash flow has been positive except for the latest twelve months. $34 million in free cash flow in 2003, $19 million in 2004, $31 million in 2005, and $(8) million in the TTM. The negative free cash flow reflects the large increase in capital spending in the latest twelve months.
ResMed's balance sheet looks solid as presented on Morningstar.com with $168.2 million in cash and $264.5 million in other current assets. Thus, the total current assets of $432.7 million when compared to the $110.5 million in current liabilities yields a current ratio of 3.92. (I generally conclude that ratios over 1.5 represent a healthy balance sheet from this particular perspective). The current assets can easily pay off the current assets and the $114.3 million in long-term liabilities combined....again supporting the healthy balance sheet of this company.
4. What about some valuation numbers on this stock?
Reviewing the data from Yahoo "Key Statistics" on RMD we find that this stock is a large mid-cap stock with a market capitalization of $3.08 billion. The trailing p/e is a fully-valued 35.02, with a foward p/e (fye 30-Jun-08) of 20.82. The (5-yr expected) PEG is a more reasonable 1.24.
Referring to the Fidelity.com eresearch website, we find that this stock is in the "Medical Appliances/Equipment" industrial group. Within this group, ResMed is the most 'expensive' relative to the Price/Sales ratio with a ratio of 5.6. Following RMD is Zimmer Holdings (ZMH) at 5, Medtronic (MDT) at 4.7, St. Jude (STJ) at 4.5, Biomet (BMET) at 4, and Edward Lifesciences (EW) at 3.
Examining the company for profitability, in terms of the Return on Equity (ROE), ResMed is actually one of the least profitable in its group with a ROE of 14.8%. Topping this group is Medtronic at 26.8%, followed by Biomet at 25%, Edwards Lifesciences at 16.6%, Zimmeer Holdings at 16.3%, St. Jude at 15.8% and then ResMed at the bottom of this group.
Yahoo reports that there are 75.41 million shares outstanding with 73.03 million shares that float. Currently 2.93 million shares are out short representing 4.10% of the float or 5.9 trading days of average volume. Using my own 3 day rule for the short ratio, this stock does appear to have a significant number of shares that have been already sold by short-sellers speculating that the stock will decline. In the event of good news we may see a bit of a squeeze of these short-sellers.
No dividend is paid and the last stock split was a 2:1 stock split on October 3, 2005.
5. What does the chart look like?
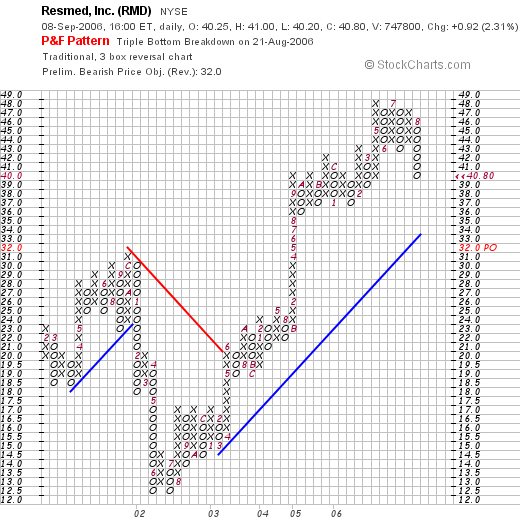
Reviewing the "Point & Figure" chart on RMD from StockCharts.com, we can see that although the stock has pulled back recently from its highs near $48, the stock is still well above its support level which would be down in the mid $30's. The stock did retreat from $30 in October, 2001, to a low of $13 in June, 2002, but since that time, the stock appears to be moving strongly higher.
6. Summary: What do I think about this stock? Reviewing some of the things discussed earlier, the company is trading currently a little below its recent highs. The latest quarterly report was quite strong, with both steady revenue and earnings growth. The Morningstar numbers look nice with steady revenue and earnings growth over the past five years with just a slight increase in the stock shares outstanding. Free cash flow was negative in the TTM, but otherwise has been positive. The balance sheet is solid. Valuation is a bit rich, but with the rapid growth in revenue and earnings, the PEG works out to a bit over 1.2. Price/Sales is rather rich, and the profitability (ROE) is less than stellar. Supporting the stock price, ironically, may be the relative large number of short-sellers placing bets on the stock. On a Peter Lynch perspective, the market for CPAP machines may continue to grow as the number of overweight individuals grows worldwide and our understanding of sleep apnea improves. I shall be staying with the stock and shall be selling based on the price performance of the shares.
Thanks so much for stopping by and visiting! If you have any comments or questions, please feel free to email me at bobsadviceforstocks@lycos.com and also please be sure to stop by and visit my Stock Picks Podcast Site.
Bob
Posted by bobsadviceforstocks at 6:41 PM CDT
|
Post Comment |
Permalink
Updated: Saturday, 9 September 2006 11:31 PM CDT
"Looking Back One Year" A review of stock picks from the week of May 9, 2005

Hello Friends! Thanks so much for stopping by and visiting my blog, Stock Picks Bob's Advice! As always, please remember that I am an amateur investor, so please remember to consult with your professional investment advisors prior to making any investment decisions based on information on this website.
Once again it is the weekend! And one of the tasks I like to perform around this website is to check back on prior stock picks and see how they turned out! Last Week I reviewed the week of May 2, 2005. This afternoon, I would like to take a look at those stocks selected for inclusion from the week of May 9, 2005.
Please note that this review assumes a buy and hold strategy of investing. My analysis assumes an equal dollar purchase of each of the stocks selected that week. Currently I employ an active portfolio management system that sells declining stocks quickly at small losses and sells portions of appreciating stocks at targeted appreciation points. This difference in strategy would certainly affect a portfolio performance in practice. Also please recall that past performance is never a guarantee of future performance whether you are looking at a mutual fund or an individual equity or any investment actually!
 On May 9, 2005, I posted Part Technology (PTC) on Stock Picks Bob's Advice when the stock was trading at $22.17. PTC had a 3:2 stock split on January 9, 2006 making my effective stock pick price $14.78. PTC closed at $8.88 on September 8, 2006, for a loss of $(5.90) or (40)% since the stock pick.
 On July 26, 2006, PAR announced 2nd quarter 2006 results. Revenues came in at $53.3 million, a 4% increase over the $51.2 million reported in the same period the prior year. Net income, however, dipped to $2.34 million this quarter from $2.35 million in the prior year. On a per share basis, this was flat at $.16/share, unchanged from $.16/share last year.
 On May 11, 2005, I posted Varian Medical Systems on Stock Picks Bob's Advice when the stock was trading at $35.10. Varian closed at $52.63 on September 8, 2006, for a gain of $17.53 or 50%.

On July 26, 2006, Varian reported 3rd quarter 2006 results. Revenues grew 14% to $396 million from $347 million in the same period last year. Net earnings climbed to $65.7 million, up from $51.1 million last year. On a diluted share basis this worked out to $.49/share this year vs. $.37/share in the same period last year.
 Finally, on May 12, 2005, I posted Pall Corporation (PLL) on Stock Picks Bob's Advice when the stock was trading at $28.58. Pall closed at $27.20 on September 8, 2006, for a loss of $(1.38) or (4.8)% since posting.
On June 1, 2006, Pall announced 3rd quarter 2006 results. While revenue came in at $510 million, up from $493.5 million, this was actually shy of expected revenue of $515 million. Earnings, however, came in at $.20/share, down from $.35/share last year in the same period. This was also far short of analysts expectations of $.38/share.
So how did I do with these three stock picks from that week in May, 2005? In a word, mediocre. I had one terrific stock pick, Varian, one awful pick, Part Technology, and a mediocre pick in Pall. The average performance for the three stocks worked out to a gain of 1.7%. Nothing really to write home about I guess.
Thanks again for visiting! If you have any comments or questions, please feel free to leave them on the blog or email me at bobsadviceforstocks@lycos.com. Also, please remember to stop by and visit my Stock Picks Podcast Site where I occasionally make time to talk about and not merely write about these stocks!
Bob
Tuesday, 5 September 2006
"Revisiting a Stock Pick" NVE Corporation (NVEC)
Hello Friends! Thanks so much for stopping by and visiting my blog, Stock Picks Bob's Advice! As always, please remember that I am an amateur investor, so please remember to consult with your professional investment advisors prior to making any investment decisions based on information on this website.
I didn't manage to make any stock 'picks' last week and am anxious to find some stocks that are provocative enough to find a place on this website. Looking through the list of top % gainers on the NASDAQ this afternoon, I came across an old favorite of mine, NVE Corporation (NVEC) which had a nice day in the market.
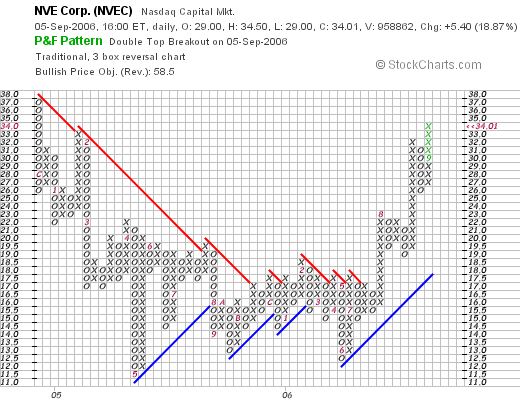
 I first posted NVEC on Stock Picks Bob's Advice on June 23, 2004, when the stock was trading at $36.61. NVEC closed today at $34.01, up $5.40 or 18.87% on the day. The stock is actually lower than it was when I first posted it by $(2.60) or (7.1)%. After the initial posting of this stock, the price of the stock actually took a nosedive (!) and is only now reaching the previous price levels.
Let's take a closer look at this company and I will explain why I still like this stock after it failed to cooperate at my first post over two years ago:
1. What exactly does this company do?
According to the Yahoo "Profile" on NVEC, the company
"... engages in the development and sale of devices using spintronics, a nanotechnology, which utilizes electron spin rather than electron charge to acquire, store, and transmit information. Its products include magnetic sensors to acquire precise data, such as the position of a robot arm, and couplers to transmit data between electronic systems at a high speed. The company provides standard sensors that detect the presence of a magnet or metal to determine position or speed; custom sensors primarily for medical devices; and couplers that use semiconductor input stages, primarily for factory and industrial networks."
Please don't ask me to explain the above hi-tech explanation :). I am not really a Peter Lynch investor! I pick stocks not on the basis of what I know about their product but what I know and can glean about their corporate performance.
2. How did they do in the latest quarter?
On July 19, 2006, NVE Corporation reported 1st quarter 2007 results. Product sales climbed 71% to $3.05 million from the prior year first quarter results of revenue of $1.78 million. Total sales increased 20% to $3.64 million from $3.03 million. Net income was up over 100% at $891,806 or $.19/share up from net income of $412,649 or $.09/diluted share the prior year same period.
3. How about longer-term results?
If we review the Morningstar.com "5-Yr Restated" financials on NVEC, we can see that revenue has grown nicely from $7 million in 2002 to $12.2 million in 2006 and $12.8 million in the trailing twelve months (TTM).
Except for a dip in earnings between 2004 and 2005, earnings per share have grown steadily from a loss of $(.62)/share in 2002 to $.39/share in 2006 and $.49/share in the trailing twelve months (TTM). This is a small company with 4 million shares outstanding in 2004 increasing to 5 million in the TTM.
Free cash flow which was $-0- in 2004, increased to $3 million in 2006. The balance sheet appears solid on Morningstar, with $2.5 milliion in cash, enough to pay off the $700,000 in current liabilities. No long-term liabilities are even reported on the Morningstar report.
Calculating the 'current ratio', adding the $2.5 million in cash to the $5.9 million in other current assets gives us total current assets of $8.4 million, which when compared to the current liabilities of $.7 million yields a current ratio of 12. Generally ratios of 1.5 or higher are considered financially 'healthy'.
4. What about some 'valuation' numbers?
Reviewing the Yahoo "Key Statistics" on NVE Corporation, we can see that this is a really small small-cap stock with a market capitalization of only $156.99 million. (At $100 million in market cap or less, I like to refer to these tiny companis as 'micro'-cap stocks).
The trailing p/e is rich at 69.69. There is no forward p/e and no PEG to assess valuation. I suspect this company is below the radar of most analysts.
Review the Fidelity.com eresearch website for more valuation comparisons on NVEC, we find that this company is in the "Semiconductor-Specialized" industrial group. Within this group, NVEC is the richest in valuation relative to the Price/Sales ratio with a ratio of 10.5. This is followed by Linear Technology (LLTC) at 10.1, Altera (ALTR) at 6.6, Xilinx (XLNX) at 4.4, Nvidia (NVDA) at 4.4, and ATI Technologies (ATYT) at 2.4.
NVEC is in the middle of the group in terms of profitability when measured by the Return on Equity (ROE). Topping the group is Nvidia at 23.1%, Altera at 20.9%, Linear Technology at 20.2%, then NVE Corp at 14.2%, Xilinx at 13.2% and ATI Technologies at the bottom of the pack at a negative (3.3)%.
Returning to Yahoo for a few additional valuation numbers, we find that there are 4.62 million shares outstanding and 4.25 million that float. Of these shares, 1.02 million shares or 22.70% of the float were out short as of 8/10/06. The sharp upward rise in the stock price today might well represent a short squeeze in which the large number of short sellers might be in a buying panic as the stock rises and paradoxically increases their losses. No dividend is paid and the last stock split was actually a reverse stock split of 1:5 on 11/22/02.
5. What does the chart look like?
Reviewing the "Point & Figure" chart from StockCharts.com on NVEC, we can see that the stock has mad a "u-shaped" chart with the stock declining from $37 level in late 2004 and bottoming at around $11.50 in May, 2005. The stock recently came out of this trough after breaking through resistance at $17 in July, 2006, and appears to be moving strongly higher now.
6. Summary: So what do I think about this stock?
In summary, this stock had a strong recent quarter. I cannot completely explain today's move except that a move higher may well have resulted in a panic among the short-sellers trying to cover their positions. The Morningstar.com financials look nice. Valuation, however, is a bit rich with a p/e in the 60's and a Price/Sales ratio at the top of its group. Technically, the stock looks strong with the stock price moving higher into near new-high territory. I don't have any shares of this stock, but if I were in a position to be buying stock, this is the kind of stock I would be adding to my portfolio.
Thanks so much for stopping by and visiting my blog! If you have any comments or questions, please feel free to email me at bobsadviceforstocks@lycos.com and be sure to listen to my Stock Picks Podcast!
Bob
Monday, 4 September 2006
"Looking Back One Year" A review of stock picks from the week of May 2, 2005
Hello Friends! Thanks so much for stopping by and visiting my blog, Stock Picks Bob's Advice! As always, please remember that I am an amateur investor so please remember to consult with your professional investment advisors prior to making any investment decisions based on information on this website!
Please excuse my absence from blogging this past week. Certainly if I have any trades in my trading portfolio, I shall post them. In addition, I plan on continuing to peruse the lists of stocks on the move, and shall continue to post new ideas.
One of my weekend 'tasks' is to examine past stock picks and see how they turned out. For the sake of this review, I employ an assumed "buy and hold" strategy. In practice, I sell my declining stocks quickly and completely and sell my gaining stocks slowly and partially.
 On May 2, 2005, I posted Moldflow (MFLO) on Stock Picks when the stock was trading at $13.93. On September 1, 2006, MFLO closed at $12.33 for a loss of $(1.60) or (11.5)%.
On August 10, 2006, Moldflow reported 4th quarter 2006 results. Revenue came in at $17.1 million, down (6)% from the same period last year when the company reported $18.3 million in revenue. Net income for the quarter came in at a loss of $(.04)/share, down from a profit of $.12/share the prior year.
 On May 3, 2005, I posted Amedisys (AMED) on Stock Picks Bob's Advice when the stock was trading at $33.84. AMED closed at $40.18 on September 1, 2006, for a gain of $6.34 or 18.7% since posting.
On August 1, 2006, Amedisys reported 2nd quarter 2006 results. For the quarter ended June 30, 2006, the company reported service revenue of $132.9 million. This was a 66% incrfease over $80.1 million reported in the comparable period the prior year. Net income came in at $9.1 million or $.55/share, up 10% from the $7.9 million or $.50/share the prior year.
 On May 6, 2005, I posted Multi-Color Corporation (LABL) on Stock Picks Bob's Advice when it was trading at $23.60. LABL closed at $29.89 on September 1, 2006, for a gain of $6.29 or 26.7% since posting.
LABL announced first quarter 2007 results on July 21, 2006. Net sales increase 11% to $51.7 million from $46.7 million in the same quarter last year. Net income grew 30% to $2.5 million from $1.9 million. On a per share basis, earnings grew 28% to $.37/diluted share, up from $.29/diluted share last year.
 On May 5, 2005, I posted Education Management Corporation on Stock Picks Bob's Advice when it was trading at $27.97. Education Management (EDMC) was acquired by Providence Equity Partners and Goldman Sachs Capital Partners for $43.00/share in cash. This acquisition was completed in Summer, 2006, and the shares no longer trade. However, this acquisition represented a gain of $15.03 or 53.7% since posting on the blog.
So how did I do picking stocks that week in May, 2005? Pretty good imho :). There were four stock selections made and one declined and the three others advanced for an average gain of 21.9% on these stocks.
Please remember that past performance is not a guarantee of future performance.
Thanks so much for stopping by and visiting! If you have any comments or questions, please feel free to drop me a line at bobsadviceforstocks@lycos.com. Also, remember to visit my Stock Picks Podcast site!
Bob
Posted by bobsadviceforstocks at 1:28 PM CDT
|
Post Comment |
Permalink
Updated: Monday, 4 September 2006 1:30 PM CDT
Sunday, 27 August 2006
Rothstein Recognizes "Stock Picks"!
I had a nice email from Juliana Kim from Rothstein Asset Management, LP, who noted that Jack Rothstein has nominated Stock Picks Bob's Advice for recognition as one of the best Stock Market Blogs. This note is certainly very much appreciated!
If you haven't visited Jack's blog at Wealthcast.com, consider stopping by to read what Jack has to say. He is bright, a true professional (unlike my amateur status!), and writes a very comprehensive and insightful column. I have been linking to him for quite awhile and Jack has been kind enough to link to me as well!
Full Disclosure: Kim says that if Stock Picks is recognized by Rothstein as an outstanding stock blog, I might be eligible to receive an iPod. With three kids of my own, an iPod will be a big hit around this household.
If you have a blog that you would like me to review or link to, please feel free to drop me a line at bobsadviceforstocks@lycos.com and I will give it a look!
Bob
Saturday, 26 August 2006
ICT Group (ICTG)
CLICK HERE FOR MY PODCAST ON ICT GROUP!
Hello Friends! Thanks so much for stopping by and visiting my blog, Stock Picks Bob's Advice! As always, please remember that I am an amateur investor, so please remember to consult with your professional investment advisors prior to making any investment decisions based on information on this website.
As I have done previously, I should like to once again apologize for my two week absence. It is a bit strange apologizing to anonymous people who read my blog, but I still feel a connection with all of you who have become regular readers here...who are sharing with me my own exploration of stocks and working to develop a coherent strategy in selecting and owning equities. But before I was philosophic, let me share with you a stock that deserves a place in this blog.
 As I like to do on most trading days, I reviewed the list of top % gainers on the NASDAQ from yesterday. I generally stay away from stocks much under $10....leaving just a few to examine with some of my screening techniques.
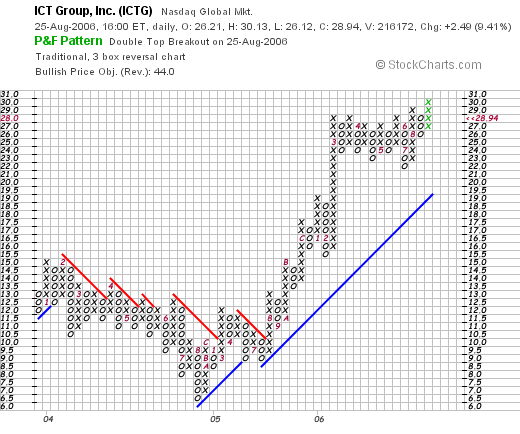
ICT Group (ICTG) had a nice day yesterday, closing at $28.94, up $2.49 or 9.41% on the day. I do not own any shares nor do I have any options on this stock. Let's take a closer look at this company and I shall try to show you why I find it worthy of a review.
1. What exactly does the company do?
According to the Yahoo "Profile" on ICTG, the company
"... and its subsidiaries provide outsourced customer management and business process outsourcing solutions. The company offers a mix of sales, service, marketing, and technology solutions, which include customer care/retention, technical support and customer acquisition, and cross-selling/upselling, as well as market research, database marketing, data capture/collection, email management, collections, and other back-office business processing services."
2. What about the latest quarterly report?
On July 27, 2006, ICT group reported 2nd quarter earnings results. For the quarter ended June 30, 2006, revenue increased 15% to $111.3 million from $97 million in the same quarter last year. In addition, net income came in at $3.9 million or $.25/share, up from $1.7 million or $.14/diluted share in the year ago period. According to the same news story, the company beat expectations by $.04/share. In addition, the company raised guidance to $1.08 to $1.13 for the full year on sales of $445 to $451 million. In April, 2006, guidance was $1.03 to $1.09/share on revenue of $440 to $448 million. While not a huge guidance higher, the fact the company beat expectations and also raised guidance for the full year is very significant imho.
3. How about longer-term results?
Reviewing the Morningstar.com "5-Yr Restated" financials on ICTG, we can see a fairly steady growth in revenue (except for a small dip between 2001 and 2003) from $239.3 million in 2001 to $401.3 million in 2005 and $434.7 million in the trailing twelve months. Earnings, however, have been more erratic, dropping from $.63/share in 2001 to a loss of $.21/share in 2004. Since 2004, earnings have come in at $.94/share in 5006 and $1.18 in the trailing twelve months. The number of shares outstanding has increased modestly from 12 million in 2001 to 13 million in 2005 and 15 million in the trailing twelve months (TTM).
Free cash flow which was negative at $(4) million in 2003 and $(12) million in 2004, turned positive at $5 million in 2005 and grew to $6 million in the TTM.
The current assets total $125.6 million, which could easily pay off all of the current liabilities listed as $40.1 million and the $4.1 million of long-term liabilities combined. Calculating the 'current ratio' yields a value of 3.13 suggesting a picture of financial health. This is especially true in light of the nominal long-term liabilities listed as $4.1 million on Morningstar.com.
4. What about some valuation numbers?
Using Yahoo "Key Statistics" on ICT Group, we observe that the company is a small cap stock with a market capitalization of only $445.50 million. The trailing p/e is a moderate 24.74 and the forward p/e (fye 31-Dec-07) works out to 20.82. The PEG is also reasonable (imho) at 1.20.
As noted by the Fidelity.com eresearch website, this company is in the "Business Services" industrial group. Within this group, this stock is the most reasonably priced in regards to the Price/Sales ratio with a ratio of 1. This group is led by Getty Images (GYI) with a Price/Sales ratio of 3.6. Getty is followed by Global Payments (GPN) with a ratio of 3.3, Choicepoint (CPS) at 3, Fidelity National Information Services (FIS) at 2.8, Cintas (CTAS) at 1.8 and finally ICT Group with a ratio of 1.
Profitability, as measured by the "Return on Equity" (ROE), shows that while ICTG is relatively cheap when measured by Price/Sales; the company is actually quite profitable with an ROE of 16.6%. This is only exceeded by Global Payments at 18.1%, and followed by Cintas with a result of 15.3%, Choicepoint at 12.9%, Getty at 11.6% and Fidelity National Information Services with a result of 9.6%.
Returning to Yahoo for a few more statistics, we see that there are only 15.39 million shares outstanding and only 6.39 million of them float. Currently there are 364.06 thousand shares out short representing 4% of the float and a short ratio of only 3.6. The short-sellers do not appear to be very significant in this stock.
No cash dividends and no stock dividends are reported on Yahoo.
5. What does the chart look like?
If we review the "Point & Figure" chart on ICTG from StockCharts.com, we can see the decline in the stock price from $14 in February, 2004, to a low of $6.50 in August, 2004. The stock subsequently has been trading higher to the $28 level in March, 2006. Consolidating at this level, it now appears to be moving higher to new price levels.
6. Summary: What do I think about this stock?
In summary, I like this stock due to the strong price move Friday (yesterday) in an otherwise anemic trading environment. The last quarter's results were strong with both increasing revenue and earnings and the company did beat expectations as well as raise guidance!
The Morningstar.com report shows a company turning itself around, from losses to increasing profits while growing its revenues at the same time. The number of shares outstanding is fairly stable, and the free cash flow picture also shows the negative free cash flow becoming positive and increasing in size. Balance-sheet-wise, the company has lots of current assets, almost no long-term liabilities and a current ratio of over 3. Valuation-wise, the p/e is barely over 20, the PEG is at 1.2, and while the Price/Sales ratio is one of the lowest in its industrial group, the profitability of the company, as measured by ROE is one of the highest in the same group....a nice combination of results.
Finally, the chart looks strong, and the company appears to be moving into new high territory.
So there are lots of things I like about this company. I am not exactly sure of their business :), but it appears that they are doing quite well.
Thanks again for stopping by and visiting! If you have any comments or questions, please be sure to email me at bobsadviceforstocks@lycos.com. If you get a chance, please also feel free and know you are invited to listen to my Stock Picks Podcast, where I discuss many of the same stocks and investment strategy as I like to discuss on this blog!
Bob
Posted by bobsadviceforstocks at 8:06 PM CDT
|
Post Comment |
Permalink
Updated: Sunday, 27 August 2006 4:50 PM CDT
Quality Systems (QSII) "Weekend Trading Portfolio Analysis"
Hello Friends! Thanks so much for stopping by and visiting my blog, Stock Picks Bob's Advice! As always, please remember that I am an amateur investor, so please remember to consult with your professional investment advisors prior to making any investment decisions based on information on this website.
It has been a few weeks since my last portfolio review. On August 5, 2006, I reviewed my Morningstar holding on this blog. With the many sales I have had in my trading portfolio, I am now down to 11 positions, and going alphabetically through my portfolio, I am up to Quality Systems (QSII) which happens to be my most successful investment in my account.
I currently own 88 shares of Quality Systems (QSII) which closed at $39.51 on August 25, 2006. These shares were purchased with a cost basis of $7.75/share, acquired on 7/28/03. Thus, I have an unrealized gain of $31.76/share or 409.8% since purchase. As has been my practice, I have been selling portions of QSII as the stock has been appreciating. I have sold portions on 8/19/03, 8/22/03, 1/21/04, 2/1/05, 3/4/05, 4/21/05, 8/16/05, 10/3/05 and 11/22/05. These nine sales represent sales at 30%, 60%, 90%, 120%, 180%, 240%, 300%, 360%, and 450% appreciation levels. Thus, on the upside, my next targeted gain is at a 540% level which works out to 6.40 x $7.75 = $49.60. On the downside, my strategy dictates a sale at 50% of the highest appreciation point or at a 225% gain level = 3.25 x 7.75 = $25.19. Unfortunately, many of my earlier sales were 25% of my remaining position causing my position to diminish in size. I am now at a 1/6th of the remaining position at each targeted gain, and hopefully this position will continue to grow in size as the stock appreciates.
Let's take a closer look at this stock and see if it still deserves to be on this blog:
1. What does this company do?
According to the Yahoo "Profile" on QSII, this company
"... and its subsidiary NextGen Healthcare Information Systems, Inc. engage in the development and marketing of healthcare information systems that automate medical and dental practices, physician hospital organizations and management service organizations, ambulatory care centers, community health centers, and medical and dental schools."
2. How did they do in the latest quarter?
On August 3, 2006, Quality Systems reported results for first quarter 2007. Net revenues came in at $36.1 million, up 32% from $27.4 million in the same quarter the prior year. Net income worked out to $7.7 million, up 51% over the net income of $5.1 million in the prior year same period. Fully diluted earnings were $.28/share, up 47% from the $.19/share reported last year. This exceeded analysts' expectations of $.24/share.
3. What about longer-term financial results?
Reviewing the Morningstar.com "5-Yr Restated" financials on QSII, we can see the beautiful picture of steady revenue growth with revenue of $44.4 million in 2002, growing to $119.3 million in 2006 and $127.9 million in the trailing twelve months (TTM).
Earnings have also steadily grown from $.21/share in 2002 to $.85/share in 2006 and $.94/share in the trailing twelve months. The company stqarted paying dividends in 2005 with $.75/share paid. This was increased to $.88/share in 2006. The company has slightly increased its outstanding shares from 24 million in 2002 to 27 million in the TTM. This 10% increase in shares during a period in which the company almost tripled its revenue and quadrupled its earnings is quite tolerable :).
The picture of free cash flow has also been very nice with $16 million in 2004 increasing to $28 million in 2006 and $32 million in the TTM.
The balance sheet is solid with $67 million in cash, more than enough by itself to pay off both the $50.2 million in current liabilities and the $3.5 million in long-term liabilities combined. Calculating the 'current ratio' we can see that QSII has a combined $112.5 million in total current assets, which, when compared to the $50.2 million in current liabilities yields a current ratio of 2.24. (Anything over 1.5 is generally considered 'healthy').
4. What about some 'valuation numbers' on this stock?
Taking a look at the Yahoo "Key Statistics" on QSII we see that this is a mid-cap stock with a market capitalization of $1.06 billion. The trailing p/e is a bit rich at 41.81, but the forward p/e (fye 31-Mar-08) is a bit nicer at 27.06. But then again, this is going out to 2008! However, analysts appear to be expecting continued rapid growth in earnings as the PEG on this stock is a very nice 0.98.
According to the Fidelity.com eresearch website, QSII is in the "Healthcare Information Services" industrial group. Within this group, Quality Systems is the 'priciest' of the group with a Price/Sales ratio of 8.4. Following QSII is Merge Technologies (MRGE) at 3.4, Cerner (CERN) at 2.9, Emdeon (HLTH) at 2.5, Eclipsys (ECLP at 2 and Trizetto Group (TZIX) at 1.8.
Fortunately, QSII is also the most profitable of the group with a Return on Equity (ROE) of 32.9%. Following Quality Systems is Trizetto at 23.1%, Cerner at 12.7%, Emdeon at 7.2%, Eclipsys at 2.1% and Merge at 0.3%.
Returning to Yahoo, we find that there are 26.74 million shares outstanding with 16.85 million that float. Of these, there were 3.49 million shares out short as of 7/11/06, representing 20.7% of the float or 11.7 trading days of volume (the short ratio). Using my own 3 day rule on short interest, I find that this large level of short interest may well support this stock in the event of any good news with a 'squeeze' of the shorts possible.
The company has a trailing dividend of $.88/share yielding 2.20%. The last stock split was a 2:1 stock split on 3/27/06.
5. What does the chart look like?
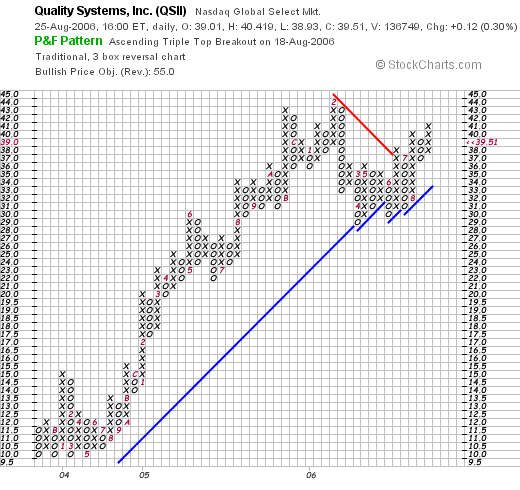
If we examine the "Point & Figure" chart on QSII from StockCharts.com, we can see that the stock moved strongly higher from $10/share in late 2003, (about the time I purchased shares) to a high of $44/share in February, 2006. The stock pulled back to the $30 level in April, 2006, and has been finding support at this level before breaking through resistance and moving near the old highs. The stock looks strong to me!
6. Summary: what do I think about this stock?
First of all, I own this stock have watched the stock price quadruple over the last three years. So certainly I am biased! And there is of course no guarantee that the stock price will continue to rise! THAT is why I have and shall continue to take small portions of my investment off the table as this and any of my stocks appreciate!
However, the last quarter's earnings report is solid. The company is in the EMR (electronic medical record) field, and is at the cutting edge of the transition from paper records in the medical field to electronic records. Thus the "story" is compelling as well as the numbers. The Morningstar.com report is beautiful without even a blemish with steady revenue, earnings, and free cash flow growth. The balance sheet is solid with lots of cash. Valuation-wise, the p/e is certainly rich above 40, but the PEG is under 1.0 making the valuation seem reasonable. The Price/Sales ratio is rich compared to other stocks in its group, but the company is also the most profitable in terms of the ROE figure of its group. Interestingly, there are lots of short-sellers out there who have borrowed shares to sell this stock and now may have to scramble to find shares to cover their sales if the stock should continue to rise on any good news.
Even the chart looks nice, as the stock has now consolidated for a few months and now appears to be once again moving higher. There is little, imho, to discourage me on this particular stock, but I always remain poised to sell my shares on fundamental negative news or on negative price performance.
Thanks so much for stopping by and visiting. Once again I apologize for my absence from this website, but if I get a chance, I shall have to share with you my vacation experience. In any case, if you have any comments or questions, please feel free to email me at bobsadviceforstocks@lycos.com and feel welcome to visit and listen to me on my Stock Picks Podcast Site!
Bob
"Looking Back One Year" A review of stock picks from the week of April 25, 2005
Hello Friends! Thanks so much for stopping by and visiting my blog, Stock Picks Bob's Advice! As always please remember that I am an amateur investor, so please remember to consult with your professional investment advisors prior to making any investment decisions based on information on this website!
I am glad to be back blogging after being away for a couple of weeks. Thank you so much for rechecking with me after my absence. I know so little about all of you readers but I assume there are some of you who regularly stop by to read what I have to write. For all of you regulars, your loyalty is appreciated. For those of you who are new to this website, well welcome and make yourself at home!
One of those things that I regularly try to do around here is to review past stock picks and find out how they turned out. This review assumes a "buy and hold" strategy assuming buying equal dollar amounts of the stock picks the day they were selected and holding without concern for stock appreciation or loss. This isn't what I actually recommend for my own stock purchases. I employ a disciplined buying and selling strategy involving the quick sale of declining stocks at an 8% loss and the partial sales of gaining stocks at targeted appreciation points. However, for the sake of this review, and to continue my past review practices, this is what I use for evaluation.
I should also point out that when I started this review process some years back (!), I actually was a year out. Missing weeks here and there, I am now, as you can see, almost 1 1/2 years out from my picks and reviews.
 On April 29, 2005, I posted CNS (CNXS) on Stock Picks Bob's Advice when it was trading at $18.09. CNXS closed at $27.88 on August 25, 2006, for a gain of $9.79 or 54.1% since posting.
On August 2, 2006, CNXS reported 1st quarter 2007 results. Net sales came in at $29.3 million for the quarter, up 25% from $23.5 million the prior year. Net income, however, for the quarter came in at $3.5 million or $.24/diluted share down from $4.0 million or $.27/share in the same quarter last year. Certainly the growth in revenue was solid, as has been the stock performance since my "pick"; however, due to the decline in earnings, I have to assign this stock a "thumbs-down". (Stocks only get "thumbs-up" on these reviews if both the earnings and revenue have improved.
 On April 27, 2005, I posted Hologic (HOLX) on Stock Picks Bob's Advice when it was trading at $35.85. HOLX had a 2:1 stock split December 1, 2005 and another 2:1 stock split March 26, 2006. Thus, my effective pick price was actually $35.85 x 1/2 x 1/2 = $8.96. HOLX closed at $42.21 on August 25, 2006, for a gain on this pick of $33.25 or 371%! (Every once in a while it is nice to smack one out of the park!)
On July 25, 2006, Hologic announced third quarter fiscal 2006 results. Revenues totalled $119.7 million, a 62% increase over revenues of $74 million in the same quarter in 2005. Net income came in at $12 million or $.25/share, up sharply from $8.2 million or $.18/share reported in the same quarter in 2005.
So how did we do during that week picking stocks? Well in a word, PHENOMENAL! (I do not always do so well, but it is nice to have a great week picking stocks don't you think? Please remember that I am an amateur and that past performance is NOT a guarantee of future performance!) I had two stocks that week, one gained 54.1% and the other gained 371%, for an average appreciation of 212.5%. What a week that was. If only investing was always that successful!
Thanks again for visiting! I am glad to be back blogging and look forward to your comments, questions, and thoughts, at bobsadviceforstocks@lycos.com. Also, when you get a chance, stop by and visit my Stock Picks Podcast Site where you can also hear me talk about many of the same stocks I write about here on the blog. Regards!
Bob
Monday, 21 August 2006
A Short Break....back in a few days
Friends, I am away from my computer for a few days. I haven't posted for a week....but I shall be back and ready to go in a while. Regards and I promise to be back blogging this time next week!
Bob
Monday, 14 August 2006
August 14, 2006 Sonic Corp. (SONC)
Hello Friends! Thanks so much for stopping by and visiting my blog, Stock Picks Bob's Advice! As always, please remember that I am an amateur investor, so please remember to consult with your professional investment advisors prior to making any investment decisions based on information on this website.
The market is up strongly today on news that the cease-fire in the middle east appears to be holding. As I write, the Dow is up 97.89 at 11,185.92, and the NASDAQ is at 2087.35, up 29.64. Hopefull the move towards a peaceful resolution will hold, and oil prices will continue to pull back.
I was looking through the list of top % gainers on the NASDAQ earlier today and came across Sonic Corp. (SONC) which is currently trading at $21.75, up $2.02 or 10.24% on the day. I do not own any shares of Sonic nor do I have any options on this stock.
 What appears to be driving the stock higher today was the announcement on Friday of a potential 'buy-back' of up to 30% of the outstanding shares by the company. I found this news story that explains some of the reasons why companies buy back their shares. This article points our the three main reasons why a company buy-back is helpful in boosting share prices of its stock: 1) with less shares outstanding, earnings per share are boosted numerically, 2) the buy-back is in itself a form of purchasing support for the price...the old supply and demand principle, driving stock prices higher, and 3) the buy-back demonstrates management confidence in the value of the stock price itself. In any case, the market liked the news, and the stock price is moving strongly higher today.
What exactly does this company do?
 According to the Yahoo "Profile" on SONC, Sonic
"...engages in the operation and franchising of a chain of quick-service drive-ins in the United States and Mexico. The company, through its subsidiary, Sonic Industries, Inc., serves as the franchiser of the Sonic restaurant chain. It’s another subsidiary, Sonic Restaurants, Inc., develops and operates the company-owned restaurants. As of August 31, 2005, Sonic Corp. had 3,039 Sonic Drive-Ins, including 574 Partner Drive-Ins and 2,465 Franchise Drive-Ins."
How did Sonic do in the latest reported quarterly result?
On June 20, 2006, Sonic reported 3rd quarter 2006 results. For the quarter ending in May, 2006, sales grew 11% to $186.5 million from $167.7 million last year. Net income came in at $23.8 million, or $.27/share, up from $21.3 million or $.23/share in the same period in 2005. According to the news story, analysts per Thomson Financial had forecast earnings of $.26/share on revenue of $189.7 million. Thus, the company beat expectations on the earnings side and under-performed on revenue growth. Same-store sales increased 4.3% during the quarter. Providing some guidance, Sonic forecast profit of $.28 to $.29/share in the upcoming 4th quarter. This was a little ahead of the $.28/share which had been the consensus of analysts. Thus the company raised guidance.
How about longer-term financial results?
When we review the Morningstar.com "5-Yr Restated" financials on SONC, we can see a very nice picture of steady revenue growth with $331 million reported in 2001, steadily increasing to $623 million in 2005 and $676 million in the trailing twelve months (TTM).
Earnings have also been steadily improving with $.41/share reported in 2001 increasing to $.81/share in 2005 and $.89/share in the TTM.
The number of shares outstanding, which will apparently be decreasing, has been steady with 89 million in 2001, 90 million shares in 2005 and 85 million in the TTM.
Free cash flow is also impressive, with $36 million in 2003, increasing to $46 million in 2005 and $52 million in the TTM.
SONC's balance sheet is the only area of question on this page imho. The company has $25.4 million in cash and $29.5 million in other current assets. This is not in itself enough to cover the $80.7 million in current liabilities, and the resultant 'current ratio' works out to an anemic .68. Generally, a ratio of 1.5 is considered healthy as this review points out. In light of the healthy and growing free cash flow, this doesn't appear to be a big problem for Sonic, but it is something we shouldn't ignore either.
What about some Valuation Numbers for this stock?
Reviewing Yahoo "Key Statistics" on Sonic, we can see that this company is a mid-cap stock with a market capitalization of $1.86 billion. The trailing p/e is a moderate 24.29, with a forward p/e (fye 31-Aug-07) estimated at an even more reasonable 21.31. The PEG ratio is estimated by Yahoo at 1.28 (5 yr expected results). Generally, PEG ratios between 1.0 and 1.5 are "reasonable", under 1.0 are great, and over 1.5 are less attractive. This is a brief review of this ratio.
Using information from the Fidelity.com eresearch site on SONC, we can see that Sonic is in the "Restaurants" industrial group. Within this group, as measured by the Price/Sales ratio, Sonic is richly valued, leading the group with a ratio of 2.6, this is followed by McDonald's (MCD) at 2, Applebee's (APPB) at 1.1, Darding Restaurants (DRI) at 0.9, Brinker (EAT) at 0.7, and OSI Restaurant Partners (OSI) at 0.6.
Insofar as profitability is concerned, if we look at the Return on Equity (ROE) figures, we find that Sonic fortunately is one of the more profitable restaurants with an ROE of 21.1%. This is exceeded by Darden at 27.1% and following Sonic is Applebee's at 20%, McDonald's at 18.5%, Brinker at 18.2% and OSI at 10%.
Finishing up the Yahoo numbers, we see that there are 85.4 million shares outstanding with 81.93 million that float. Currently, there are 6.25 million shares (7/11/06) out short, representing 7.70% of the float or 7.2 trading days of volume. This short ratio over 3, is in my opinion, significant. Thus, with the stock moving higher today on an announcement of a stock buy back, these traders who have already sold shares and are looking to buy cheaper, might well be "squeezed" by the buying pressure.
No cash dividend is reported on Yahoo and the last stock split was a 3:2 split, just happening, on May 1, 2006.
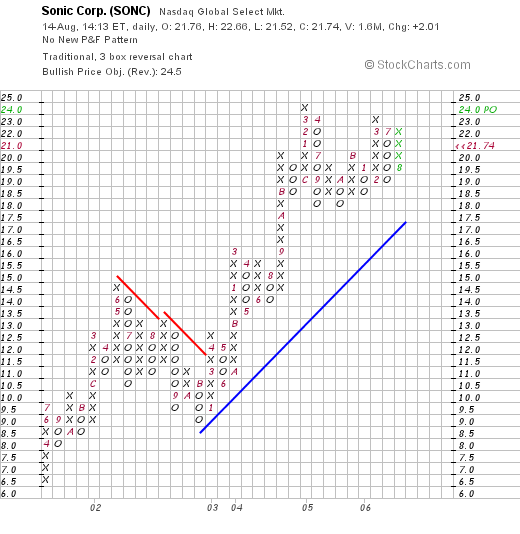
And what does the chart look like?
If we review the "Point & Figure" chart on Sonic from StockCharts.com, we see what appears to me to be a strong graph, which, after some mild weakness in 2002, when the stock fell from $14.50 in June to a low of $8.50 in November, the stock has been trading steadily higher, currently approaching but under its high of $24.00 hit in March, 2005. The chart looks just fine to me.
Summary: So what do I think of this stock?
Let's review some of the above discussion. First of all the stock is moving higher on a nice announcement of a big stock buy-back from management. Less shares outstanding should mean better results, and the buying pressure in itself could help push this stock higher. Next, the latest quarter was reasonably strong with earnings exceeding expectations but revenue coming in a little light. The Morningstar.com shows steady revenue and earnings growth and nice free cash flow improvement. However, the balance sheet leaves a little to be desired with a current ratio under 1.0 and a significant level of long-term liabilities as well.
Valuation is ok with a rich Price/sales but a nice return on equity figure. Another attractive point is the high level of the short interest which may well be continued to be "squeezed" by the stock buy back. Finally, the chart looks quite nice to me.
These are the reasons I thought the stock deserved to be on the blog. I am not buying any shares, but I have now added this company to my "investing vocabulary"...those stocks that may well be 'investable' given the appropriate portfolio management signals that might lead to me adding a new position!
Thanks so much for visiting! If you have any comments or questions, please feel free to leave them on the blog or email me at bobsadviceforstocks@lycos.com. Please give my Stock Picks Podcast a listen as well!
Bob
Newer | Latest | Older


