Stock Picks Bob's Advice
Friday, 20 April 2007
On 'Investor Euphoria' or 'How to Keep a Cool Head when Things are Going Well!'
Hello Friends! Thanks so much for stopping by and visiting my blog, Stock Picks Bob's Advice! As always, please remember that I am an amateur investor, so please remember to consult with your professional investment advisers prior to making any investment decisions based on information on this website.
On a day like today it is easy to forget that investing is a dangerous game. That a loss is also just around the corner. That on a day when even an amateur blogger looks brilliant, it is easy to forget that 'what goes up may go down'.
There have been plenty of books written about investor psychology. The  muse that is the stock market has attracted many investors.
Or perhaps it is like a Siren as in this painting by John William Waterhouse, seducing the unwary sailor to his doom with the lure of something other-worldly.
In any case, as I have written many times, it is imperative for the investor, especially the new investor, to invest in a calm fashion, to avoid being seduced by the lure of easy riches, fast gains, and money to be taken without sacrifice. It isn't like that at all.
For those of you who have recently become enthralled with the market, beware her siren call. Respect the risk that she presents. Learn from her and above all do not fall head-over-heels into a swoon that may well lead to your financial destruction. Do I sound gloomy enough?
Having a realistic strategy in dealing with the market and your investments is necessary for success. When initially getting involved in the market, move slowly, commit only small amounts of funds into a new venture and give yourself time to consider what is really happening in the investment world.
If you feel like the stock market is getting away from you, or a stock you had seen is moving higher without you, do not panic. Do not chase that siren, she may well fall under her own weight. You do not need to own every single stock that climbs to do well in the market. You need to monitor your investments closely, understand your planned course of action in the event of every possible outcome, and then implement that action as the time to deal with your investments arises.
It is essential to have a calm mind when investing. To avoid excessive euphoria when stocks rise and the same amount of 'depression' when the stocks move against your interests. Stocks and the market do not know you exist. They live and breathe almost like a living organism. Stocks will not rise because you have sold them, nor will they fall because you have purchased them. Stocks simply don't care.
So if you are a new investor, do not get overly enthusiastic when things are working right. Consider yourself lucky, examine your plan, and determine your response. Above all, stick with your rules that you made when you were calm inside and anticipating whatever the market might deliver you.
Bob
Satyam Computer Services (SAY) "Trading Transparency"
Hello Friends! Thanks so much for stopping by and visiting my blog, Stock Picks Bob's Advice! As always, please remember that I am an amateur investor so please remember to consult with your professional investment advisers prior to making any investment decisions based on information on this website.
As I just wrote up on my last entry, my Coach Stock (COH) has been an absolutely phenomenal performer in my portfolio. The stock hit an appreciation target and I sold 1/7th of my position. Being under my maximum (my new level) of 20 positions, I thus had a "permission slip" to add a new position to the mix.
And you know how I love to buy stocks!
Anyhow, checking the list of top % gainers today, I immediately saw a stock that I recently reviewed, Satyam Computer Services (SAY), trading at $25.81, up $1.87 or 7.91% on the day. The company released earnings early today that showed revenue up 36.7% from a year earlier and earnings up 38.6% for the quarter as well. This strong performance was enough to get the stock onto the top % gainers list and was enough to get my attention as well!
I often talk about the 'vocabulary' of stocks in making investing decisions. Having a bunch of 'candidates' that are 'investable' helps me make a relatively quick decision as I did. These decisions aren't always successful as my recent sale of Medtox demonstrates, but it helps being an informed investor. And that is what my homework is all about!
Wish me luck!
Thanks so much for dropping by! If you have any comments or questions, please feel free to leave them on the blog or email me at bobsadviceforstocks@lycos.com. If you get a chance be sure and visit my Stock Picks Podcast Website where I talk about some of the stocks I have been writing about here on the blog.
Bob
Coach (COH) "Trading Transparency"
Hello Friends! Thanks so much for stopping by and visiting my blog, Stock Picks Bob's Advice! As always, please remember that I am an amateur investor, so please remember to consult with your professional investment advisers prior to making any investment decisions based on information on this website.
A few moments ago I noticed that my remaining 71 shares of Coach (COH) had hit a new sale point and I sold 10 shares of Coach (COH) (1/7th of my position), at $53.41. These shares were acquired 2/25/03 at a cost basis of $8.33/share, so I had a gain of $45.08 or 541.2% on these shares.
This was my tenth (!) partial sale of Coach, and using my own idiosyncratic system of selling at targeted appreciation points, I have sold at approximately 30, 60, 90, 120, 180, 240, 300, 360, 450, and now 540% appreciation levels.
When would I sell more shares? Since I am up to the eleventh partial sale level (where I have never been before), my goal would be to sell 1/7th of my remaining shares should the stock appreciate to a 630% appreciation level. I am going by 90% intervals as this is my third group of four sales. I hope you follow this. Thus, since my basis is at $8.33/share, the next targeted sale on the upside would be at 7.3 x $8.33 = $60.81. On the downside, I plan on selling if any 'bad' news should be reported, otherwise, if Coach retraces to 1/2 of the highest % sale at a gain, which works out to a 315% appreciation level or 4.15 x $8.33 = $34.57, I would sell all remaining shares.
One of the unfortunate aspects of selling any shares in Coach is that this is the strongest stock in my portfolio. This is compounded by my early 1/4 position sales which reduced the size of the position significantly. Hopefully, as I have now switched to the 1/7th position sale at the same targeted appreciation levels, we shall find that both the size of the portion sold as well as the remaining value of the holding should continue to grow over time.
Thanks so much for stopping by and visiting! If you have any comments or questions, please feel free to leave them on the blog or email me at bobsadviceforstocks@lycos.com. P.S., since I am at 19 positions, and under my NEW MAXIMUM of 20 positions, that 'nickel' is burning a hole in my pocket already!
Bob
Thursday, 19 April 2007
Valmont Industries (VMI)
Hello Friends! Thanks so much for stopping by and visiting my blog, Stock Picks Bob's Advice! As always, please remember that I am an amateur investor, so please remember to check with your professional investment advisers prior to making any investment decisions based on information on this website.
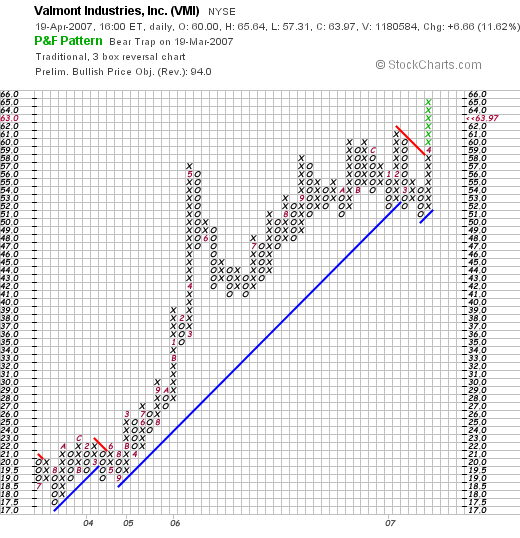
I was looking through the list of top % gainers on the NYSE this afternoon and came across Valmont Industries (VMI) near the top of the list. VMI closed at $63.97, up $6.66 or 11.62% on the day. I do not own any shares nor do I have any options on this stock. I would like to share with you some of my thoughts on this stock and explain why I believe
VALMONT (VMI) IS A BUY
What exactly does this company do?
 According to the Yahoo "Profile" on Valmont (VMI), the company
"...and its subsidiaries produce fabricated metal products; metal and concrete pole, and tower structures; and mechanized irrigation systems worldwide. The company operates through five segments: Engineered Support Structures, Utility Support Structures, Coatings, Irrigation, and Tubing."
How did they do in the latest quarter?
It was the announcement of 1st quarter 2007 results yesterday after the close of trading that pushed the stock price higher today. The company announced that for the quarter ended March 31, 2007, sales came in at $340.7 million, up sharply from sales of $303.6 million in the same period last year. Net earnings were $18.7 million, up from $13.1 million or $.72/diluted share, up from $.52/diluted share in the same period last year.
The company beat expectations of $.63/share per Thomson Financial.
How about longer-term financial results?
Checking the Morningstar.com "5-Yr Restated" financials on Valmont, except for a dip in sales from $855 million in 2002 to $838 million in 2003, sales have steadily grown to $1.28 billion in 2006. Earnings also dipped from $1.37/share in 2002 to $1.05 in 2003, then resumed their climb going up to $2.38/share in 2006. The company has been paying dividends during this time, increasing it intermittently from $.29/share in 2002 to $.37/share by 2006. The shares outstanding has been fairly stable, increasing only from 24 million in 2002 to 26 million in the trailing twelve months (TTM).
Free cash flow has been a bit erratic as well with $(12) million reported in 2004, improving to $99 million in 2005 and pulling back to $31 million in 2006.
The balance sheet appear solid with $63.5 million in cash and $431.2 million in other current assets. This total of $494.7 million in current assets, when compared with the $216.9 million in current liabilities yields a healthy current ratio of 2.28. In addition, the company has $274.1 million in long-term liabilities as reported by Morningstar.
What about some valuation numbers on this stock?
Checking the Yahoo "Key Statistics" on Valmont Industries, we find that this is a mid cap stock with a market capitalization of $1.64 billion. The trailing p/e is a moderate 26.88 with a forward p/e of 18.54 (fye 30-Dec-08) estimated. Thus, the PEG comes in at a reasonable 1.24. (5 yr expected).
Using the information from the Fidelity.com eresearch website, we can see that the Price/Sales (TTM) comes in at a reasonable 1.11, when compared to the industry average of 1.39. In terms of profitability, the company was a little less than the average of 23.33% Return on Equity, coming in at 17.04%.
Finishing up with Yahoo, we can see that there are 25.66 million shares outstanding with only 17.18 million that float. As of 3/12/07, there were 1.52 million shares out short representing 9.6 trading days of volume. With the announcement of strong earnings last night coming in ahead of expectations, there was likely a bit of a short squeeze today, as the short-sellers scrambled to buy shares to close-out their positions. The company traded over 1.1 million shares today, more than five times the usual volume of 179,883 shares/day.
As I reported above, the company does pay a dividend with a $.38/share forward dividend yielding 0.7%. The company last split its stock 2:1 back in June, 1997.
What does the chart look like?
Reviewing the "Point & Figure" chart on Valmont from StockCharts.com, we can see that except for an apparent breakdown in support for the chart in March, 2007, the company now with the sharp rise in price, is again well above its support line, having broken through the short-term area of resistance. That means simply, that while the chart recently showed a bit of a struggle, the company stock appears to be moving higher without difficulty at this time.
Summary: What do I think?
I like this stock. The company moved strongly higher today in a relatively anemic market. The company reported strong earnings last night and beat expectations. They have a strong record of steady revenue, earnings, and dividend growth the past several years while maintaining a relatively stable number of shares. Free cash flow is positive, the balance sheet is solid, and valuation is reasonable with a PEG under 1.5, a Price/Sales low for its group, and a Return on Equity that could be a bit stronger, coming in below the industry average. Finally, the chart looks strong and the significant short interest may well support further price appreciation.
Thanks so much for stopping by and visiting! If you have any comments or questions, please feel free to leave them on the blog or email me at bobsadviceforstocks@lycos.com. If you get a chance, be sure and drop by my Stock Picks Podcast Website, where I get a chance to talk about many of the same stocks I write about here on the blog.
Bob
Tuesday, 17 April 2007
A Reader Writes 'What is a good PEG ratio?"
Hello Friends! Thanks so much for stopping by and visiting my blog, Stock Picks Bob's Advice! As always, please remember that I am an amateur investor, so please remember to consult with your professional investment advisers prior to making any investment decisions based on information on this website.
Eric, who has been writing with different questions wrote earlier today. He commented:
"What is a good PEG ratio? P/E ratio? What should a good EPS be and is this ratio even worth looking at?
Thanks,
Eric"
Eric, thanks again for writing. Before we can say what is a good ratio for the PEG ratio, let's review what it is. The PEG ratio is the comparison between the P/E ratio and the Growth rate. For the Yahoo numbers that I use, this is based on 5 yr expected earnings. Thus, if the p/e is 10 and the growth rate is 5%/year, then the PEG would be 10/5 or 2.0.
In general, I have found PEG's between 1.0 and 1.5 to be reasonably priced. the Motley Fool had a nice article on PEG ratios where it was pointed out:
2003 PEG Ratio | Number of Companies (1,316 total*) | Median Return | Average Return |
|---|
| Below 0.00 | 213 | 43.9% | 69.4% |
| 0.00 - 0.99 | 583 | 154.1% | 225.2% |
| 1.00 -1.50 | 193 | 78.4% | 92.6% |
| 1.51 - 2.00 | 102 | 60.5% | 79.0% |
| More Than 2.00 | 225 | 44.4% | 69.4% |
*Includes U.S. companies trading on major exchanges with market caps greater than $500 million for which data was available.
Even from this chart we can see that there is a wide variation between PEG ratios and return on an investment. Simply put, a stock with a low PEG ratio is in general a better "value" than one with a high PEG ratio.
Insofar as p/e ratios are concerned, here is another article you might wish to read. Simply put, p/e's that are 'low' are better values than stocks with p/e's that are 'high'. Each investor may have different tolerances to different p/e's. As you invest and gain experience, examine these ratios, and observe how the stocks perform later.
Finally, what about EPS? EPS just stands for "earnings per share". This particular number is rather meaningless when taken out of context. That is, it is important to know the price of a stock to determine what the value of the earnings is to the stockholder. Also, it is the change in earnings that often determines the stock price. And even more so, it is the expected earnings that will drive a stock higher or lower. There isn't any particular absolute EPS on anything really.
I hope this helps a little. Be sure and read some basic texts on investing to give you some more insight on all of these numbers. Let me know how things are working out!
Bob
MedTox Scientific (MTOX) "Trading Transparency"
Hello Friends! Thanks so much for stopping by and visiting my blog, Stock Picks Bob's Advice! As always, please remember that I am an amateur investor, so please remember to consult with your professional investment advisers prior to making any investment decisions based on information on this website.
A few moments ago, checking my portfolio, I saw that my MedTox stock (MTOX) that I had bought yesterday (!) was down sharply and passed my 8% tolerance limit. I sold my 210 shares at $18.81 that I had purchased at average cost of $20.74, thus, the sale represented a loss of $(1.93) or (9.3)% since purchase. I have said it before, and I will repeat what I have written, I don't care how long I hold a stock. If it hits my sale points on either good or bad news, I shall implement the indicated trade.
The irony of the situation is that MedTox reported good earnings! In general, I have had greater luck buying stocks AFTER reported news and not just before they report. It is common in the market for stocks to sell off after a good announcement and to rise in anticipation. I didn't execute this trade very well at all!
In any case, I am now back to 19 positions. The good news is that I can now buy a new position if I get the right signal. Under my maximum of 20 positions which I recently discussed. Thanks so much for dropping by! If you have any comments or questions, please feel free to leave them on the blog or email me at bobsadviceforstocks@lycos.com.
Bob
Too Much Margin! Rethinking my Portfolio Goal!
 Hello Friends! Thanks so much for stopping by and visiting my blog, Stock Picks Bob's Advice! As always, please remember that I am an amateur investor, so please remember to consult with your professional investment advisers prior to making any investment decisions based on information on this website.
(Illustration from Reader's Digest Canada article on Debt.)
I have written extensively about building portfolios and waiting to develop the cash to add a position. It is time for me to live up to my words.
I am now at 20 positions in my Trading Account. I want to pause to let my cash sales on gains start paying down the margin load rather than adding more margin to the account. Let me explain. Currently my 20 positions have an equity value of $123,214.30. My margin value is a hefty $69,140.72. My net value of my account is at $54,073.58.
There is no doubt in my mind that my strategy overall has thus far been successful. My portfolio is full of unrealized gains. In fact these paper profits total $39,899.05 this morning. Of my 20 positions, only two have unrealized losses: Covance (1.34)%, and Medtox (1.13)%. These are recent purchases. And my net realized gains this year total $3,850.29. I am not hiding losses in my realized trades.
But what I am about is about reducing risk as well as maximizing profit potential. And margin is an anchor around my neck. It provides leverage on the way up as well as magnifying losses in times of correction. My portfolio shall remain at a 25 position goal. But for now, I shall hold at 20 positions and see if my own strategy will gradually pay down my margin.
Wish me luck! I shall report back to you as I make progress (or not) on this. Thanks again for dropping by. If you have any comments or questions, please feel free to leave them on the blog. Or email me at bobsadviceforstocks@lycos.com.
Bob
Monday, 16 April 2007
Jones Soda (JSDA) and Medtox Scientific (MTOX) "Trading Transparency"
Hello Friends! Thanks so much for stopping by and visiting my blog, Stock Picks Bob's Advice! As always, please remember that I am an amateur investor, so please remember to consult with your professional investment advisors prior to making any investment decisions based on information on this website.
A few moments ago my Jones Soda (JSDA) hit an appreciation target at a 60% gain. I sold 35 shares of JSDA at $30.25. I now have 215 shares remaining of this stock that I purchased with a cost basis of $18.22 on March 12, 2007. This sale represented a gain of $12.03 over my purchase or 66.0% appreciation. On the upside, my next sale will be at a 90% appreciation level or 1.9 x $18.22 = $34.62 or on the downside, at half of the highest appreciation point, or at a 30% gain, I plan on selling all remaining shares. This sale point would be at 1.30 x $18.22 = $23.69.
Having sold at a gain, this represented "good news" and the nickel didn't last long in my pocket. I noticed that Medtox (MTOX) was on the top % list again, currently trading at $20.88, up $1.28 or 6.57% on the day. I went ahead and purchased 210 shares at $20.69. Wish me luck!
Thanks again for visiting. I shall try to keep you posted as things move along. If you have any comments or questions, please feel free to leave them on the blog or email me at bobsadviceforstocks@lycos.com.
Bob
Saturday, 14 April 2007
Genentech (DNA) "Long-Term Review #6"

Hello Friends! Thanks so much for stopping by and visiting my blog, Stock Picks Bob's Advice! As always, please remember that I am an amateur investor, so please remember to consult with your professional investment advisers prior to making any investment decisions based on information on this website.
One of the problems about blogging for a long time and writing many entries is that the early entries more or less get buried under the later discussions. A few months ago I started digging back to the first entries on this website to find out how they turned out. I already do the one year retrospective. The early entries are going on four years out. I want to know what has happened to all of them and if these stocks still deserve to have a spot on my blog in a favorable light.
On February 24, 2007, I wrote up my "Long-term review #5" Agree Realty. ADC was posted on May 16, 2003. The next entry on the blog is dated May 19, 2003, and is about Genentech (DNA). I wrote:
"May 19, 2003 Genentech (DNA)
Overall a lousy day in the market. Genentech (DNA) tops the largest percentage gainers today with news about a new possible treatment for Colon and Rectal Cancer. Advanced colon and rectal cancer has a rather dismal prognosis and we all know people who have succumbed to the disease. Anyhow Genentech has a new drug called AVASTIN which along with traditional chemotherapy has successfully extended the lifespan of individuals in their study who have this life-threatening illness.
A nice coincidence for us is that Genentech FITS our protocol...last quarter (ending 3/3103), per our cnn.money site, revenues rose 29% (!) to $768.6 Million, net income rose 59% to $151.5 Million.(!)...
Looking at the past 5 years, as we like to do around here, we find that the revenue has increased from $1.2 billion in 1998, 1.4 billion in 1999, 1.7 billion in 2000, 2.2 billion in 2001, and 2.7 billion in 2002. Extrapolating this latest quarter (x4) gives us over 3.0 billion for 2003. The consistency of the revenue growth is impressive.
The last four quarters as reported in Morningstar (prior to the CURRENT quarter noted above), we find that revenues increased by 13.59%, 26.45%, 21.40%, and 29.69%....and the latest quarter up by 29% as well. Cash flow has improved...from 81 million positive in 2000, to 267 million in 2001, and 265 million in 2002 the latest year reported.
So at the moment (12:05 pm CST), stock is at $53.04 up $15.14 (WOW), p/e is a bit steep (to say the least) at 212.40....yikes....but otherwise this stock fits the bill....would add a position in my own portfolio (I do not own any shares nor does anyone in my family)...but I do not have a stock that needs to be sold due to a gain....but this is one for the list. Good luck investing. Bob"
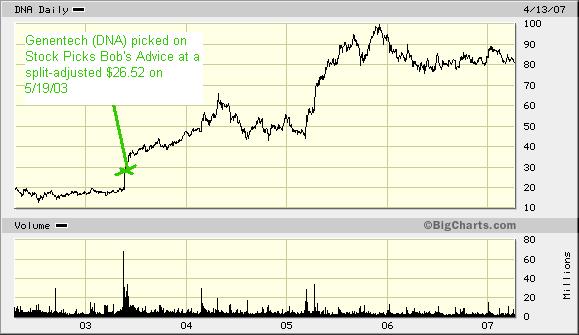
Genentech was "picked" for Stock Picks Bob's Advice when it was trading at $53.04 on May 19, 2003. DNA split 2:1 on May 13, 2004, making my effective "pick price" actually $53.04 x 1/2 = $26.52. DNA closed at $81.33 on April 13, 2007, for a gain of $54.81 or 206.7% since posting. I do not own any shares nor do I have any options or contracts on Genentech (DNA).

Let's take a closer look at this stock and see if it still deserves a spot here!
What exactly does this company do?
 According to the Yahoo "Profile" on Genentech (DNA), the company
"...engages in the discovery, development, manufacture, and commercialization of biotherapeutics in the United States."
How did the company do in the latest quarter?
On April 11, 2007, Genentech announced 1st quarter 2007 results. For the quarter ended March 31, 2007, operating revenue came in at $2.84 billion, up 43% from the $1.986 billion in the same period last year. GAAP net income increased 68% to $706 million from $421 million in the prior year first period. GAAP earnings per share jumped 69% to $.66/share vs  $.39/share reported in the 1st quarter of 2006. Continuing earnings per share were $.74/share in the quarter.
The company beat expectations on both revenue, which according to Thomson Financial, analysts had been expecting $2.74 billion, as well as earnings, which were expected to come in at $.67/share.
How have they been doing longer-term?
Reviewing the Morningstar.com "5-Yr Restated" financials on Genentech, we can see the steady increase in revenue from $2.6 billion in 2002 to $9.3 billion in 2006. Earnings have climbed from $.06/share in 2002 to $1.97 in 2006. Shares have been stable and actually have dipped from 2002 with 1.067 billion shares in 2002 and 1.051 billion in 2006 and 1.053 billion in the trailing twelve months (TTM).
Free cash flow has been strongly positive and growing with $545 million in 2004 increasing to $924 million in 2006. The balance sheet looks solid with $2.49 billion in cash and $3.21 billion in other current assets. This total of $5.70 billion can easily cover the $2.16 billion in current liabilities and yields a healthy current ratio of 2.64. DNA also has $3.21 billion in long-term liabilities on the books per Morningstar.
What about some valuation numbers?
Looking at Yahoo "Key Statistics" on DNA, we can see that this is a large cap stock with a market capitalization of $86.66 billion. The trailing p/e is a bit rich (but not as rich as back in 2003!) at 41.31, but the forward p/e (fye 31-Dec-08) is estimated at a much more reasonable 23.44. In fact, with the rapid growth in earnings (5 yr expected) estimated, the PEG works out to a very nice 0.99. Generally PEG ratios between 1.0 and 1.5 are reasonable from my perspective.
According to the Fidelity.com eresearch website, Genentech (DNA) has a very reasonable Price/Sales (TTM) of 9.23, well below the industry average of 94.68. The company is also far more profitable than its peers with a Return on Equity (TTM) of 24.47% compared to the industry average of (2.69)%.
Finishing up with Yahoo we can see that there are 1.05 billion shares outstanding with 1.05 billion of them that float. As of 3/12/07, there were 8.71 million shares out short representing 3.2 trading days of volume or 0.8% of the float. This does not appear to be a big factor in this heavily traded stock.
No dividend is paid per Yahoo and as I noted above, the last stock split was a 2:1 stock split on May 13, 2004.
What does the chart look like?
If we look at a price chart from BigCharts.com on Genentech (DNA) , we can see that the selection of Genentech back in mid-2003 was really very fortunate as it came just as DNA was making a very large move higher. (My regular "point & figure" charts from StockCharts.com are currently unavailable.)
Summary: What do I think about this stock?
In a word, this was one great stock that got away :). In any case,
GENENTECH (DNA) IS RATED A BUY
The latest quarter was solid as the company beat estimates. The company has continued to demonstrate solid performance in both revenue and earnings growth the past several years. Free cash flow is growing, the balance sheet is solid, and the number of shares outstanding is absolutely stable. Valuation is becoming more reasonable with a forward p/e in the 20's, a PEG under 1.0, a Price/Sales below its peers, with a ROE showing stronger profitability than similar companies in its industry. Finally, the chart appears to be strong. I would like to see a "point & figure" chart on this one....In any case, this company I "picked" back in 2003 still deserves a spot here on the blog!
Thanks again for visiting! If you have any comments or questions, please feel free to leave them on the blog or email me at bobsadviceforstocks@lycos.com. If you get a chance, be sure and visit my Stock Picks Podcast Website, where I discuss some of the stocks I write about here on the blog.
Have a great weekend everyone!
Bob
Posted by bobsadviceforstocks at 11:24 PM CDT
|
Post Comment |
Permalink
Updated: Saturday, 14 April 2007 11:31 PM CDT
A Reader Writes "Here are a few more questions for you:"
CLICK HERE FOR MY PODCAST ON INVESTING PHILOSOPHY
Hello Friends! Thanks so much for stopping by and visiting my blog, Stock Picks Bob's Advice! As always, please remember that I am an amateur investor, so please consult with your professional investment advisers before acting on any information on this website. Even as I answer your occasional emailed question, please always keep this in mind.
 I have been having an interesting conversation with Eric N. who followed up his last letter with some more questions. I would like to share with you his questions as well as my responses. Eric, if you or any other reader has additional questions or comments, please feel free to leave them on the blog or email me at bobsadviceforstocks@lycos.com. I enjoy receiving correspondence from readers and I hope that my my amateur yet experienced perspective is helpful to all of you. I do not claim to have all of the answers, or even that my answers are necessarily "right". I can only respond to your inquiries from my own perspective.
Eric wrote:
"Hi Bob,
Thank you so much for answering my questions! You have been VERY helpful! I really appreciate the way you take the time to answer each question so thoroughly. I look forward to keeping you posted as I try my hand at trading.
Here are a few more questions for you:
Do you also have other investments in mutual funds, CD's, bonds, etc.? Or, do you stick to the stock market?
You have mentioned that you like to invest about $5000 in a new position. If I was to hold to this as well I would only be able to invest in 5 positions or so. Would you recommend having fewer positions and relatively more invested in each one, or more positions and relatively less invested in each one?
When charting the gain/loss of each position, do you use some sort of spreadsheet to do this (i.e. Excel) or does Fidelity.com provide the tools you need to track each position's information?
To avoid possibly losing more than 8% on a particular stock or the stock falling below half of its highest appreication target, do you watch your stock constitently throughout the day? Or, do you check everything out at the end of the day and make your moves then? ...or, do you do something completely different?
You talked about 'signals' from your portfolio. Are these the rules that you laid out yourself to determine when you should sell/buy, etc.? Or, am I missing the point?
As you explained your approach to buying and selling you said, "On sales on "bad news", I do not replace these stocks unless I am at my minimum level or 6 position portfolio."
Could you please expand on this comment? When do you replace the stocks? Is it only when you sell on 'good news' that you replace the stock and otherwise you just sit on the money?
Also, I really like the way you analyze various stocks, rate them, and give your take on the situation. It is great stuff! Keep it up!
Thanks for your help and sharing your wisdom with us.
Best wishes,
Eric N."
Eric, thanks so much for writing. I do not claim that what I write is wisdom. You flatter me with those words. But perhaps it would be correct to say that I have been following the market and reading about stocks for many years and maybe from that experience I can share with you my best guess on your questions. As always, please consult with your professional investment advisers as you make decisions. I shall try to answer your questions from my own perspective.
First of all, insofar as other investments are concerned, I do have a retirement account at work that is chock-full of mutual fund investments. I am mostly invested in T Rowe Price funds, which is the fund family that I chose for my 403B. I recently was notified that my employer will be switching to Fidelity, where there are Price funds available, but I shall have to review those options at that time. I also have a small account with a broker-friend that is invested in some Unit Trusts as well as a few American Funds investments as well as a tax-free Muni bond fund.
I also have some retirement funds that are managed by professional managers who invest directly in individual stocks. I do not always know what is in those accounts, but when I write up a stock and suspect I own some shares, I try to doublecheck and post on my entry.
I do not own any Bonds directly. So to answer your question, I do have mutual funds and other managed accounts. But I have chosen to manage my "Trading Account" along the lines of my blog. I believe it will be successful, but this is an ongoing experiment for me.
You had a question about what to do if you put $5,000 in each position and could only own 5 positions. I do believe that is a perfectly satisfactory way to start an account. What I would suggest, is that you determine how much you can add to that account each month. For instance, you might be able to add $250 or $500 each month to the account automatically. Assuming you want to have $5,000 per position, instead of buying a new position when you sell a portion of a stock at a gain, I would instead keep adding that money to the cash side until you reach your new $5,000 level, and then add a new position. Figure out ahead of time how many positions you would like to have.
If you like the idea of 25 positions as a long-term goal, I would keep adding new positions regardless of how the existing positions do if there is enough cash until I got to neutral or 12 positions. If instead you wanted to have a maximum, for example, of 16 positions, then I would keep adding positions until I reached "neutral" in my investing posture, or 1/2 of the maximum positions which in that case would be 8. After that, I would only add a new position if I both had enough $'s, and I had a signal to add a position.
I have not been using any spreadsheet to follow my investments. Although it might indeed be a great idea! Instead, I use the information available on my Fidelity.com account (I am starting to sound like an advertisement...I suspect the same information would be available with other brokerage houses as well....just check before opening an account). I can see the current % change from investment, the account lists the closed trades so I can tell how many times I have sold a stock. For an investment like Starbucks where there have been several sales, I literally find myself counting on my fingers :) to determine how many sales and the next sale point. I am sure there are automatic ways which would be easier---I just don't employ them.
Again, on a sale on the downside, which as you point out would either be at an 8% loss after a first sale, at break-even if I had already sold a portion at a 30% gain, or at 1/2 of my highest % appreciation level if I have sold more than once at gains...I do this manually. I just check the account when I have time during the day. Sometimes I miss a buy or miss a sale. In which case, I usually check pretty close to opening on the next day.
On the "signals"....these are what I call the sales in my existing portfolio. I have divided these sales up into what I would label "good news" sales or "bad news" sales. The cases of good news sales are those times when a holding of mine hits a sale point on an appreciation move. For instance, reaching a 30%, 60%, 90%, or 120% appreciation target. At that time, my system dictates that I should sell a portion (as long as this is the first time the stock has hit that appreciation point), and this is what I call a "signal" to add a new position.
Sales on the downside are what I call "bad news". This "signal" is just a directive to sit on my hands and not, in fact, do anything.
So these are the "signals" I talk about. I also refer to this as my "Zen" approach. The ability to listen to my own portfolio which is 'talking ot me!'. This thought was derived from the William O'Neil CANSLIM approach where Mr. O'Neil, who I greatly admire, comments about the "M" in CANSLIM which for one thing means "Market". O'Neil suggested that one should try to get a feel for the market itself when buying. I don't have the exact quote, but I recall that O'Neil pointed out that when selling stocks at a loss, the market is essentially telling you that it is not a good time to be buying. About the worst thing you can do is to limit your losses and then buy another position in a 'bad' market that is declining. You will manage to literally compound your losses.
It really seemed to me that there should be a corollary with this, that is, if the market was telling you to 'sit on your hands' as the stocks declined and hit sale points, shouldn't there be a different signal within your own portfolio to tell you that the 'coast is clear' that it is a good time to be buying? It is from this that I thought it wise to use my own portfolio as stocks hit appreciation targets to be a "signal" to buy another position.
You asked about 'replacing stocks'. The only time I replace a stock on 'bad news' sales is when I am at a minimum position level. For me, I have set that up as 6 positions. Since my trading strategy depends on some sort of stock portfolio barometer, I need to be owning stocks at all times. Just not fully invested. Think of my investing posture as shifting between minimally invested in stocks (6 positions) and maximally invested (25 positions). I like to say that half way between these two 'postures' I am in a "neutral" position.
When I buy a new position on a sale on good news I am never 'replacing' a stock. That is, I have only sold a portion of my holding, so it is a new position. (I do reserve the right to 'change my mind' as I did recently, switching from my AZZ investment to my BLUD investment which appeared to be more in line with my own philosophy). At 25 positions, if I sell a portion on good news, that is appreciation, then I shall be using that cash (finally) to pay down the margin in my account. I do NOT suggest you use margin. My goal is to be reducing that margin amount. Margin does help on the upside as leverage but it also makes the swings more violent in a correction as your losses are magnified relative to your equity. Not a good thing for your blood pressure :).
On the downside, I "sit on my hands" with the funds or proceeds generated from a sale. That is, except if I am at my minimum number of positions which I have set at 6. Thus, with sales on bad news, as might happen overall in a severe bear market, I would expect my stock holdings to diminish in number and my cash to increase.
Years ago I read a book by Robert Lichello called "How to make $1,000,000 in the Stock Market--Automatically". You probably can find a used copy of this on Amazon for a buck. Might be worth your look. The take-home from Lichello was his search for some sort of automatic shifting between equity and cash in response to market action. His system was probably better than mine. Seriously. I suspect there is a big delay to my own system as my trades will lag the market. But there should be some effect in a prolonged bear or a prolonged bull market to change my own exposure to equities automatically. At least that is my goal.
I hope that my comments have not been too long, too tiresome, or too difficult to grasp. I don't think they are very complicated, I try to keep things simple.
I always say I don't think I necessarily have the best approach to investing at all. I am not even sure what I do will work long-term. But with the blog, I have been able to publicly set up a strategy for investing, set up rules for myself, and all of you can follow along with me as I learn what works and what doesn't. Thus far, things have been going very well!
Thanks again for writing and visiting! If you have any other comments or questions, please feel free to leave them on the blog or email me at bobsadviceforstocks@lycos.com.
Wishing you a nice weekend!
Bob
Newer | Latest | Older


