Stock Picks Bob's Advice
Sunday, 3 June 2007
Advice to New Investors!
Hello Friends! Thanks so much for stopping by and visiting my blog, Stock Picks Bob's Advice! As always, please remember that I am an amateur investor, so please remember to consult with your professional investment advisers prior to making any investment decisions based on information on this website.
It is late Sunday and I really need to get some sleep. I am up early tomorrow to walk with friends. Am trying to get some more exercise. As well as some sleep :).
But I wanted to pause for a moment, especially with the markets closed. I have a great Carole King CD on and I can almost hear the earth move.
Seriously, I have had some questions about margin and I believe many are coming from new investors that want to understand the ins and outs of investing. Unfortunately, I have a load of margin and I don't suggest anyone else use it. In fact, I want to pay this down real badly.
I have made so much progress in my own account and I know that a severe downdraft with a large margin position will really do some damage to my equity. I don't need that and you don't either.
If you are starting out, the best advice I can give you is not to be in a hurry. We have been extremely fortunate the past several years. It is not always this easy. Even an amateur like me looks brilliant. That in itself is a scary thought.
I am totally convinced that my ideas of identifying quality stocks will work over the long haul. But I want you all to stay with the market over the long term. If we get a severe correction, I don't want to see all of you bailing and moving on to some other investment idea. It is the long-term investor who sticks with hit through good times and bad that will be successful in the long term. I really believe this stuff.
I write up loads of stocks on this blog. Some do great and some do terrible. But overall I am satisfied with how they are turning out. My disciplined approach to my own portfolio will allow me to continue to weed out the weakest performing equities and replace them over time with new possibilities. I don't think there is any magic to what I do. Just lots of work.
So if you are starting out, slow down. Don't rush it. Listen to the market, listen to your portfolio, plan your moves before they are needed, and expect success. Thus, when success arrives, not because you are lucky, but because you stacked the deck with great stocks, you will not be surprised. You will react to success with equal discipline as you will respond to the occasional failure. And failure will occur.
So, as I head off for the evening, let me thank all of you for your loyal participation on this blog. Those of you who choose to enter comments and write questions, I offer you an extra big Thank You! For those of you who choose to visit, think about jotting me a line as well. Let me know what you think, whether the blog is helpful, and where I should go with this.
Thank you all for a wonderful four years blogging here at Stock Picks Bob's Advice!
Bob
Saturday, 2 June 2007
"Looking Back One Year" A review of stock picks from the week of January 9, 2006

Hello Friends! Thanks so much for stopping by and visiting my blog, Stock Picks Bob's Advice! As always, please remember that I am an amateur investor, so please remember to consult with your professional investment advisers prior to making any investment decisions based on information on this website.
It is the weekend and it is time for a review.

But before I do that let me digress. I don't talk too much about my own personal life but let me share with you a wonderful evening I had last night in Lanesboro, Minnesota, listening to the great Garrison Keillor and the Prairie Home Companion crew.

Thank you Mr. Keillor for a great evening celebrating the greatest of fruits (vegetable?) rhubarb, and rhubarb pie.

I don't get out too much! But what a great evening under the stars sitting in Center Field on a lawn chair after a wonderful dinner with family and friends at the Pedal Pushers Diner in Lanesboro where I had a dinner of Liver and Onions and a great slice of Rhubarb Pie!

(forget the diet for an evening!). O.K. it was great, but let's get back to that review :). But then again, let me work hard at sharing with you a little more of a personal blog along with all of the endless entries about stocks! Let me know what you think. Probably make the whole thing more interesting for me and for all of you readers.
My weekend reviews always assume a buy and hold strategy. I do this for the ease of reviewing these past stock picks. In practice, those of you who read my entries will realize that I both advocate and employ a strategy of a disciplined portfolio management strategy with which I quickly sell my holdings that incur small losses and also sell my gaining stocks slowly and partially at targeted appreciation levels. This difference in strategy would certainly affect the overall performance of any stock purchases.

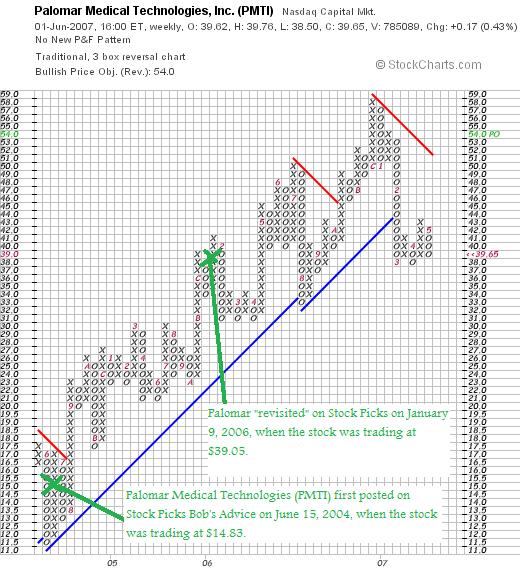
On January 9, 2006, I posted Palomar Medical Technologies (PMTI) on Stock Picks Bob's Advice when the stock was trading at $39.05. Palomar closed at $39.65 on June 1, 2007, for a gain of $.60 or 1.5% since posting.
Taking a look at the "Point & Figure" chart on PMTI from StockCharts.com, we can see what appears to be a short-term break down in price action with the stock dropping below support levels and lingering well below resistance levels (the lines in red and blue). Simply put, the chart is less than encouraging.
 On April 26, 2007, Palomar reported 1st quarter 2007 financial results. Revenue for the quarter increased 40% to $31.5 million from $22.5 million in the same quarter last year. GAAP net income, however, dropped to $5.9 million or $.30/diluted share this year, down from $6.2 million or $.31/diluted share in the same period last year.
In light of the strong revenue growth, but the weak earnings results and less than impressive appearance of the chart,
PALOMAR MEDICAL TECHNOLOGIES (PMTI) IS RATED A HOLD
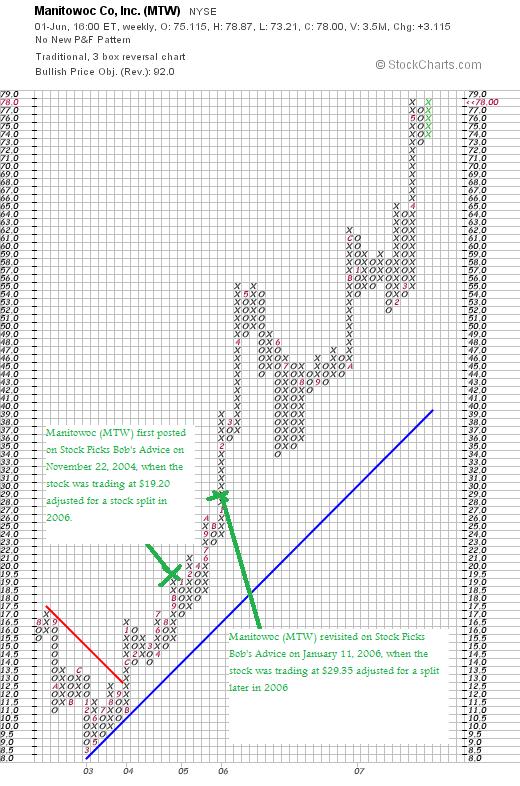
 On January 11, 2006, I "revisited" Manitowoc Co. (MTW) when the stock was trading at $58.70. MTW split 2:1 April 11, 2006, making my effective stock pick price actually $29.35. MTW closed at $78.00/share on June 1, 2007, for a gain of $48.65 or 165.8% since posting.
Looking at the "Point & Figure" chart on Manitowoc from StockCharts.com, we can see the incredible strength that this particular stock has shown since bottoming at $8.50 in March, 2003.
 On April 30, 2007, Manitowoc announced 1st quarter 2007 results. For the quarter ended March 31, 2007, sales increased 36% to $862 million from $633 million in the same period last year. Net earnings were up more than 100% at $64.1 million this year from last year's $29.7 million or $1.01/diluted share, up from $.48/diluted share last year.
In light of the strong price chart and the very strong earnings report,
MANITOWOC (MTW) IS RATED A BUY
 On January 13, 2006, I posted JLG Industries (JLG) on Stock Picks Bob's Advice when the stock was trading at $49.45. JLG split its stock March 20, 2006, with a 100% stock dividend, making my effective pick price actually $24.73. JLG was acquired by another stock pick favorite of mine in December, 2006, at $28/share. This represents a gain of $3.27 or 13.2% since posting.
So how did I do during that week in January, 2006, with these three stocks. In a word, fabulous! All three climbed (unlike the prior week when all five declined!) and one was acquired with an average gain of 60.2%! Most of this gain is all about Manitowoc (MTW), an amazing stock of an amazing company!
Thanks again for visiting! If you have any comments or questions, please feel free to leave them on the blog or email me at bobsadviceforstocks@lycos.com. If you get a chance, be sure and visit my Stock Picks Podcast Website where you can hear me discuss many of the same stocks I have been writing up here on the blog.
Bob
A Reader Writes "What do you consider a comfortable amount of debt?"
Hello Friends! Thanks so much for stopping by and visiting my blog, Stock Picks Bob's Advice! As always, please remember that I am an amateur investor, so please remember to consult with your professional investment advisers prior to making any investment decisions based on information on this website.
One of the great things about writing a blog is the opportunity to interact with other investors who also are interested in learning about what you are writing. With that in mind, if you have any comments or questions, always feel free to leave them on the blog or email me at bobsadviceforstocks@lycos.com. I read all of the comments and emails and try to respond to as many as possible. Please do remember, as I write so many times, that I truly am just an amateur investor who enjoys writing about stocks and managing my own portfolio. So do remember to consult with a professional before acting on any of my writing.
 I had a couple of additional comments from my loyal reader Eric N. who writes from Boston, Massachusetts about more questions on margin. Eric writes:
"Hi Bob,
Thanks for the response. I always appreciate your thoughts and opinions.
As you mentioned, your year to date net is about $12,300 (which is great! congrats!), including about $3,000 in short-term gains and $9,250 in long-term gains. Could you comment on the differences between short-term and long-term gains? I am not familiar with the terminology.
Thanks!
Eric"
and also:
"Hi Bob,
I may be missing something, but when you say, "Currently, my own Trading Account, even after the big rally and my latest sale, sits at $53,853.72. I have $66,205.55 in margin debt. My total holdings stand at $120,059.27. Thus, I am sitting at a 44.85% margin level. Way too much debt..." Doesn't that translate into 56% ($66,502.55)of margin debt rather than 44% ($53,853.72)?
How are you able to have more debt than your trading account is worth? Are you aiming to get your margin debt down to 30%? What do you consider a comfortable amount of debt? Do you think there is a certain percentage that someone should try to remain around when it comes to margin debt?
Thanks,
Eric"
Thanks so much for writing Eric! I hope that my efforts are in some way aiding you in understanding investing and some of the risks and opportunities associated with selecting and managing those investments.
Let me try to tackle your first question about the difference between short-term and long-term gains. These terms separate investment sales for the purpose of tax reporting. These gains are treated differently by the IRS in the United States (those of you in other countries will need to research your own tax laws), depending on the duration that the equity has been held. Short-term gains are those realized when the stock has been held less than a year. Long-term gains are those held for longer than a year.
As explained in this article:
"With holding period defined, we can say that a short-term gain or short-term loss is a gain or loss on a capital asset that had a holding period of twelve months or less. Similarly, a long-term gain or long-term loss is a gain or loss on a capital asset that had a holding period of more than twelve months."
And what are the consequences of short-term vs long-term profits?
The article continues:
"Short-term gains are taxed as ordinary income. Therefore, the nominal tax rate will be whatever tax bracket you are in. More explicitly, it will be taxed at the federal tax rate (bracket) as determined by your taxable (not gross) income line on your federal tax return.
The tax treatment of long-term gains is somewhat more complicated, and depends on your income. Long-term gains are taxed at 5% if you are in the 10% or 15% federal tax brackets (for tax year 2004, up to about $58K for married filing jointly, and less for others). Long-term gains are taxed at 15% if you are fall in one of the higher income-tax brackets (e.g., 25%, 28%, and so on). The long-term gains are included when figuring out your bracket. However, the 5%/15% rate doesn't apply to all long-term gains. Long-term gains on collectibles, some types of restricted stock, and certain other assets are instead subject to a different rate, which may be as high as 28%. And certain kinds of real estate depreciation recapture are taxed no higher than 25%.
Just to keep up with the history, in 2001 and 2002 the tax man offered low rates on sales of assets held 5 or more years. Those rates were 8% and 18% depending on the taxpayer's income-tax bracket. Those so-called "ultra-long-term gains" were swept away by tax-law changes of 2003."
The article includes a nice table:
Tax bracket
| | Short-term rate | Long-term rate |
|---|
10%
| 10%
| 5%
|
15%
| 15%
| 5%
|
25%
| 25%
| 15%
|
28%
| 28%
| 15%
|
33%
| 33%
| 15%
|
35%
| 35%
| 15%
|
The tax implications of sales are a bit more complicated as the article summarizes:
"Now what happens if you have both short-term capital gains and losses, as well as long-term gains and losses? Do short-term losses have to offset short-term gains? Do long-term losses have to offset long-term gains? Well, the rules for computing your net gain or loss are as follows.
- You combine short-term loss and short-term gain to arrive at net short-term gain (loss). This happens on Sched D, Part I.
- You combine long-term loss and long-term gain to arrive at net long-term gain (loss). This happens on Sched D, Part II.
- You combine net short-term gain (loss) and net long-term gain (loss) to arrive at net gain (loss). This happens on Sched D, Part III.
- If you have both a short-term loss and a long-term loss, your net loss will have both short-term and long-term components. This matters if you have a loss carryover (see below).
- If you have both a short-term gain and a long-term gain, your net gain will have both short-term and long-term components. This matters because only the long-term piece gets the special capital gains tax rate treatment.
- If you have a gain in one category and a loss in another, but have a gain overall, that overall gain will be the same category as the category that had the gain. If you have a loss overall, that overall loss will be the same category as the category that had the loss.
- If you have a net loss and it is less than $3,000 ($1,500 if married filing separately) you get to take the whole loss against your other income. If the loss is more than $3,000, you only get to take $3,000 of it against other income and must carry the rest forward to next year. When taking the $3,000 loss, you must take it first from the short-term portion (if any) of your loss. The Capital Loss Carryover Worksheet in the Sched D instructions takes you through this.
- If you have a net gain, the smaller of the net gain or the net long-term gain will get the special tax rate. This happens on Sched D, Part IV"
So you can see that this is a bit more complicated than it should be. Thus, it is important that you understand the advantages of longer-term holdings for tax purposes. In my investment strategy, with my sales at 8% losses, I am hoping that I shall be able to have enough losses to offset the many gains that I also anticipate realizing. I have chosen to try to maximize my overall return independent of tax consequences. You may find many other investors who may choose to work hard to take taxes into consideration in all of their transactions. You will need to find your own level of comfort in whatever approach you choose.
Let's take a look at your second note on margin.
First of all you are absolutely correct and I believe I mis-spoke on the margin levels. My equity level is at the 44% level and the debt is at 56%. You first asked how I could have more debt than my account is "worth". Actually, my account is worth far more than my debt. As I wrote, what my account is 'worth' is the total value of my stock holdings which is around $120,000. My 'debt' is at $66,000 and the 'equity' is valued at about $54,000. So out of my entire $120,000 holding, you can think of it as my brokerage advancing me back $66,000 from the $120,000 in holding.
If I was buying a house, then if it were a $120,000 home, this would be like having a mortgage of $66,000 meaning that I had $54,000 in equity in that home. I hope that explains the situation better.
Furthermore, where am I aiming for my margin debt? I would like to pay off the whole thing. I really don't want to have any margin debt at all. So even though I am currently more or less 'comfortable' with the large level of debt, I have chosen to limit my portfolio to 20 positions instead of 25 so that I can start using partial sales to pay down the margin debt instead of adding a 21st or 22nd position. In addition, I continue to contribute $300/month automatically into the account.
However, with this $66,000 in debt at a margin interest rate currently at 9.575%, this results in a daily margin interest accrued at $17.96. This is about $500/month just paying the loan. I would rather be starting to earn interest than pay interest for a loan.
Just to explain margin a bit better, I found this article on the net where it was explained:
"Typically, a margin account allows the account holder to borrow up to 50% of the equity in the account for the purchase of new securities. There is also a maintenance requirement that is typically 30% of the equity. If the value of the equity drops below 30% of the total amount, then the broker issues a margin call. The investor either has to send more cash or other equity, or the broker will sell enough of the securities, to increase the total equity above 30%. Thus, if the investor initially deposits $5,000 into a new margin account, he can buy up to $10,000 worth of stocks. If the value of those stocks subsequently declines to below $7,000, then the investor will be subject to a margin call, because $2,000 is what remains of the investor's equity, which is less than 30% of the total amount in the account.
| Calculating the Percentage of Total Equity in a Margin Account |
|---|
| Total Equity % = | Market Value - Borrowed Amount
/Market Value | If Total Equity % < 30%
then broker issues margin call. |
The margin and the margin maintenance requirement are specified by Regulation T, enacted by the Federal Reserve Board. Currently Regulation T requires an initial deposit of $2,000 or more for a margin account, and, initially, 50% or more in cash or eligible securities as security for any borrowing to buy securities."
One of the things that scares me so much about my use of margin and the discussion on this matter is that I am afrid I may be encouraging others to utilize debt in investing. I believe in a disciplined approach to investing. Starting slow is fine. I have been successful using margin thus far because of the incredible strength of the market. I know that if a large correction ensues, my losses will be magnified due to leverage on the downside. I am also afraid that the current market is 'long in tooth' so to speak and that a significant correction may well be overdue. If I believed strongly in margin, then I would have gone full speed ahead and bought my 21st to 25th postions. But my own comfort level on this has been exceeded.
Here is a comment from another article on the causes of the 1929 crash:
"The Crash of 1929
On September 4, 1929, the stock market hit an all-time high. Banks were heavily invested in stocks, and individual investors borrowed on margin to invest in stocks. On October 29, 1929, the stock market dropped 11.5%, bringing the Dow 39.6% off its high.
After the crash, the stock market mounted a slow comeback. By the summer of 1930, the market was up 30% from the crash low. But by July 1932, the stock market hit a low that made the 1929 crash. By the summer of 1932, the Dow had lost almost 89% of its value and traded more than 50% below the low it had reached on October 29, 1929.
Causes of the Crash:
- Overvalued Stocks. Some analysts also maintain stocks were heavily overbought;
- Low Margin Requirements. At the time of the crash, you needed to put down only 10% cash in order to buy stocks. If you wanted to invest $10,000 in stocks, only $1,000 in cash was required;
- Interest Rate Hikes. The Fed aggressively raised interest rates on broker loans;
- Poor Banking Structures. There were few federal restrictions on start-up capital requirements for new banks. As a result, many banks were highly insolvent. When these banks started to invest heavily in the stock market, the results proved to be devastating, once the market started to crash. By 1932, 40% of all banks in the U.S. had gone out of business.
In total, 14 billion dollars of wealth were lost during the market crash."
I hope that this discussion answers your questions on margin. I really believe that most investors would do well avoiding margin entirely. It is far better to start investing slowly, saving regularly, and building your portfolio over time. It will grow quick enough without the added risk of margin and the costs associated with debt.
Thanks so much for writing. I appreciate your loyalty and continued participation on this website and look forward to your and everyone else's comments and questions! If you would like to add a comment or question, please feel free to leave them on the blog or email me at bobsadviceforstocks@lycos.com.
Bob
Posted by bobsadviceforstocks at 5:43 PM CDT
|
Post Comment |
Permalink
Updated: Saturday, 2 June 2007 6:58 PM CDT
Esterline Technologies (ESL)
Hello Friends! Thanks so much for stopping by and visiting my blog, Stock Picks Bob's Advice! As always, please remember that I am an amateur investor, so please remember to consult with your professional investment advisers prior to making any investment decisions based on information on this website.
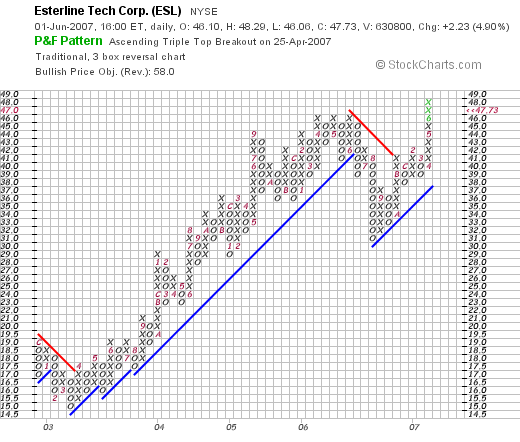
 I was looking through the list of top % gainers on the NYSE yesterday and this morning and came across Esterline Technologies (ESL), which closed yesterday at $47.73, up $2.23 or 4.90% on the day. I do not own any shares or options on this company. However, after reviewing the data available, I believe this stock deserves a place on this blog and
ESTERLINE (ESL) IS RATED A BUY
Let me explain why I have decided to add this company to my list of 'investable' companies!
What exactly does this company do?
According to the Yahoo "Profile" on Esterline, the company
 "...engages in the design, manufacture, sale, and marketing of engineered products and systems to the aerospace and defense industry in the United States and internationally. It offers avionics and controls systems, including technology interface systems for various applications in military, commercial aircraft, and land and sea-based military vehicles; secure communications systems; specialized medical equipment; and other industrial applications."
How did the company do in the latest quarter?
On May 31, 2007, Esterline reported 2nd quarter 2007 results. For the quarter ended April 27, 2007, sales were $312.3 million, up from last year's $247.9 million. Net earnings came in this year at $19.8 million or $.76/diluted share, up from last year's $17.7 million or $.68/diluted share in the same period.
These results beat expectations of $289.4 million in revenue and earnings of $.65/share. The company also raised guidance, increasing the lower range of earnings to a 2007 profit of $2.50 to $2.60/share, up from prior guidance of $2.45 to $2.60/share.
What about longer-term financial results?
Reviewing the "5-Yr Restated" financials on Esterline from Morningstar.com, we can see that revenue has been steadily rising with $.4 billion in revenue in 2002 increasing to $972 million in 2006 and $1.02 billion in the trailing twelve months (TTM). During this same period, except for a dip in earnings from $1.35/share in 2002 to $1.33/share in 2003, the company has been increasing earnings to $2.15/share in 2006 and $2.32/share in the trailing twelve months. No dividend is paid. Shares have been increasing very slowly with 21 million shares in 2003, increasing by about 25% to 26 million in the TTM. During this same period, revenue has grown about 100% and earnings have also almost doubled. This is an acceptable dilution from my perspective.
Free cash flow has been a bit erratic recently but positive with $41 million in 2004, $53 million in 2005, $10 million in 2006 and $20 million in the TTM.
The balance sheet looks solid with $48.3 million in cash as well as $419.5 million in other current assets. This total of $467.8 million in current assets, when compared to the $178.4 million in current liabilities yields a healthy current ratio of 2.62.
What about some valuation numbers on this stock?
Reviewing Yahoo "Key Statistics" on Esterline, we can see that this is a mid cap stock with a market capitalization of $1.22 billion. The trailing p/e is a very reasonable (imho) 20.56 with a forward p/e of 15.65 (fye 27-Oct-08 estimated). The PEG (5 yr expected) works out to a very nice 1.02.
According to the Fidelity.com eresearch website, the company has a Price/Sales (TTM) ratio of 1.12, under the industry average of 1.46. In terms of profitability, the company is reported to be less profitable than the industry average at 8.53% ROE (TTM), compared to the average of 22.12%.
Yahoo reports 25.58 million shares outstanding for Esterline, with 25.50 million that float. As of 5/10/07, there were 1.86 million shares out short representing 10.9 trading days of volume or 10.3% of the float. Using my own arbitrary '3 day rule' for significance in this ratio, this suggests that there is a great deal of pent-up buying demand waiting to be activated, that is, there are a lot of short-sellers who have already sold shares in ESL betting the stock will decline. These sellers may well be squeezed as the latest good earnings report will certainly pressure them to buy back these shares. Of course that is only my own 'best guess' on these shares, many of which could possibly already be re-purchased.
As I noted, no dividend is paid and the last stock split was a 2:1 split back in April, 1998.
What does the chart look like?
If we review a "Point & Figure" chart on Esterline (ESL) from StockCharts.com, we can see that the stock which showed some weakness back in March, 2003, had a strong run from $15/share at that time to a peak in June, 2006, when the stock hit $46. More recently the stock has pulled back to a low of $30 in August, 2006, only to climb once again, breaking through resistance in Novembe,r 2006 at $41, and now climbing to new heights at $47.73. The stock chart looks encouraging to me.
Summary: What do I think?
Let's review a few of the things I have discussed above. First of all they came in with what I would call a solid earnings report, beating expectations on both revenue and earnings and also raised guidance. Their Morningstar report looks quite good with steady revenue and earnings growth the past several years with relatively stable outstanding shares. Free cash flow is a bit erratic but always positive and the balance sheet is solid.
Valuation-wise the p/e is reasonable, the PEG is just over 1.0, and the Price/Sales is good relative to its peers. However, profitability, in terms of ROE is not quite as impressive as other companies in its industry per Fidelity. To top it off, we may well have a bit of a short squeeze on our hands with over 10 days of short interest outstanding and the company reporting a solid earnings report. Finally, the chart looks positive to me!
Thanks again for visiting and participating here on this blog. Always remember I am an amateur investor! If you have any comments or questions, please feel free to leave them on the blog or email me at bobsadviceforstocks@lycos.com. If you get a chance, be sure and visit my Stock Picks Podcast Website!
Bob
Thursday, 31 May 2007
CommScope (CTV)
Hello Friends! Thanks so much for stopping by and visiting my blog, Stock Picks Bob's Advice! As always, please remember that I am an amateur investor so please remember to consult with your professional investment advisers prior to making any investment decisions based on information on this website.
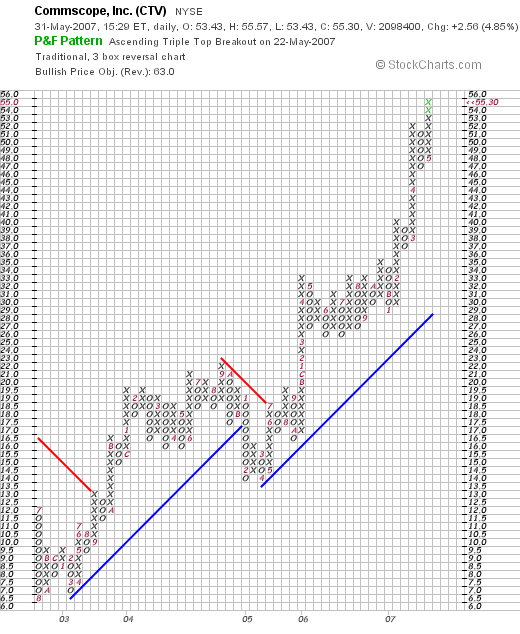
 I was looking through the list of top % gainers on the NYSE today, and came across CommScope (CTV), which as I write, near the close of trading today, is trading at $54.77, up $2.08 or 3.94% on the day. I do not own any shares of CTV nor do I have any options. However, I would like to share with you why I believe this stock deserves a place on this blog and why
COMMSCOPE (CTV) IS RATED A BUY
What exactly does this company do?
According to the Yahoo "Profile" on CommScope, the company
 "...together with its subsidiaries, provides infrastructure solutions for communications networks worldwide. It engages in the design, manufacture, and marketing of electronic, coaxial, and fiber optic cable products for data networking, Internet access, wireless communication, telephony, and other broadband applications."
How did they do in the latest quarter?
On April 26, 2007, CommScope announced 1st quarter 2007 results. For the quarter ended March 31, 2007, the company reported sales of $435.5 million, up 24% from last year's sales of $352.3 million in the same quarter in 2006. Net income was $45.9 million in 2007, up sharply from $12.7 million in 2006 same quarter. Earnings per share came in at $.63, up more than 200% from the $.19/diluted share reported in the first quarter of 2006.
The company raised guidance for fiscal 2007 from sales of $1.72 to $1.76 billion to a new estimate of $1.84 to $1.89 billion.
This report beat expectations of sales of $420.1 million and earnings of $.52/share. Thus the company not only came in with strong results, but they beat expectations and raised guidance. There isn't much more a company can report that is more bullish for a stock than this!
What about longer-term results?
Examining the Morningstar.com "5-Yr Restated" financials on CommScope, we can see that revenue, which took a dip from $598 million in 2002 to $573 million in 2003, has subsequently grown strongly to $1.62 billion in 2006 and $1.71 billion in the trailing twelve months (TTM).
Earnings which dipped from a loss of $(1.10) in 2002 to $(1.19) in 2003, turned profitable at $1.15 in 2004, dipped to $.78/share in 2005, but then once again resumed a climb to $1.84/share in 2006 and $2.28/share in the TTM.
The company has maintained a stable number of shares outstanding with 61 million reported in 2002, and 61 million reported in the TTM. Free cash flow has been solid with $95 million in 2004, dropping to $66 million in 2005 before increasing to $87 million in 2006 and $119 million in the TTM.
The balance sheet is excellent with $459.8 million in cash, more than enough to cover the $197.4 million in current liabilities more than twice over. In fact, the total current assets, including the $438.7 million in 'other current assets' is $898.5 million, yielding a current ratio of 4.55.
What about valuation numbers?
Looking at Yahoo "Key Statistics" on CTV, we can see that the company is a mid cap stock with a market capitalization of $3.35 billion. The trailing p/e is a moderate 24.10 with a forward p/e (fye 31-Dec-08) estimated at 19.20. The PEG (5 yr expected) is estimated at a reasonable 1.31.
Reviewing the Fidelity.com eresearch website, we can see that the Price/Sales (TTM) is a reasonable 1.85, compared to the industry average of 4.30. Profitability is quite good at 22.59 Return on Equity (TTM) compared to the industry average of 21.66.
Finishing up with Yahoo, there are 61.23 million shares outstanding with 60.53 million that float. As of 4/10/07, there were 3.87 million shares out short, representing 6.4% of the float or a somewhat significant 3.7 trading days of volume (I use 3 days as my somewhat arbitrary cut-off for short interest significance). No dividend and no stock splits are reported on Yahoo.
What does the chart look like?
Reviewing the "Point & Figure" chart on CTV from StockCharts.com, we can see that except for a slight price dip in January, 2005, the stock has moved steadily higher from the $6.50 range in August, 2002, to the current level of $55.30. Simply put, this appears to be a very strong, if not slightly overextended, chart.
Summary: What do I think?
For a variety of reasons I like this stock. Let's go over a few things I just discussed. First of all, the stock is moving strongly higher today suggesting good price momentum. The latest quarter was solid. The company beat expectations for both revenue and earnings and went ahead and raised guidance. They have been doing well for the last several years with steady revenue and earnings growth without expansion of the outstanding shares.
Free cash flow is positive and growing and the balance sheet is solid. Lots of cash.
Valuation-wise the p/e isn't too high in the 20's and the forward p/e is better in the teens. Looking at the PEG, the company is appropriately valued with a PEG under 1.5. The Price/Sales ratio is good for its industry and the Return on Equity is better than average as well. Finally, the chart looks very strong. What else could an investor want?
Anyhow, if I were buying a stock, this is the stock I would be buying today. Meanwhile, I shall be filing it away into my 'vocabulary' of stocks, waiting for the appropriate time to buy....if that should arise!
Thanks again for visiting! If you have any comments or questions, please feel free to leave them on the blog or email me at bobsadviceforstocks@lycos.com. If you get a chance, be sure and visit my Stock Picks Podcast Website where, if I get a chance, I shall be adding a new episode soon.
Bob
Posted by bobsadviceforstocks at 3:16 PM CDT
|
Post Comment |
Permalink
Updated: Thursday, 31 May 2007 5:53 PM CDT
A Reader Writes "...have you found using margin to be a good investment?"
Hello Friends. Thanks so much for stopping by and visiting my blog, Stock Picks Bob's Advice! As always, please remember that I am an amateur investor, so please remember to consult with your professional investment advisers prior to making any investment decision based on information on this website!
I had a nice comment from one of my most loyal of readers, Eric, who wrote:
"Hi Bob,
Thanks for the posts!
I was wondering if you could share your thoughts on using margin. The 10% interest rate seems steep but the increased buying power is a big draw. I realize you are trying to buy down your margin, but overall have you found using margin to be a good investment? Would you suggest using it with an interest rate as high as 10%?
Thanks for your time and advice!
Eric"
I think this deserves an honest response. I spend a lot of time preaching against using margin and then I go and use it! It is certainly one of those "Do as I say, not what I do!" moments. But I certainly do not believe that margin, or buying on leverage, is a good idea for most investors. It simply increases the volatility of one's account.
In an up-market, it certainly does help. But it also magnifies losses on the way down, so that is the part that all of you 'newbies' are not quite as familiar with. That is why I stopped at 20 positions as my margin balance really became unrealistic. If anything, I wouldn't recomment getting below 80% equity levels on margin or borrowed money. If you are to have margin at all.
Currently, my own Trading Account, even after the big rally and my latest sale, sits at $53,853.72. I have $66,205.55 in margin debt. My total holdings stand at $120,059.27. Thus, I am sitting at a 44.85% margin level. Way too much debt to make me comfortable.
It is well known that margin contributed to the calamity of the Great Crash in 1929. At that time people were putting, as I recall off the top of my head, like 10% down. Currently minimum margin requirements are as low as 30%. I am really not that far above the minimum level to avoid what is called as a "margin call". Different equities have different margin requirements.
So while I believe in an aggressive and disciplined trading and investment approach. My own goal is to eliminate margin and to use my own trades and sales to do so. By the way, year-to-date, I have a net of $12,309.61 in realized gains so far, including a net of $3,062.06 of short-term gains and $9,247.55 in long-term gains. These are real profits based on net sales of stocks including losses and gains combined. So the market has been kind to me.
In addition, I have $32,335.12 in unrealized gains which represent my net of profits and losses that are still paper profits, that are what would happen if I sold all of my 20 stocks today. So the market is kind to me.
I do not plan on moving beyond 20 positions until I have reduced my margin balance significantly. I may move back to 25 if I get to 80% equity levels. Or I may wait to pay off the whole thing. I will keep you posted :).
Thanks so much for commenting and visiting. If you have any other questions, or any of you other readers, (is that good English?), then go ahead and leave them on the blog or email me at bobsadviceforstocks@lycos.com.
Bob
Wednesday, 30 May 2007
Ventana Medical Systems (VMSI) "Trading Transparency"
Hello Friends! Thanks so much for stopping by and visiting my blog, Stock Picks Bob's Advice! As always, please remember that I am an amateur investor, so please remember to consult with your professional investment advisers prior to making any investment decisions based on information on this website.
A few moments ago, with the market shrugging off the China sell-off news in the States, my Ventana Medical Systems (VMSI) hit a sale point on an appreciation target. I sold 26 shares of VMSI at a price of $51.64. This represented 1/7th of my position of 188 shares which were purchased on 4/16/04 with a cost basis of $23.47. Thus, my shares had hit an appreciation of $28.17 or 120% from purchase. I have sold shares of Ventana three times previously--at a level of 30, 60, and 90% appreciation targets--and had been waiting for the 120% appreciation level to trigger a partial sale--I am now selling 1/7th of my remaining position--and did so!
Since I am at my 'new' maximum of 20 positions (which I adjusted downward from 25 in light of my hefty margin level of about 50%), I shall be 'sitting on my hands' with the proceeds of this sale, applying it to my margin balance, and waiting until I once again dip below 20 positions before using a sale at a gain ("good news") to give me that "permission slip" to add a new position to my portfolio.
When shall I sell Ventana next? On the upside, my next four sale points shall be at 60% intervals--that is, at 180, 240, 300 and 360% appreciation levels--if they are reached. At those levels, I shall be selling 1/7th of my remaining shares. A 180% gain would mean the stock price would have to reach 2.80 x $23.47 = $65.72 before selling once again some additional shares. Since I now have 162 shares, 1/7th of that total would mean a sale of 23 shares at that higher level.
On the downside, I certainly reserve the right to sell all of my remaining shares on any fundamentally bad news announcement. On a price basis, should the shares decline to 50% of the highest targeted appreciation level, that is since I just sold at the 120% appreciation level, if shares should dip back to 60% appreciation levels or 1.60 x $23.47 = $37.55, then likewise, I shall be selling all remaining shares of that position.
Thanks so much for stopping by and visiting! If you have any comments or questions, please feel free to leave them on the blog or email me at bobsadviceforstocks@lycos.com. If you get a chance, be sure and visit my Stock Picks Podcast Website where I discuss many of the same stocks I write about on the blog.
Bob
Monday, 28 May 2007
"Looking Back One Year" A review of stock picks from the week of January 2, 2006
Hello Friends! Thanks so much for stopping by and visiting my blog, Stock Picks Bob's Advice! As always, please remember that I am an amateur investor, so please remember to consult with your professional investment advisers prior to making any investment decisions based on information on this website.
I hope that all of you in the States are having a nice Memorial Day. I certainly would like to express my words of appreciation for all those young men and women who are serving their nation today and to remember all of those who have died in current and past conflicts. We need to be proud of them and yet at the same time double our own efforts at improving understanding among all people and trying to make war and conflict a thing of history.
As part of my blog I have been trying to use the weekend as a time to review past stock picks. These review assume a buy and hold strategy. I do this due to the ease of review. I am rather 'low-tech' on this blog, and it is easy to look at past stock picks and simply see how they have changed in price. However, in practice, I utilize a very disciplined portfolio investment strategy that requires me to sell stocks both on small losses as well as partial sales on appreciation targets. The difference in these strategies would certainly affect performance outcome and should be taken into consideration when reviewing the results I shall be discussing.
Last week I reviewed the week of December 26, 2005; going a week ahead, let's take a look at the stock picks discussed on this blog during the week of January 2, 2006. If you are interested in looking closer at these selections (or others) I would encourage you to use the links on Stock Picks Bob's Advice along the left side of the entries that will get you to all of the past entries on this website by date.
 On January 3, 2006, I reviewed Thoratec (THOR) on Stock Picks Bob's Advice when the stock was trading at $22.52. I do not own any shares of this stock. THOR closed at $19.24 on May 25, 2007, for a loss of $(3.28) or (14.6)% since posting.
The following is a "Point & Figure" chart on Thoratec (THOR) from StockChart.som:
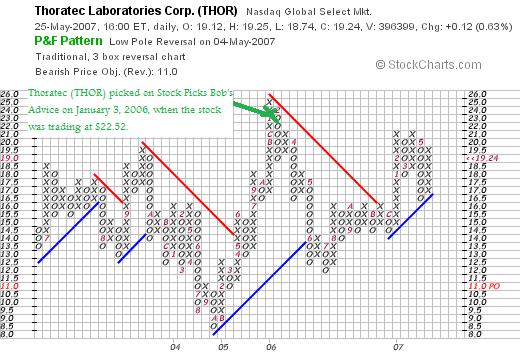
On May 3, 2007, Thoratec (THOR) reported 1st quarter 2007 results. Revenue for the quarter came in at $57.3 million, up 18% from last year's $48.8 million in the same period. However, the company came in with a loss of $(930,000) or $(.02)/share. "Excluding items", the company came in at a profit of $4.3 million or $.08/share, up from $3.2 million or $.06/share last year. This was good enough to beat expectations of $.07/share on revenue of $54.4 million.
Even though the company improved profits on a non-GAAP basis, I really require financial performance to be evaluated on 'generally accepted accounting principles' and thus, since the company did grow revenue,
THORATEC (THOR) IS RATED A HOLD
 On January 3, 2006, I 'picked' Neoware Systems (NWRE) for Stock Picks Bob's Advice when the stock was trading at $25.63. Neoware (NWRE) closed at $11.68/share on May 25, 2007, for a loss of $(13.95) or (54.4)% since posting. I do not own any shares of Neoware.
The following is a "Point & Figure" chart on Neoware from StockCharts.com:
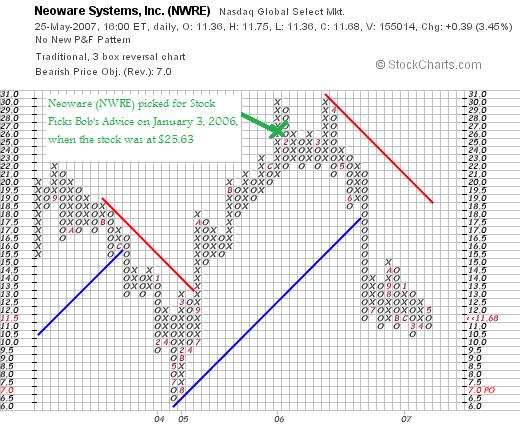
On May 1, 2007, Neoware (NWRE) announced 3rd quarter 2007 results. For the quarter ended March 31, 2007, revenue came in at $22.1 million, down from $27.8 million in the prior year. The company came in with a loss of $(.05)/diluted share, down from net income of $.12/share last year. Due to the decline in revenue and the decline of earnings with a loss,
NEOWARE (NWRE) IS RATED A SELL
 On January 4, 2006, I posted HealthExtras (HLEX) on Stock Picks Bob's Advice when the stock was trading at $30.51. HLEX closed at $30.17 on May 25, 2007, for a loss of $(.34)/share or (1.1)% since posting. I do not own any shares of HLEX.
The following is a "Point & Figure" chart on HealthExtras from StockCharts.com:
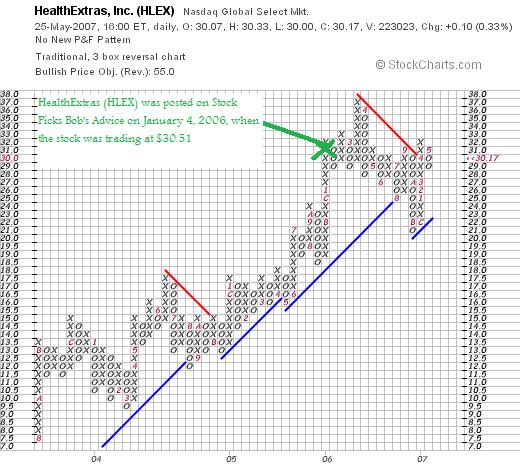
On May 7, 2007, HealthExtras announced 1st quarter 2007 results. For the quarter ended March 31, 2007, revenue totaled $406.4 million, up 70% from first quarter 2006 revenues of $238.7 million. Net income came in at $9.7 million or $.23/share, up 69% from $5.8 million or $.14/share the prior year same period.
Apparently, analysts were expecting $.23/share in earnings which HLEX met, but revenue had been expected to come in at $415.4 million with HLEX reporting revenue results slightly under this amount.
But with the strong revenue and earnings growth,
HEALTHEXTRAS (HLEX) IS RATED A BUY
 On January 5, 2006, I posted True Religion Apparel (TRLG) on Stock Picks Bob's Advice when the stock was trading at $19.40/share. TRLG closedat $15.63 on May 25, 2007, for a loss of $(3.77) or (19.4)% since posting. I do not own any shares of this stock.
The following is a "Point & Figure" chart on TRLG from StockCharts.com:
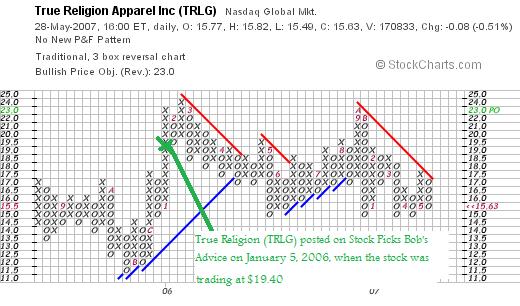
On May 8, 2007, True Religion (TRLG) announced 1st quarter 2007 results. For the quarter ended March 31, 2007, net sales grew to $36.1 million, up from $35.6 million in the same quarter last year. Net income, however, dropped to $4.2 million or $.18/share, from $6.5 million or $.28/diluted share last year. In light of the sales increase but the decrease in earnings,
TRUE RELIGION (TRLG) IS RATED A HOLD
 Finally, on January 6, 2006, I posted AngioDynamics (ANGO) on Stock Picks Bob's Advice when the stock was trading at $26.22. ANGO closed at $16.15 on May 25, 2007, for a loss of $(10.07)/share or (38.4)%. I do not currently own any shares of AngioDynamics.
The following is a "Point & Figure" chart on AngioDynamics from StockCharts.com:
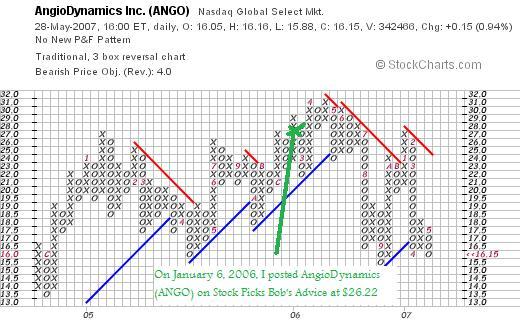
On March 27, 2007, AngioDynamics reported 3rd quarter 2007 results. Net sales increased 35.1% to $26.7 million compared with sales of $19.8 million in the third quarter of 2006. However, the company reported an operating loss of $10.5 million which included R&D expense of $12.1 million "associated with the RITA Medical acquisition." This worked out to a loww of $(.55)/share compared with a profit of $.14/share the year-earlier.
In light of the strong revenue growth but the switch from profit to loss,
ANGIODYNAMICS (ANGO) IS RATED A HOLD
So how did I do during this week over the New Year's holiday in 2006? In a word, AWFUL! I had five "picks" and EVERY SINGLE ONE DECLINED! How is THAT for TERRIBLE? The average loss worked out to a loss of (25.6)%!
This review I hope points out a few salient points. First of all, I am trying very hard to be scrupulously honest on this blog, and in addition am quite capable of picking stocks that decline. I have been asked multiple times why I hold to my 8% loss limit. Why not buy more shares if you like the stock I am asked. It is because of stock picks like this that require me to be disciplined.
"You have to kiss a lot of frogs to find a Prince!" (from Kiss Me Frog)

So no, there is nothing magical about what I do. Sometimes I pick GREAT stocks, companies like Bolt (BTJ) or Precision Castparts (PCP) or Coach (COH). But there are many times that my process results in stocks that don't work out. Companies that find their fortunes changing; an event that the individual investor cannot hope to anticipate. However, we can respond to the market's actions. We can limit our losses in our own accounts, and we can continue to strive to find the right "frog"!
Have a great weekend everyone...what's left :). And if you have any comments or questions, please feel free to leave them on the blog or email me at bobsadviceforstocks@lycos.com. If you get a chance, be sure and visit my Stock Picks Podcast Website.
Bob
Posted by bobsadviceforstocks at 12:10 PM CDT
|
Post Comment |
Permalink
Updated: Monday, 28 May 2007 3:55 PM CDT
Saturday, 26 May 2007
Flotek Industries (FTK)
Hello Friends! Thanks so much for stopping by and visiting my blog, Stock Picks Bob's Advice! As always, please remember that I am an amateur investor, so please remember to consult with your professional investment advisers prior to making any investment decisions based on information on this website.
I would like to apologize once again for not making as many stock "picks" recently as I have in the past. My life and time demands keeps getting busier and busier and I suspect that I shall be making fewer posts than previously for the Summer and hopefully in the next few months shall be able to pick up the pace once again. But I intend to continue to post interesting stocks from time to time and continue with the trading "transparency" that shall keep you posted on my actual trading portfolio and the activity therein. I also intend to continue with the "weekend reviews" and the "trading portfolio reviews" so my anticipated 'backing-off' of blogging is likely not to materialize anyhow :).
 This morning, I took a look at the stocks moving higher yesterday and came across a new name for me, Flotek (FTK), that I believe deserves a place on the blog. Flotek made the list of top % gainers on the AMEX, closing at $47.08, up $3.23 or 7.37% on the day.
I have reviewed so many different stocks that I thought I might have looked at this one previously, so I searched through my blog using Google, :), something that I suggest to all of you as well as my "pico search" function, but didn't find any reference to Flotek among my many past stock picks. I do not own any shares of this stock, nor do I have any options. However,
FLOTEK (FTK) IS RATED A BUY
Let's take a closer look at this company and I shall try to walk you through my thinking and why I like this stock. I recently had a note suggesting my recent Mesa Lab (MLAB) purchase might be like my Bolt (BTJ) success. I suspect this particular stock, also in the oil industry, and also on the AMEX might well act more like Bolt that MLAB, but then again I would be just speculating on the future. You know I don't like to do THAT! :). But as Ed Sullivan like to say, let's get on with the shooooo.
What exactly does this company do?
According to the Yahoo "Profile" on Flotek, the company
 "...provides oilfield services and equipment to the energy and mining industries in the United States and internationally. It has three segments: Chemicals and Logistics, Drilling Products, and Artificial Lift."
How did they do in the latest quarter?
On May 9, 2007, Flotek announced 1st quarter 2007 results. For the quarter ended March 31, 2007, revenues grew 118% to $35.1 million, up from $16.1 million in the year-ago same period. Net income came in at $3.7 million or $.39/diluted share, up 111% from the $1.8 million, and up 105% from the $.19/diluted share in the same period in 2006.
What about longer-term results?
If we examine the Morningstar.com "5-Yr Restated" financials on Flotek, we can see a very pretty picture of steady revenue growth from $11.3 million in 2002 to $52.9 million in 2005 and $100.6 million in 2006. Extrapolating the current quarter (which we cannot routinely do not knowing the seasonality of results) would get us to at least a $140 million rate for 2007. Earnings, which were losses in 2002 and 2003 at $(1.10 and $1.23 respectively), turned profitable in 2004 at $.31/share, increased to $.94/share in 2005 and $1.22/share in 2006.
No dividends have been paid, and the company has slightly increased its outstanding shares from 5 million in 2002 to 9 million in 2006. This 80% increase in shares is somewhat concerning. However, the company has increased its revenue over 800% during the same period. I can live with this dilution :).
Free cash flow, while small, has been positive recently with $2 million in 2004, $-0- in 2005, and $3 million in 2006.
The balance sheet looks fine with $500,000 in cash and $37.6 million in other current assets. This total of $38.1 million in current assets can easily cover the $20.7 million in current liabilities yielding a current ratio of 1.82.
What about some valuation numbers on this stock?
Looking at Yahoo "Key Statistics" on FTK, we can see that this is a small cap stock with a market capitalization of only $427.53 million. The trailing p/e is a bit rich at 33.04, but the forward p/e is far better at 14.49 (fye 31-Dec-08). We don't have a PEG ratio, but with the rapid growth in the latest quarter (at over 100%) I suspect the PEG has to be at 1.0 or under from my own 'guesstimating' (is that an allowable word here?).
Using the Fidelity.com eresearch website, we can see that the stock is also richly valued in terms of the Price/Sales ratio where FTK comes in at a ratio of 3.49 (TTM), compared to the industry average of 2.02. However, Fidelity also points out that in terms of profitability, as measured by the Return on Equity (ROE), the company has a ROE (TTM) of 25.92%, well ahead of the industry average of 14.43%.
Finishing up with Yahoo, we can see that there are only 9.08 million shares outstanding with 6.73 million that float. Currently, there are 302,580 shares out short (as of 4/10/07), representing 3.9% of the float. However, due to the relatively low level of average trading volume (74,375 shares), this represents a significant (imho) level of short interest with 9 trading days of short sales (the short ratio). This short interest may well pressure the stock higher (as it seems to be currently doing) as the short-sellers, betting against the stock rise, may be "squeezed" into buying shares.
There are no dividends reported on Yahoo, and no stock splits.
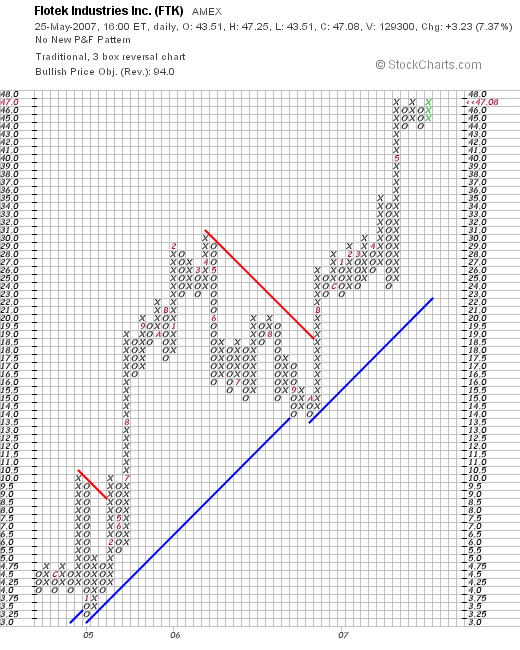
What about the chart?
If we look at a "Point & Figure" chart from StockCharts.com on Flotek, we can see what appears to be a very strong upward move for this stock from the $4.00 level in late 2004 to the current level around $47. The stock has been consolidating at the current level the last few weeks forming a flag formation. As I have pointed out previously, I am not a market technician, but the chart simply looks like the price has been moving strongly higher. I see nothing in the current news about the company that suggests anything should change.
Summary: What do I think about this stock?
Needless to say, I like this stock a lot. They reported a phenomenal quarterly report, the stock moved higher in the face of lots of naysayers and short-sellers who are likely now fueling the higher price move. The fundamentals are almost impeccable and the chart looks nice. The only thing it doesn't do is pay a dividend.
Anyhow, I wanted to get a great stock posted, and let you know I was still blogging :). If you have any comments or questions, please feel free to leave them on the blog or email me at bobsadviceforstocks@lycos.com. If you get a chance be sure and visit my Stock Picks Podcast Website.
Have a great Memorial Day Weekend everyone!
Bob
Thursday, 24 May 2007
A Reader Writes "This raises a question...."
Hello Friends! Thanks so much for stopping by and visiting my blog, Stock Picks Bob's Advice! As always, please remember that I am an amateur investor, so please remember to consult with your professional investment advisers prior to making any investment decisions based on information on this website.
Earlier today I had a great letter from Doug S. who wrote:
"Bob: looked at this when you wrote it up in January and didn't buy
because of float and more importantly volume(market makers typically have had a 1/2 to 1 point spread). This raises a question. When you run across a situation like this, great fundamentals with these
problem what are your thoughts. EBIX and even LECO(true float of only about 2 mil it's so closely held) are similar situations."
Doug,
Thanks so much for writing! You have written some very good points about selecting an appropriate stock for investment. In general, I have avoided making too many investments in the smallest of capitalization stocks. However, the utilization of trading rules and the fact that each investment is only a small part of a larger portfolio, allows me the liberty of occasionally purchasing stock in a company like Mesa which according to the Yahoo "profile" on Mesa, has a market capitalization of only $75 million, making this a "microcap" stock. Also, according to Yahoo, the company has a float of only 2.52 million shares and an averae trading volume of only 2,320 shares each day. One can easily imagine why there would be such a wide spread on the bid/ask equation and why an owner in this stock might experience increased volatility.
A small float can work in a positive fashion as well, as witnessed by the trading in the stock yesterday on the back of a strong earnings announcement.
Since I am prepared to part company with any of my investment on an 8% losss, this strategy gives me the confidence to buy shares in companies that might otherwise be too small fo be safe for purchase.
EBIX is also another tiny company with solid numbers. I wouldn't hesitate to buy this stock assuming the rest of the analysis was o.k. LECO, another great company, has a float of over 40 million so it doesn't really fit into the picture in the same fashion.
Bottom line is that assuming everything else is intact, I am prepared to buy stocks of small market capitalization firms. I am less anxious to buy low-priced stocks much under $10. I have found the lower priced stocks to have far too much price volatility to allow me to hang on to them very long.
I am not completely sure that I have answered your question. In summary, I am prepared to buy any particular stock that fits my criteria, and am prepared to sell any of the stocks I own if they hit a sale point that I have predetermined at the time of purchase. I try not to have too many tiny market cap stocks and often spend time looking at the NYSE for top % gainers in order to prevent this from happening in my account.
Let me know if I have addressed your own concerns. I can only tell you what I do. There isn't any correct answer for a question like this. Only opinions.
If you have any other comments or questions, please feel free to leave them on the blog or email me at bobsadviceforstocks@lycos.com.
Bob
Newer | Latest | Older


