 Hello Friends! Thanks so much for stopping by and visiting my blog, Stock Picks Bob's Advice. As always, please remember that I am an amateur investor, so please consult with your professional investment advisors prior to making any decisions based on information based on this website!
As I posted a few moments ago, I just purchased 400 shares of Perficient (PRFT) in my "Trading Portfolio". Since I have not (as far as I can recall) ever reviewed this stock, I wanted to do so as soon as possible. Perficient (PRFT) as I write, is trading at $9.33, up $.91 or 10.81% on the day.
 According to the Yahoo "Profile" on PRFT, Perficient "...is an e-business solutions services provider to large and major mid-size companies. It uses a solutions delivery approach called the Enabled Enterprise, which is designed to help clients reach new markets and increase revenues, acquire and strengthen customer relationships, reduce costs and increase productivity and empower employees."
On February 2, 2005, PRFT announced 4th quarter 2004 results. Total revenue came in at $21.6 million, up over 150% from $7.96 million the prior year. Diluted net income per share came in at $.06/share up 100% from the $.03/share the prior year. These results came in despite an increase in the share count from 16.5 million in 2003 to 23.0 million in 2004.
How about longer-term? Taking a look at a "5-Yr Restated" financials from Morningstar.com, we can see that revenue has grown fairly smartly from $2.6 million in revenue in 1999 to $45.2 million in the trailing twelve months (TTM).
The company was losing money between 2000 $(2.96)/share, through 2002-- $(.53)/share, turned profitable at $.07/share in 2003 and earned $.16/share in the trailing twelve months.
Free cash flow while small, has been positive and came in at $2 million in the TTM.
Balance sheet-wise, PRFT looks fine with $2.8 million in cash and $14.8 million in other current assets, as opposed to $9.8 million in current liabilities and $2.4 million in long-term liabilities.
How about "valuation"? Looking at "Key Statistics" on Yahoo for PRFT, we can see that this is a very small company with a market cap of $179.44 million. The trailing p/e is rich at 50.05 (with the company just turning profitable), the forward p/e (fye 31-Dec-06) is much better (based on estimates) at 27.38, with a 5-yr estimated PEG placed at 1.12. Price/sales is a bit rich at 2.76.
Yahoo reports 19.27 million shares outstanding with 13.40 million of them that float. Of these, only 476,000 or 3.55% of the float was out short as of 2/8/05, representing only 1.283 trading days of average volume.
No cash dividend and no stock dividends are reported on Yahoo.
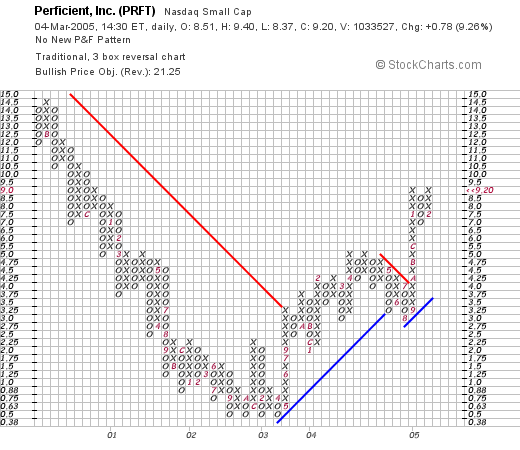
How about "technicals"? In other words, what does their chart look like? Taking a look at Stockcharts.com, looking at a "point & figure" chart:

We can see that this stock was actually fairly steadily declining in price between November, 2000, when it was trading around $14, down to quadruple bottom in September 2002 at around $.50/share (!), since then it has been trading higher to its current level around $9. At least for the last two years, the stock has been on a bullish move.
So what do I think? Well the stock made a nice move today, but generally I hate stocks under $10 because that 8% loss limit almost always (!) makes me stop right out of a particularly good stock for no particular reason :(. However, earnings were very strong, revenue growth is solid (how much from acquisitions though ?), valuation is reasonable, last five years shows steady growth, cash flow is positive, the balance sheet is good, and the technicals look just fine. Anyhow, I liked it enought that I DID buy some shares!
Thanks again for stopping by! I hope all of this discussion is helpful to you and I really enjoy your comments and emails! You can write me at bobsadviceforstocks@lycos.com.
Bob


