


 Hello Friends! Thanks so much for stopping by and visiting my blog, Stock Picks Bob's Advice! I found this photo of a blizzard in 2004 from a national weather service website and boy does it ever feel like that around here today. Just two days to Spring and we are getting snow here in the upper Midwest!
Since so many visitors here are new to my investing strategy, I will try to clearly go over the steps I use to select a stock that might be worth an investment. Above all, please remember that I am an amateur investor, so please consult with your professional investment advisors prior to taking any action based on information on this website.
 I first wrote up DRS Technologies (DRS) on Stock Picks Bob's Advice on August 6, 2003, when it was trading at $27.98. Currently, as I write, it is trading at $42.43, up $1.18, or 2.86%, which was enough for it to make the list of top % gainers on the NASDAQ. I do not own any shares of DRS nor do I own any options.
 Over the years, I have found the "top % gainers" lists to be quite helpful as a first screen of potential stocks that might be positioned to continue with their same-day momentum to higher price levels. More about DRS: according to the Yahoo "Profile" on DRS, this company "...is a supplier of defense electronic products and systems. The Company provides products and services to all branches of the United States military, aerospace and defense prime contractors; government intelligence agencies; international military forces, and industrial markets."
Generally, I have found it most useful to stay with stocks above $10. Otherwise, the volatility of the lower-priced stocks will cause me to sell the stock at an 8% loss far too often after a purchase.
Before settling on a stock, I first check the latest quarter earnings report looking for both growth in earnings as well as revenue. On February 9, 2005, DRS reported 3rd quarter 2005 results. Fiscal third quarter results showed revenues from continuing operations at $338.2 million, a 23% increase over revenues of $274.4 million the prior year. Earnings before interest, taxes, depreciation and amortization (EDITDA), came in at $48.1 million, a 34% increase from the prior year's $35.8 million in EBITDA earnings. Third quarter net earnings were $17.5 million or $.62/diluted share, up from $11.2 million or $.44/diluted share the prior year. These were strong results!
 After passing the "latest-quarter test", I look for a longer-term evaluation of earnings and revenue growth. One could call this "earnings persistence", a key criterion in my opinion, for a successful stock investment. For this I have turned to Morningstar.com and in particular the "5-Yr Restated" financials which for DRS is found here.
So what do I look for on this page? First of all, I love to see a beautiful 'ramp-up' of revenue growth as pictured by the series of bars on the graph at the top of the page. DRS has grown its revenue from $400 million in 2000 to $1.3 billion in the trailing twelve months (TTM).
Next, looking in the chart itself, I review the earnings growth history. For DRS, this is a beautiful picture of uninterrupted earnings growth from $.76/share in 2000 to $2.02 of earnings in the TTM.
Third, I like to review the "free cash flow" situation. Positive free cash flow means the company is basically building up genuine cash, and a growing positive free cash flow is even better. From this same page we can see that DRS had $14 million in free cash flow in 2002, and that this has been increasing so that in the TTM, this was up to $99 million.
Next, I try to assess the overall financial "health" of the company by looking at the balance sheet. What is crucial to me is that the current assets (cash and other current assets) is greater than the current liabilities. For DRS, the current assets total $485.5 million, which is more than enough to cover the $352.1 million in current liabilities and also enough to make a dent in the $588.8 million in long-term liabilities reported. While it would be nice to have current liabilities greater than the combined current and long-term debt, the balance-sheet picture for DRS still looks healthy to me, especially with the growth in free cash flow!
 Having reviewed some of the basic fundamental issues underlying this stock, I now try to briefly assess the valuation questions. While not a "value-investor" by any means, all things being equal, I am more optimistic in investing in a stock that shows good value than not.
I have found that an easily accessible site for finding valuation numbers is Yahoo on the "Key Statistics" for DRS page. Some key facts: the market cap is $1.16 billion, making this stock a mid-cap stock.
The trailing p/e is very reasonable (imho) at 21.94 and the forward p/e (based on fye 31-Mar-06 estimates) is even nicer at 17.73. Thus, the PEG is at 1.38. The PEG is a measure of valuation that takes into consideration the growth rate; that is, the price/earnings ratio compared to the growth rate, with 1.00 being considered fairly valued.
Price/sales is also cheap at 0.90. Again, using the 1.00 number as a cut-off on valuation.
Yahoo reports 27.32 million shares outstanding with 26.70 million that float. Of these, there were 1.99 million shares out short as of 2/8/05, representing 7.45% of the float or 6.311 trading days of volume. I have arbitrarily started using 3.0 days of short interest as a "significant level".
For anyone that doesn't understand "short interest", these are shares that speculators have borrowed and sold, anticipating a decline in share price to make a profit. They will have to be "covered" at a later date by repurchasing these shares by the short-sellers. Thus, a high level of short interest can become a bullish or positive factor in stock price performance, if there is a rush to buy shares on the development of good news. This "rush" is called a "short squeeze".
Finally, on Yahoo, one can see that there are no cash dividends and no stock dividends are reported in the recent past.
What do I do next? Well basically, if the fundamental issues, like recent earnings/revenue results, and the long-term earnings/revenue results, free cash flow, and balance sheet, as well as valuation is reasonable, well I like to check a "technical" picture by reviewing a stock chart.
I have been using Stockcharts.com for charting purposes, and have grown to like the "point & figure" charts, which for DRS is located here:
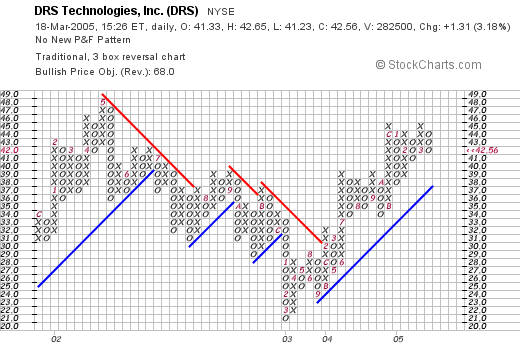
So what do I think of this chart? Well, the stock price, which peaked in May, 2002, at $48, declined from that point until March, 2003, bottoming at $21. Since then, it has been climbing once more, staying above the resistance line (blue), to its current level at $42.56. The graph looks strong for the past two years, and at the same time does not appear over-valued.
Overall, DRS is very attractive. On the downside, it is a defense-contractor, which may be subject to the political climate, however, there does not appear to be any let-up in demand for their services! The stock looked nice to me a year-and-a-half ago, when it was about 40% lower in price. The stock still looks strong, with great earnings, consistent revenue/earnings growth, growing free cash flow, reasonable balance sheet, reasonable valuation, and a decent if not overwhelming price chart.
If I were in the market to buy a stock, I might be considering this. However, my portfolio has actually been contracting, and I am, in fact, more likely to be unloading an issue than adding one in the immediate future!
Thanks again for stopping by! I hope that my discussion was not too verbose. If you have any comments, questions, or words of encouragement, please feel free to email me at bobsadviceforstocks@lycos.com.
Bob