


Hello Friends! Thanks so much for stopping by and visiting my blog, Stock Picks Bob's Advice. As always, please remember that I am an amateur investor so please consult with your professional investment advisors prior to making any investment decisions based on information on this website. I cannot be responsible for any losses generated by your trading activity nor can I make any claim for any gains you generate trading stocks and investments!
 I managed to scan the list of top % gainers on the NASDAQ today, and came across Bed Bath & Beyond (BBBY). BBBY had a great day, closing at $40.80, up $4.06 or 11.05% on the day. I do not own any shares or options on this stock. In fact, I had to go through my list of 2003 Stock Picks, 2004 Stock Picks, and 2005 Stock Picks, because I was almost certain that I had reviewed this one before!
  According to the Yahoo "Profile" on BBBY, Bed Bath and Beyond "...operates specialty retail stores in the United States, including Bed Bath & Beyond stores (BBB), Harmon stores and Christmas Tree Shops stores (CTS)."
What drove the stock nicely higher today was a "better-than expected" 4th quarter 2004 earnings report. For the final quarter of 2004, sales increased 13.1% to $1.47 billion from $1.3 billion in the fourth quarter of 2003. Same-store-sales growth came in at 5.1% for stores open at least a year. Net income came in at $181 million or $.59/share up from $144.2 million or $.47/share last year. According to this report, analysts surveyed by Thomson Financial were "looking for the company to post earnings of $.55/share on sales of $1.45 billion.
 Taking a look at the Morningstar.com "5-Yr Restated" financials, we can see a beautiful ramp-up of revenue from $1.9 billion in 2000 to $5.0 billion in the trailing twelve months (TTM).
 Earnings during this period have a perfect growth record with $.46/share reported in 2000, increasing to $1.53 in the TTM.
Free cash flow has also been solid with $216 million in 2002, increasing to $417 million in the TTM.
The balance sheet is also very nice with $968.8 million in cash, enough to almost cover both the $885.0 million in current liabilities and the $114.8 million in long-term liabilities combined. Besides the cash, Morningstar.com reports $1.3 billion in other current assets!
 What about "valuation" questions? Taking a look at the Yahoo "Key Statistics", we can see that this is a large cap stock with a market capitalization of $12.35 Billion. The trailing p/e is a moderate 24.76 with a forward p/e (fye 26-Feb-07) of 18.38, and thus a 5-yr estimated PEG of 0.86. Price/sales is moderate at 2.23.
Yahoo reports 302.61 million shares outstanding with 300.80 million of them that float. There were 6.00 million shares out short as of 3/8/05, representing only 1.99% of the float or 2.078 trading days of volume. No cash dividend is paid and the last stock split reported on Yahoo was a 2:1 split 8/14/00.
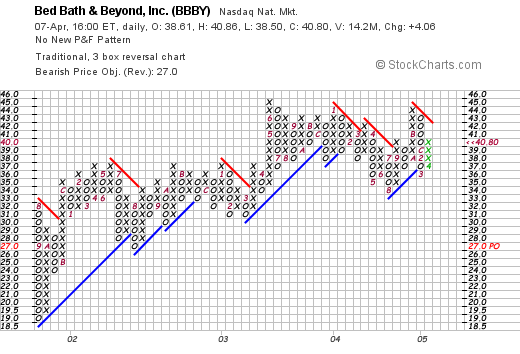
What does the price chart look like? How are the "technicals" on BBBY? Looking at a "Point & Figure" chart from Stockcharts.com on BBBY, we can see that this stock has been showing modest price appreciation since trading at around $19.0 in September of 2001. The stock has hit resistance at the $45 level since hitting it in June, 2003, again in January, 2004, and again in October 2004. I don't think the stock price movement has gotten too far ahead of itself, but would like to see the price break above $45, which it coule do in the next couple of trading sessions.
 So what do I think about all of this? Well, actually, I like this stock a lot. The latest quarter result was solid, with 5.1% same store sales growth as well. The past five years show a perfect record of increasing revenue and earnings growth. The company is spinning off 'gobs' of free cash flow contributing to a solid balance sheet. The valuation issues are reasonable and the graph looks adequate, appearing to have been consolidating in price for about a year now.
If I had some money, and was going to purchase some stock, this one would be near the top of my list today. As you know, I wait for a buy signal generated by my own portfolio before jumping in! So I shall be sitting on my hands for now. Thanks so much again for stopping by and visiting. Please feel free to leave comments right here on my blog, or if you have any questions or comments, and would like to write, you can email me at bobsadviceforstocks@lycos.com!
Bob